Home > Analyses > Healthcare > AstraZeneca PLC
AstraZeneca transforms lives by pioneering cutting-edge therapies that tackle some of the most challenging diseases, from oncology to cardiovascular and rare conditions. As a global biopharmaceutical powerhouse, it boasts a robust portfolio including Tagrisso, Imfinzi, and Farxiga, and a reputation for innovation driven by strategic AI collaborations. With a market presence spanning continents and a commitment to breakthrough science, the key question remains: does AstraZeneca’s current valuation fully reflect its growth trajectory and fundamental strengths?

Table of contents
Business Model & Company Overview
AstraZeneca PLC, founded in 1992 and headquartered in Cambridge, UK, stands as a dominant force in the global biopharmaceutical industry. Its core mission revolves around an integrated ecosystem of prescription medicines targeting cardiovascular, oncology, metabolism, and rare diseases. The company’s portfolio includes notable drugs such as Tagrisso, Imfinzi, and Farxiga, reflecting a broad therapeutic reach that supports both primary and specialty care worldwide.
The company’s revenue engine combines innovative drug discovery with robust commercialization across the Americas, Europe, Asia, and beyond. AstraZeneca balances its value creation between patented pharmaceuticals and strategic collaborations leveraging AI-driven drug discovery. This diversified approach, coupled with an extensive global footprint, fortifies its competitive advantage and economic moat, positioning AstraZeneca as a key architect in shaping the future of healthcare.
Financial Performance & Fundamental Metrics
In this section, I analyze AstraZeneca PLC’s income statement, key financial ratios, and dividend payout policy to assess its overall financial health and stability.
Income Statement
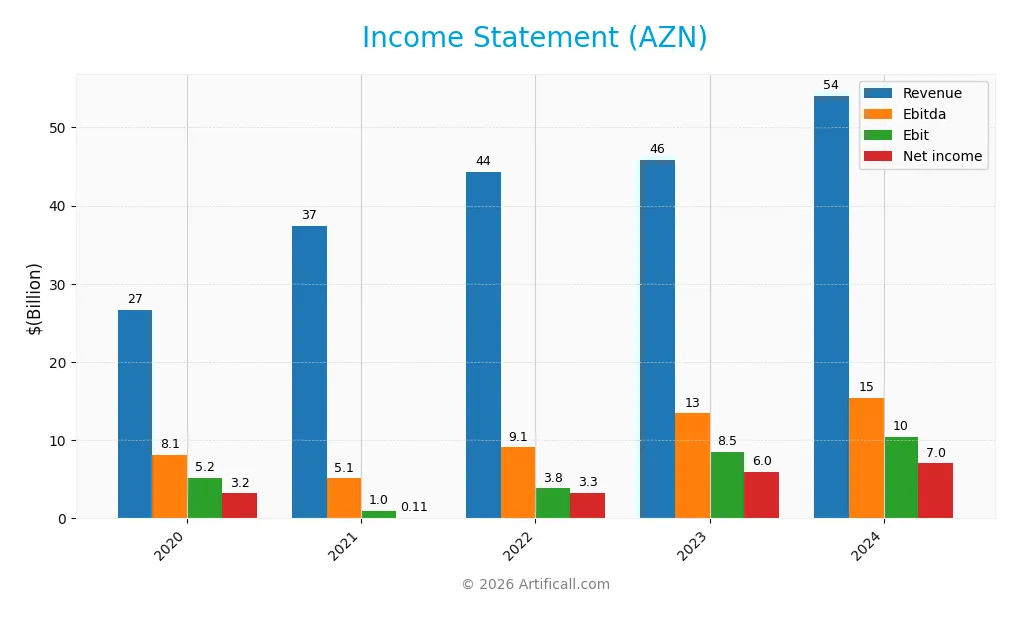
The table below summarizes AstraZeneca PLC’s key income statement figures for the fiscal years 2020 through 2024, reported in USD.

| 2020 | 2021 | 2022 | 2023 | 2024 | |
|---|---|---|---|---|---|
| Revenue | 26.6B | 37.4B | 44.4B | 45.8B | 54.1B |
| Cost of Revenue | 5.3B | 12.4B | 12.4B | 8.3B | 10.2B |
| Operating Expenses | 16.2B | 23.9B | 28.2B | 29.4B | 33.9B |
| Gross Profit | 21.3B | 25.0B | 32.0B | 37.5B | 43.9B |
| EBITDA | 8.1B | 5.1B | 9.1B | 13.4B | 15.4B |
| EBIT | 5.2B | 1.0B | 3.8B | 8.5B | 10.4B |
| Interest Expense | 1.3B | 1.3B | 1.3B | 1.6B | 1.7B |
| Net Income | 3.2B | 0.1B | 3.3B | 6.0B | 7.0B |
| EPS | 1.22 | 0.04 | 1.06 | 1.91 | 1.14 |
| Filing Date | 2020-12-31 | 2021-12-31 | 2022-12-31 | 2023-12-31 | 2025-02-18 |
Income Statement Evolution
From 2020 to 2024, AstraZeneca PLC’s revenue more than doubled, reaching $54.1B in 2024, with net income growing by 120.1% over the period. Gross margin remained strong at 81.1%, while EBIT margin improved to 19.2%, indicating enhanced operational efficiency. Despite a slight decline in EPS growth, net margin showed steady improvement, reflecting consistent profitability expansion.
Is the Income Statement Favorable?
The 2024 income statement reveals solid fundamentals with $54.1B revenue and $7.04B net income, translating into a 13.0% net margin. Operating income of $10B and favorable interest expense at 3.1% support earnings quality. While EPS declined by 40.8% year-over-year, overall margins and growth metrics are positive, leading to a generally favorable income statement assessment.
Financial Ratios
Presented below is a summary table of key financial ratios for AstraZeneca PLC over recent fiscal years, providing a clear snapshot of its financial performance and position:
| Ratios | 2020 | 2021 | 2022 | 2023 | 2024 |
|---|---|---|---|---|---|
| Net Margin | 12.0% | 0.3% | 7.4% | 13.0% | 13.0% |
| ROE | 20.5% | 0.3% | 8.9% | 15.2% | 17.2% |
| ROIC | 8.5% | -0.5% | 5.0% | 9.3% | 10.3% |
| P/E | 41.0 | 1475.0 | 63.8 | 35.3 | 28.9 |
| P/B | 8.4 | 4.2 | 5.7 | 5.4 | 5.0 |
| Current Ratio | 0.96 | 1.16 | 0.86 | 0.82 | 0.93 |
| Quick Ratio | 0.76 | 0.76 | 0.68 | 0.64 | 0.74 |
| D/E | 1.30 | 0.78 | 0.79 | 0.73 | 0.74 |
| Debt-to-Assets | 30.5% | 29.1% | 30.2% | 28.3% | 28.9% |
| Interest Coverage | 4.1 | 0.83 | 2.8 | 5.2 | 5.9 |
| Asset Turnover | 0.40 | 0.36 | 0.46 | 0.45 | 0.52 |
| Fixed Asset Turnover | 3.0 | 3.7 | 4.7 | 4.4 | 4.6 |
| Dividend Yield | 2.7% | 2.3% | 2.1% | 2.1% | 2.3% |
Evolution of Financial Ratios
From 2020 to 2024, AstraZeneca’s Return on Equity (ROE) showed a general upward trend, reaching 17.25% in 2024, indicating improved profitability. The Current Ratio remained below 1.0 for most years, slightly increasing to 0.93 in 2024, reflecting persistent tight liquidity. The Debt-to-Equity Ratio fluctuated moderately, settling at 0.74 in 2024, indicating stable leverage.
Are the Financial Ratios Fovorable?
In 2024, profitability metrics such as net margin (13.01%) and ROE (17.25%) are favorable, supported by a solid return on invested capital (10.3%). Liquidity ratios, including current (0.93) and quick ratios (0.74), are unfavorable, suggesting limited short-term asset coverage. Leverage is neutral with a debt-to-equity ratio of 0.74, while debt-to-assets (28.95%) and interest coverage (6.17) are favorable. Efficiency ratios show mixed signals; asset turnover is neutral at 0.52, but fixed asset turnover is favorable at 4.64. Market valuation ratios like P/E (28.87) and P/B (4.98) are unfavorable. Overall, 57.14% of ratios are favorable, supporting a generally positive financial standing.
Shareholder Return Policy
AstraZeneca maintains a dividend payout ratio near 66%, with a dividend per share rising steadily to $1.49 in 2024 and an annual yield around 2.28%. The dividend is well covered by free cash flow, supporting sustainable payments without excessive risk. The company also engages in share buybacks, complementing its shareholder return strategy. This balanced approach of dividends and buybacks aligns with long-term value creation by distributing profits while retaining flexibility for growth investments.
Score analysis
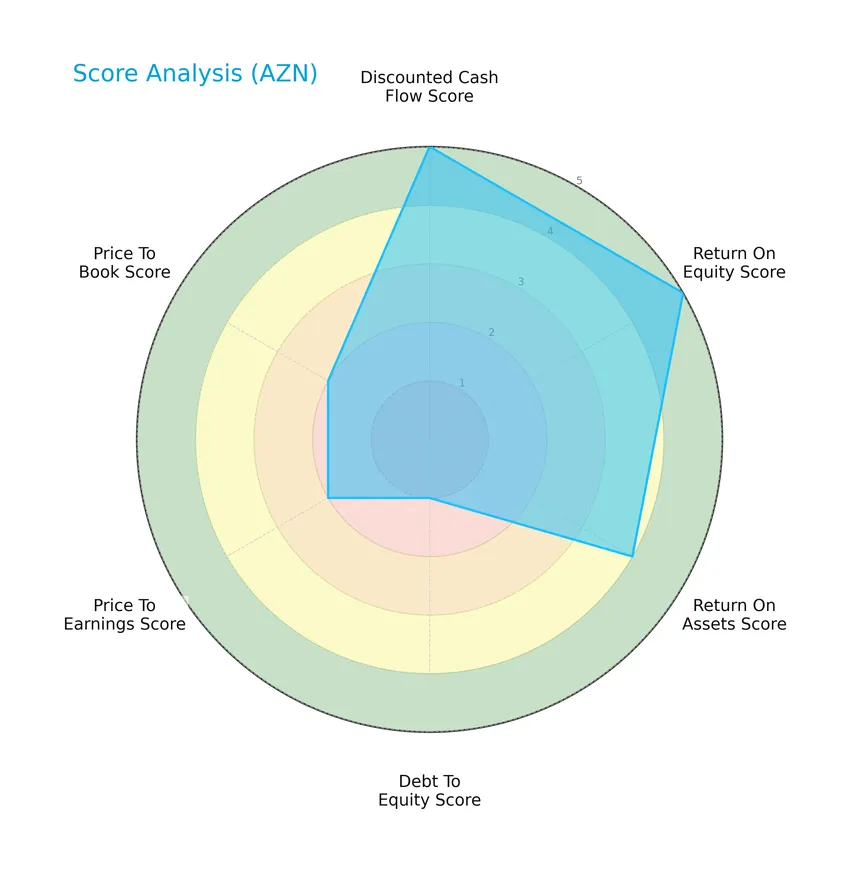
The following radar chart presents AstraZeneca PLC’s key financial scores for a comprehensive overview:

AstraZeneca exhibits very favorable scores in discounted cash flow and return on equity, with a favorable return on assets. However, the debt-to-equity score is very unfavorable, while price-to-earnings and price-to-book ratios are moderate.
Analysis of the company’s bankruptcy risk
The Altman Z-Score indicates that AstraZeneca is in the safe zone, suggesting a low risk of bankruptcy:

Is the company in good financial health?
The Piotroski diagram illustrates AstraZeneca’s financial strength based on its recent score:

With a Piotroski Score of 7, AstraZeneca demonstrates strong financial health, reflecting solid profitability, leverage, liquidity, and operational efficiency.
Competitive Landscape & Sector Positioning
This sector analysis will explore AstraZeneca PLC’s strategic positioning, revenue by segment, key products, main competitors, competitive advantages, and SWOT analysis. I will assess whether AstraZeneca holds a competitive advantage over its industry peers.
Strategic Positioning
AstraZeneca PLC maintains a diversified portfolio across oncology, cardiovascular, respiratory, and rare diseases, with oncology revenues reaching $17.1B in 2023. Its global presence spans Europe, the Americas, Asia, Africa, and Australasia, supported by collaborations leveraging AI and innovative drug discovery.
Revenue by Segment
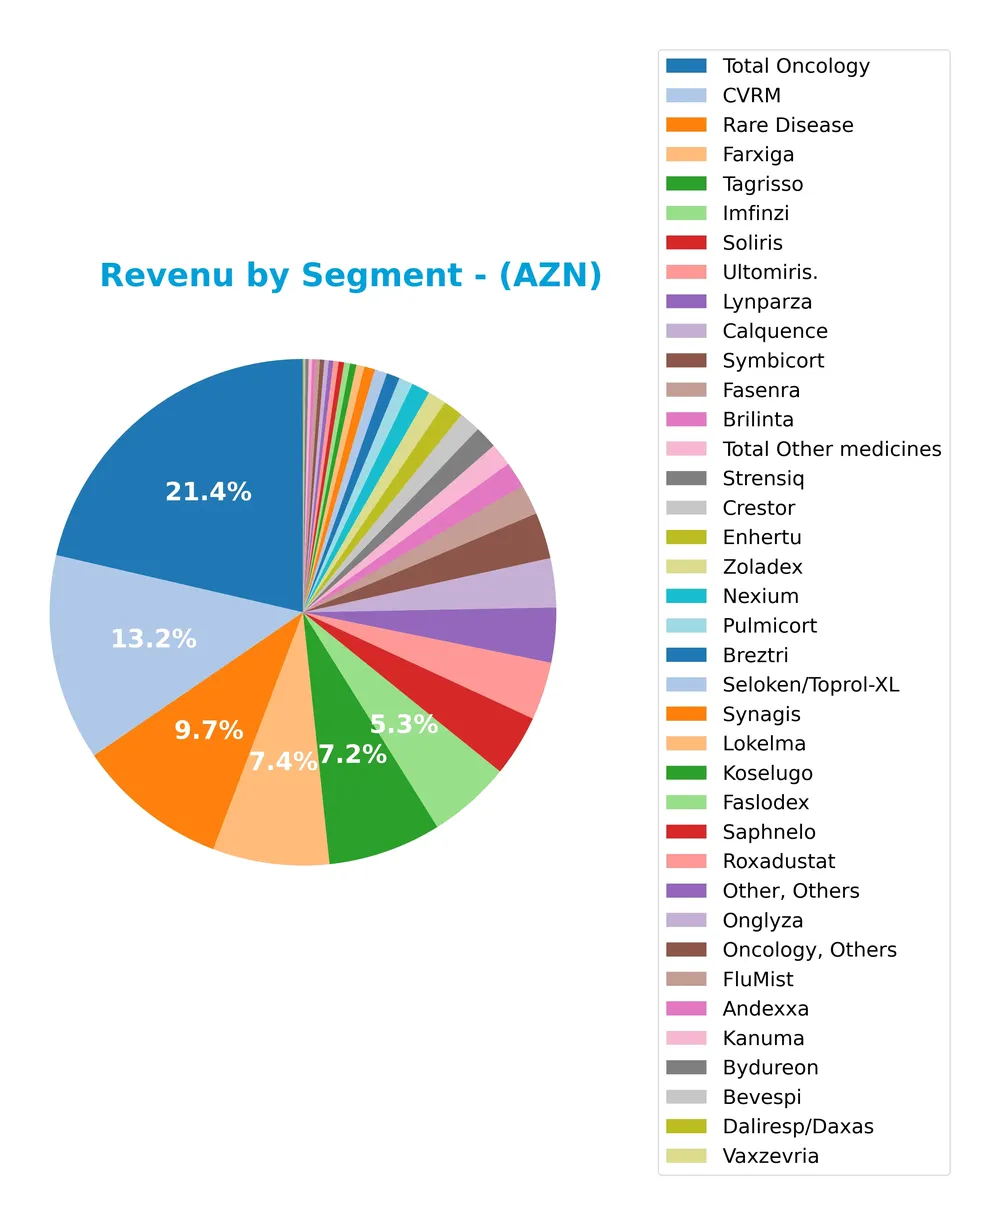
This pie chart illustrates AstraZeneca PLC’s revenue distribution by product segments for the fiscal year 2023, highlighting the company’s diverse portfolio contributions.

In 2023, AstraZeneca’s oncology segment dominates with $17.1B in revenue, led by key products like Tagrisso ($5.8B) and Lynparza ($2.8B). The CVRM (cardiovascular, renal, and metabolism) segment follows with $10.6B, driven by Farxiga ($6B) and Calquence ($2.5B). Rare Disease and Immunology also contribute significantly, with $7.8B and $4.2B respectively. The latest data show continued growth and concentration in oncology and CVRM, indicating robust demand but potential exposure to these core areas.
Key Products & Brands
The table below summarizes AstraZeneca PLC’s key products and brands along with their main therapeutic or market focus:
| Product | Description |
|---|---|
| Tagrisso | Oncology medication for non-small cell lung cancer (NSCLC). |
| Imfinzi | Immuno-oncology treatment for various cancers. |
| Lynparza | Targeted therapy for cancers including ovarian and breast cancer. |
| Calquence | Oncology drug used primarily for blood cancers. |
| Enhertu | Antibody-drug conjugate for breast cancer treatment. |
| Orpathys | Oncology-focused product (specific details not provided). |
| Truqap | Oncology therapy (details not specified). |
| Zoladex | Hormonal treatment for prostate and breast cancer. |
| Faslodex | Hormone therapy for breast cancer. |
| Farxiga | Cardiovascular and metabolic disease medication, including diabetes and heart failure. |
| Brilinta | Cardiovascular drug for preventing blood clots. |
| Lokelma | Treatment for hyperkalemia (high potassium levels). |
| Roxadustat | Treatment for anemia associated with chronic kidney disease. |
| Andexxa | Antidote for anticoagulant reversal. |
| Crestor | Cholesterol-lowering medication for cardiovascular risk. |
| Seloken | Beta-blocker used for cardiovascular conditions. |
| Onglyza | Diabetes treatment. |
| Bydureon | Extended-release diabetes therapy. |
| Fasenra | Treatment for severe asthma. |
| Breztri | Combination inhaler for chronic obstructive pulmonary disease (COPD). |
| Symbicort | Inhaler for asthma and COPD. |
| Saphnelo | Treatment for systemic lupus erythematosus (SLE). |
| Tezspire | Biologic therapy for severe asthma. |
| Pulmicort | Inhaled corticosteroid for asthma. |
| Bevespi | Inhaler for COPD treatment. |
| Daliresp | COPD medication, specifically reducing exacerbations. |
| Vaxzevria | COVID-19 vaccine. |
| Beyfortus | Respiratory syncytial virus (RSV) prevention. |
| Synagis | Monoclonal antibody for RSV prevention in infants. |
| FluMist | Nasal spray influenza vaccine. |
| Soliris | Treatment for rare diseases including paroxysmal nocturnal hemoglobinuria (PNH). |
| Ultomiris | Long-acting complement inhibitor for rare diseases. |
| Strensiq | Enzyme replacement therapy for rare metabolic disorders. |
| Koselugo | Treatment for neurofibromatosis type 1 tumors. |
| Kanuma | Enzyme replacement therapy for lysosomal acid lipase deficiency. |
AstraZeneca’s portfolio spans a broad range of therapeutic areas including oncology, cardiovascular, renal, metabolism, respiratory diseases, and rare diseases, supported by various vaccines and specialty treatments.
Main Competitors
There are 10 main competitors in the Healthcare sector for AstraZeneca PLC, with the table listing the top 10 leaders by market capitalization:
| Competitor | Market Cap. |
|---|---|
| Eli Lilly and Company | 970B |
| Johnson & Johnson | 500B |
| AbbVie Inc. | 405B |
| AstraZeneca PLC | 285B |
| Merck & Co., Inc. | 268B |
| Amgen Inc. | 176B |
| Gilead Sciences, Inc. | 151B |
| Pfizer Inc. | 143B |
| Bristol-Myers Squibb Company | 109B |
| Biogen Inc. | 26B |
AstraZeneca PLC ranks 4th among its top 10 competitors with a market cap approximately 30% of the leader, Eli Lilly and Company. The company is positioned below the average market cap of the top 10 (303B) but remains above the sector median (222B). AstraZeneca enjoys a substantial 40.61% market cap lead over the next closest competitor, Merck & Co., indicating a comfortable gap in scale.
Comparisons with competitors
Check out how we compare the company to its competitors:
Does AZN have a competitive advantage?
AstraZeneca PLC presents a competitive advantage, demonstrated by its very favorable economic moat with ROIC exceeding WACC by 5.6% and a strong upward ROIC trend of 21.3% over 2020-2024. This indicates efficient capital use and durable value creation.
Looking ahead, AstraZeneca’s future outlook includes expanding its portfolio with new drugs across cardiovascular, renal, metabolism, oncology, COVID-19, and rare diseases. Collaborations leveraging AI for drug discovery and digital pathology also offer growth opportunities in emerging markets and therapeutic areas.
SWOT Analysis
This SWOT analysis highlights AstraZeneca PLC’s key strategic factors to aid investors in understanding its current position and growth prospects.
Strengths
- Strong global presence
- Robust product portfolio in oncology and rare diseases
- Favorable financial performance with growing revenue and net income
Weaknesses
- High price-to-book and price-to-earnings ratios
- Lower liquidity ratios below 1
- Recent negative EPS growth
Opportunities
- Expansion through AI-driven drug discovery collaborations
- Growing demand for specialty medicines and rare disease treatments
- Increasing global healthcare spending
Threats
- Intense competition in biopharma sector
- Regulatory risks and patent expirations
- Macroeconomic uncertainties impacting healthcare budgets
AstraZeneca demonstrates solid strengths with a diversified portfolio and favorable profitability, but investors should monitor valuation concerns and liquidity. The company’s growth strategy should leverage innovation and market expansion while mitigating competitive and regulatory risks.
Stock Price Action Analysis
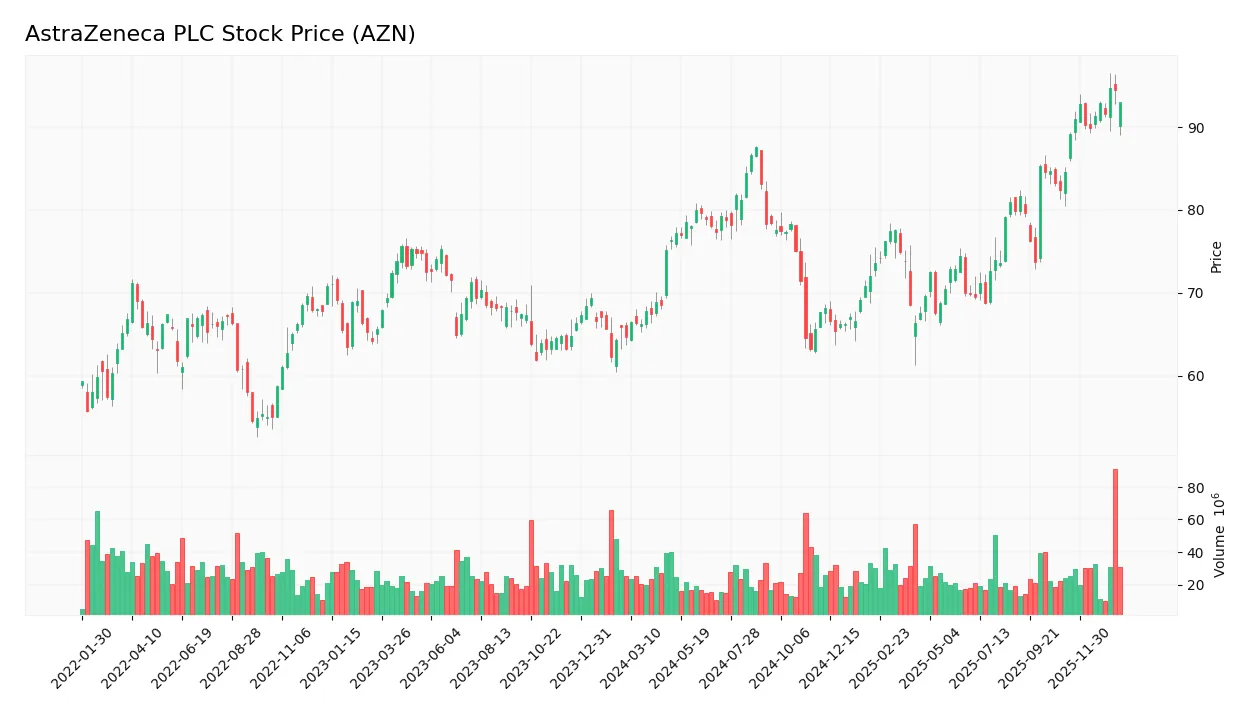
The weekly stock chart for AstraZeneca PLC (AZN) over the last 12 months shows significant price movements and volatility patterns:

Trend Analysis
Over the past 12 months, AZN’s stock price increased by 43.89%, indicating a bullish trend with acceleration. The highest price reached 94.65, while the lowest was 63.23. The standard deviation of 7.99 shows moderate volatility throughout this period. Recent weeks show a 9.9% rise with a positive slope of 0.59 and lower volatility at 2.61.
Volume Analysis
In the last three months, trading volume has been decreasing despite a slight seller dominance at 52.55%. Buyer volume is 172.9M versus seller volume of 191.5M, suggesting neutral buyer behavior. This decline in volume signals cautious investor participation and balanced market sentiment.
Target Prices
The current analyst consensus for AstraZeneca PLC (AZN) presents a moderately bullish outlook with a narrow target range.
| Target High | Target Low | Consensus |
|---|---|---|
| 108 | 103 | 105.5 |
Analysts expect AZN’s share price to trade between 103 and 108, with a consensus target near 105.5, indicating steady confidence in the stock’s near-term potential.
Don’t Let Luck Decide Your Entry Point
Optimize your entry points with our advanced ProRealTime indicators. You’ll get efficient buy signals with precise price targets for maximum performance. Start outperforming now!
Analyst & Consumer Opinions
This section examines recent analyst ratings and consumer feedback regarding AstraZeneca PLC’s performance and market perception.
Stock Grades
Here is a summary of recent reliable stock grades for AstraZeneca PLC from established financial institutions:
| Grading Company | Action | New Grade | Date |
|---|---|---|---|
| UBS | Upgrade | Buy | 2025-02-13 |
| UBS | Upgrade | Neutral | 2024-11-20 |
| Erste Group | Upgrade | Buy | 2024-09-11 |
| TD Cowen | Maintain | Buy | 2024-08-12 |
| Argus Research | Maintain | Buy | 2024-05-30 |
| BMO Capital | Maintain | Outperform | 2024-04-26 |
| Deutsche Bank | Upgrade | Hold | 2024-04-16 |
| BMO Capital | Maintain | Outperform | 2024-02-12 |
| Deutsche Bank | Downgrade | Hold | 2024-02-08 |
| Jefferies | Downgrade | Hold | 2024-01-03 |
The overall trend shows a gradual improvement in sentiment, with multiple upgrades from hold or sell ratings to buy or neutral. Consistent maintenance of buy and outperform grades by major firms indicates steady confidence in the stock’s prospects.
Consumer Opinions
Consumers have expressed a mix of appreciation and concerns regarding AstraZeneca PLC, reflecting diverse experiences with the company’s products and services.
| Positive Reviews | Negative Reviews |
|---|---|
| Effective medications with noticeable health benefits | Occasional delays in customer support response |
| Strong commitment to innovation in pharmaceuticals | High prices for some treatments |
| Transparent communication about drug side effects | Limited availability of certain medications |
Overall, AstraZeneca is praised for its innovative and effective pharmaceutical products, while customers frequently note issues with pricing and customer service responsiveness.
Risk Analysis
Below is a summary table highlighting key risks for AstraZeneca PLC, focusing on their description, likelihood, and potential impact:
| Category | Description | Probability | Impact |
|---|---|---|---|
| Market Valuation | Elevated P/E (28.87) and P/B (4.98) ratios suggest possible overvaluation. | Medium | Medium |
| Liquidity | Current ratio (0.93) and quick ratio (0.74) below 1 indicate liquidity risk. | Medium | Medium |
| Debt Management | Debt-to-equity ratio is very unfavorable, signaling high leverage. | High | High |
| Regulatory & Legal | Exposure to drug approval and regulatory changes globally. | Medium | High |
| Competitive Risks | Intense competition in pharma and biotech sectors impacting market share. | Medium | Medium |
| R&D Dependency | Heavy reliance on successful drug development and collaborations with AI firms. | Medium | High |
The most significant risks come from AstraZeneca’s high leverage and regulatory environment, which could materially affect financial stability despite strong profitability and a safe Altman Z-score of 3.47. Investors should monitor debt levels and regulatory developments closely to manage downside exposure.
Should You Buy AstraZeneca PLC?
AstraZeneca PLC appears to be a financially robust company with a durable competitive moat supported by growing ROIC and strong value creation. Despite a challenging leverage profile, its overall B+ rating suggests a favorable investment case with moderate risk considerations.
Strength & Efficiency Pillars
AstraZeneca PLC exhibits robust profitability and value creation, underscored by a net margin of 13.01% and a return on equity (ROE) of 17.25%. Its return on invested capital (ROIC) stands at 10.3%, comfortably exceeding the weighted average cost of capital (WACC) at 4.7%, confirming the company as a clear value creator. Financial health indicators further reinforce this strength, with an Altman Z-Score of 3.47 placing AstraZeneca firmly in the safe zone and a strong Piotroski score of 7, signaling solid operational and financial resilience.
Weaknesses and Drawbacks
Despite its strengths, AstraZeneca faces several challenges. Valuation metrics appear stretched, with a price-to-earnings (P/E) ratio of 28.87 and a price-to-book (P/B) ratio nearing 5, which may imply a premium that limits upside potential. Liquidity concerns are evident as the current ratio is below 1 at 0.93, and the quick ratio is 0.74, highlighting potential short-term solvency risks. Recent market dynamics show seller dominance with only 47.45% buyer volume over the last quarter, suggesting some near-term pressure despite the longer-term bullish trend.
Our Verdict about AstraZeneca PLC
AstraZeneca’s long-term fundamental profile is favorable, supported by strong profitability, value creation, and financial stability. However, the recent period shows seller dominance, which could temper enthusiasm and suggests a wait-and-see approach for investors seeking better entry points. The profile may appear attractive for those with a longer investment horizon, but caution is warranted given valuation and liquidity concerns.
Disclaimer: This content is for informational purposes only and does not constitute financial, investment, or other professional advice. Investing in financial markets involves a significant risk of loss, and past performance is not indicative of future results.
Additional Resources
- AstraZeneca to complete direct listing of ordinary shares and all US debt securities on the New York Stock Exchange – AstraZeneca (Jan 20, 2026)
- AstraZeneca PLC (AZN) Gains After Successful Saphnelo Trial – Yahoo Finance (Jan 20, 2026)
- AstraZeneca to delist from Nasdaq, join NYSE in February – Reuters (Jan 20, 2026)
- AstraZeneca PLC (NASDAQ:AZN) Emerges as a Quality Investment Candidate – Chartmill (Jan 20, 2026)
- AstraZeneca to move NYSE listing, withdraw from Nasdaq at end of January – Investing.com (Jan 20, 2026)
For more information about AstraZeneca PLC, please visit the official website: astrazeneca.com


