Home > Analyses > Technology > Astera Labs, Inc. Common Stock
Astera Labs powers the backbone of cloud and AI infrastructure with its cutting-edge semiconductor connectivity solutions. Its Intelligent Connectivity Platform drives performance across data, network, and memory systems, enabling scalable, high-speed operations in a rapidly evolving tech landscape. As a relatively young player with a strong innovation edge, Astera Labs challenges established giants. The key question: can its fundamentals support sustained growth and justify its premium market valuation amid fierce industry competition?

Table of contents
Business Model & Company Overview
Astera Labs, Inc. Common Stock, founded in 2017 and headquartered in Santa Clara, CA, commands a strong position in the semiconductor industry. The company’s Intelligent Connectivity Platform integrates data, network, and memory connectivity products into a cohesive, software-defined architecture. This ecosystem drives high-performance cloud and AI infrastructure, reflecting Astera Labs’ core mission to enhance scalability and efficiency in next-generation technology environments.
Astera Labs generates revenue by combining semiconductor hardware with sophisticated software layers, enabling seamless connectivity solutions. Its footprint spans key markets in the Americas, Europe, and Asia, serving global cloud and AI infrastructure demands. The company’s economic moat stems from its proprietary platform that uniquely aligns hardware and software, setting a high barrier for competitors and positioning it as a pivotal player in the semiconductor connectivity space.
Financial Performance & Fundamental Metrics
I analyze Astera Labs, Inc.’s income statement, key financial ratios, and dividend payout policy to assess its financial health and shareholder value.
Income Statement
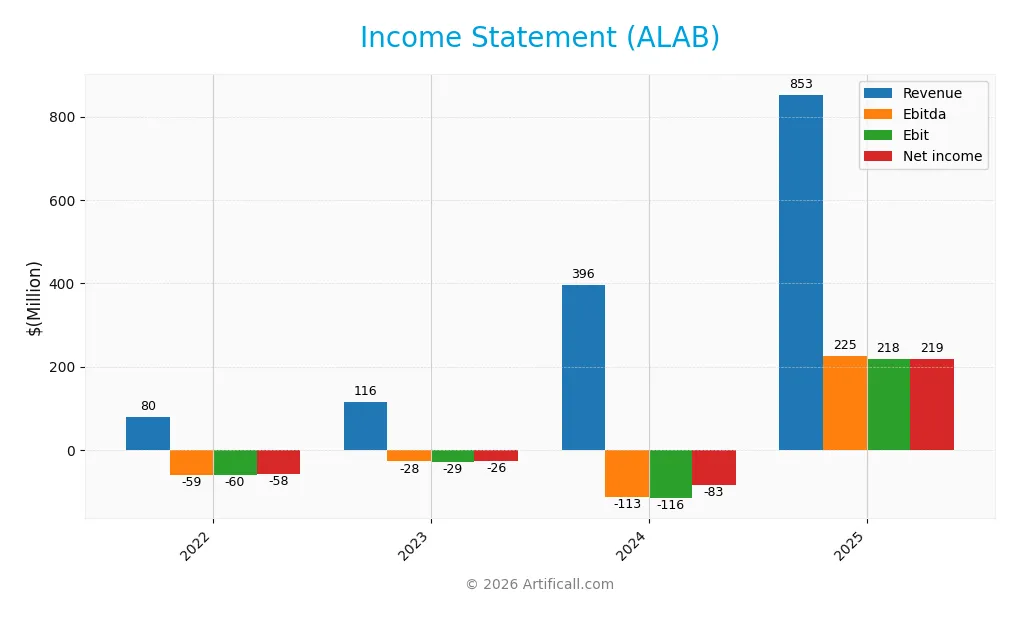
The table below summarizes Astera Labs, Inc.’s annual income statement figures for the fiscal years 2022 through 2025, providing key profitability and expense metrics.
| 2022 | 2023 | 2024 | 2025 | |
|---|---|---|---|---|
| Revenue | 79.9M | 115.8M | 396.3M | 852.5M |
| Cost of Revenue | 21.2M | 36.0M | 93.6M | 207.3M |
| Operating Expenses | 118.9M | 109.3M | 418.8M | 471.8M |
| Gross Profit | 58.7M | 79.8M | 302.7M | 645.3M |
| EBITDA | -59.4M | -27.7M | -112.9M | 225.0M |
| EBIT | -60.2M | -29.5M | -116.1M | 218.2M |
| Interest Expense | 0 | 0 | 0 | 0 |
| Net Income | -58.3M | -26.3M | -83.4M | 219.1M |
| EPS | -0.45 | -0.17 | -0.64 | 1.32 |
| Filing Date | 2022-12-31 | 2023-12-31 | 2025-02-14 | 2026-02-20 |
Income Statement Evolution
Astera Labs saw revenue surge nearly tenfold from 2022 to 2025, reaching $852M in 2025. Net income turned sharply positive with $219M in 2025 after consecutive losses. Margins improved notably; the gross margin stabilized around 76%, and net margin expanded to 25.7%, reflecting enhanced operational efficiency and scale benefits.
Is the Income Statement Favorable?
The 2025 income statement shows robust fundamentals. Operating income reached $173M, supported by strong R&D and controlled SG&A expenses relative to revenue growth. Astera Labs incurred no interest expense, boosting net margins. EPS grew 291% year-over-year, signaling solid profitability momentum. Overall, key profitability and growth metrics present a favorable income profile.
Financial Ratios
The following table presents key financial ratios for Astera Labs, Inc. Common Stock (ALAB) over the fiscal years 2022 to 2025:
| Ratios | 2022 | 2023 | 2024 | 2025 |
|---|---|---|---|---|
| Net Margin | -73% | -23% | -21% | 26% |
| ROE | 68% | -17% | -9% | 16% |
| ROIC | -35% | -18% | -12% | 12% |
| P/E | -139 | -360 | -208 | 126 |
| P/B | -95 | 60 | 18 | 20 |
| Current Ratio | 5.14 | 5.30 | 11.71 | 10.24 |
| Quick Ratio | 4.42 | 4.61 | 11.21 | 9.79 |
| D/E | 0.02 | 0.02 | 0.00 | 0.03 |
| Debt-to-Assets | 0.75% | 1.49% | 0.12% | 2.29% |
| Interest Coverage | 0 | 0 | 0 | 0 |
| Asset Turnover | 0.38 | 0.59 | 0.38 | 0.56 |
| Fixed Asset Turnover | 22.67 | 15.27 | 11.12 | 9.26 |
| Dividend Yield | 0% | 0% | 0% | 0% |
Evolution of Financial Ratios
Over the period, Astera Labs’ Return on Equity (ROE) improved markedly from negative territory in 2022-2024 to 16.07% in 2025. The Current Ratio remained high but declined from 11.7 in 2024 to 10.24 in 2025, indicating slight easing in liquidity. Debt-to-Equity stayed very low and stable near 0.03, reflecting minimal leverage and consistent capital structure.
Are the Financial Ratios Favorable?
In 2025, profitability metrics such as net margin (25.7%) and ROE (16.07%) are favorable, surpassing typical industry benchmarks. Liquidity shows mixed signals: the quick ratio is strong at 9.79, but the very high current ratio of 10.24 is flagged unfavorable, possibly indicating excess current assets. Leverage ratios remain favorable with debt-to-equity at 0.03 and interest coverage infinite. Market valuation ratios like P/E (126.3) and P/B (20.3) appear stretched, flagged unfavorable. Overall, 57% of key ratios are favorable, indicating solid financial health tempered by valuation and liquidity concerns.
Shareholder Return Policy
Astera Labs, Inc. does not pay dividends, reflecting a strategic focus on reinvestment during its growth phase. The company’s dividend payout ratio and yield remain at zero, while it does not engage in share buybacks either.
This approach aligns with long-term value creation by prioritizing operational expansion and R&D over immediate shareholder distributions. Such a policy is common in high-growth tech firms aiming to strengthen their competitive moat before returning cash to investors.
Score analysis
The following radar chart summarizes key financial scores to assess the company’s valuation and profitability metrics:
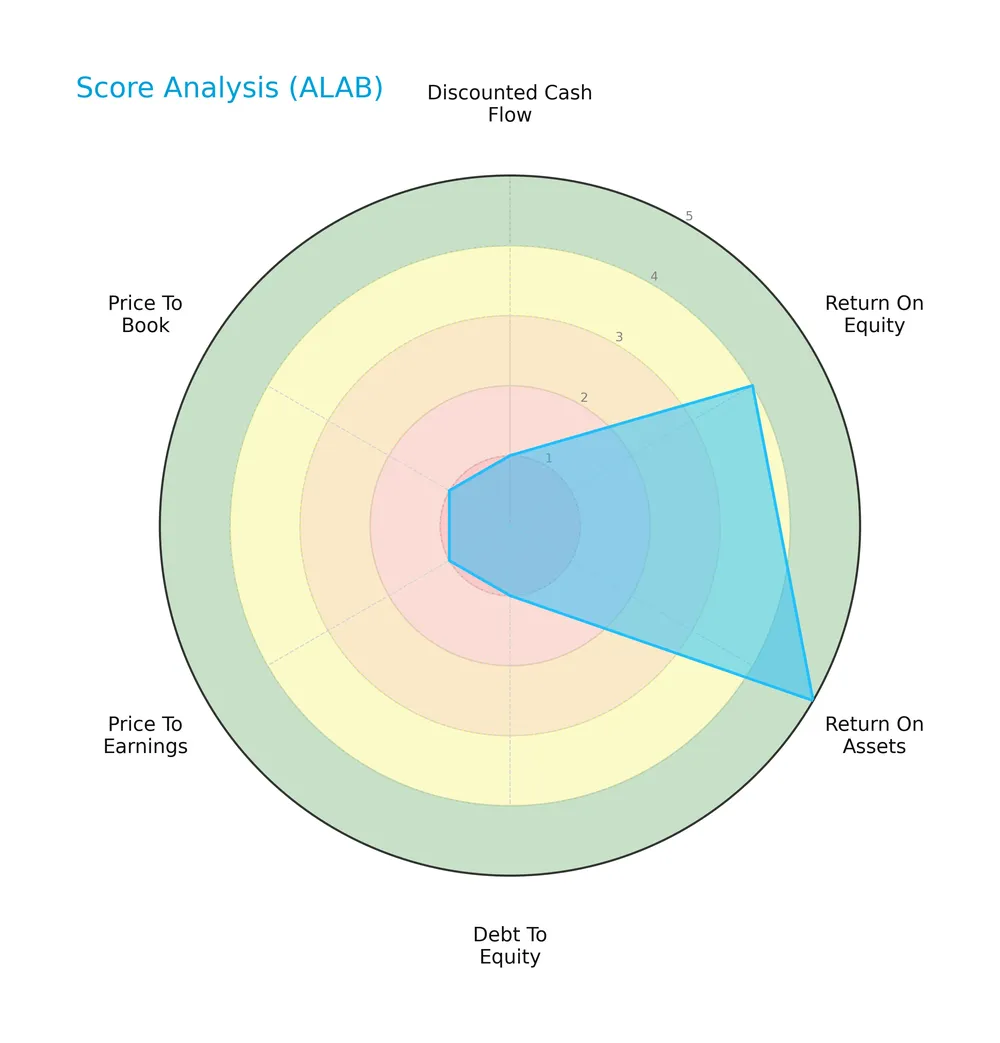
Astera Labs shows a mixed score profile. ROA scores very favorably at 5, with ROE and debt-to-equity also strong at 4. Valuation metrics (DCF, PE, PB) score very unfavorably at 1, signaling potential valuation concerns despite operational strength.
Analysis of the company’s bankruptcy risk
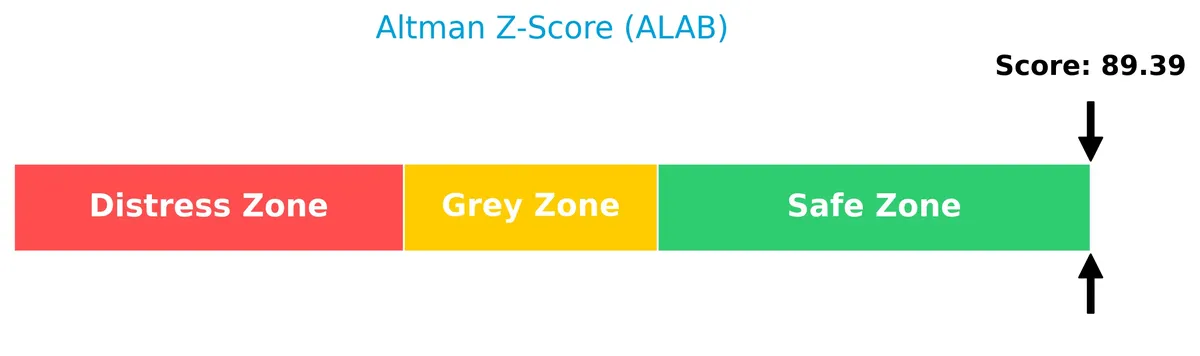
The Altman Z-Score indicates the company is firmly in the safe zone, suggesting a very low risk of bankruptcy and solid financial stability:
Is the company in good financial health?
The Piotroski F-Score diagram presents an average score, reflecting moderate financial health but room for improvement in key areas:

With a score of 6, the company demonstrates reasonable profitability and efficiency but does not yet reach the strong financial health threshold typically seen in value investments.
Competitive Landscape & Sector Positioning
This analysis explores Astera Labs’ role within the semiconductor sector, focusing on its strategic positioning and product segments. I will assess whether Astera Labs holds a competitive advantage over its main rivals in connectivity solutions for cloud and AI infrastructure.
Strategic Positioning
Astera Labs concentrates on semiconductor-based connectivity solutions for cloud and AI infrastructure. Its product portfolio centers on a unified software-defined architecture. Geographically, revenue is diversified across China (256M), Singapore (277M), Taiwan (247M), and the U.S. (27M), showing regional expansion beyond its U.S. base.
Revenue by Segment
This pie chart illustrates Astera Labs, Inc.’s revenue distribution by segment for fiscal years 2024 and 2025, highlighting shifts in business focus.
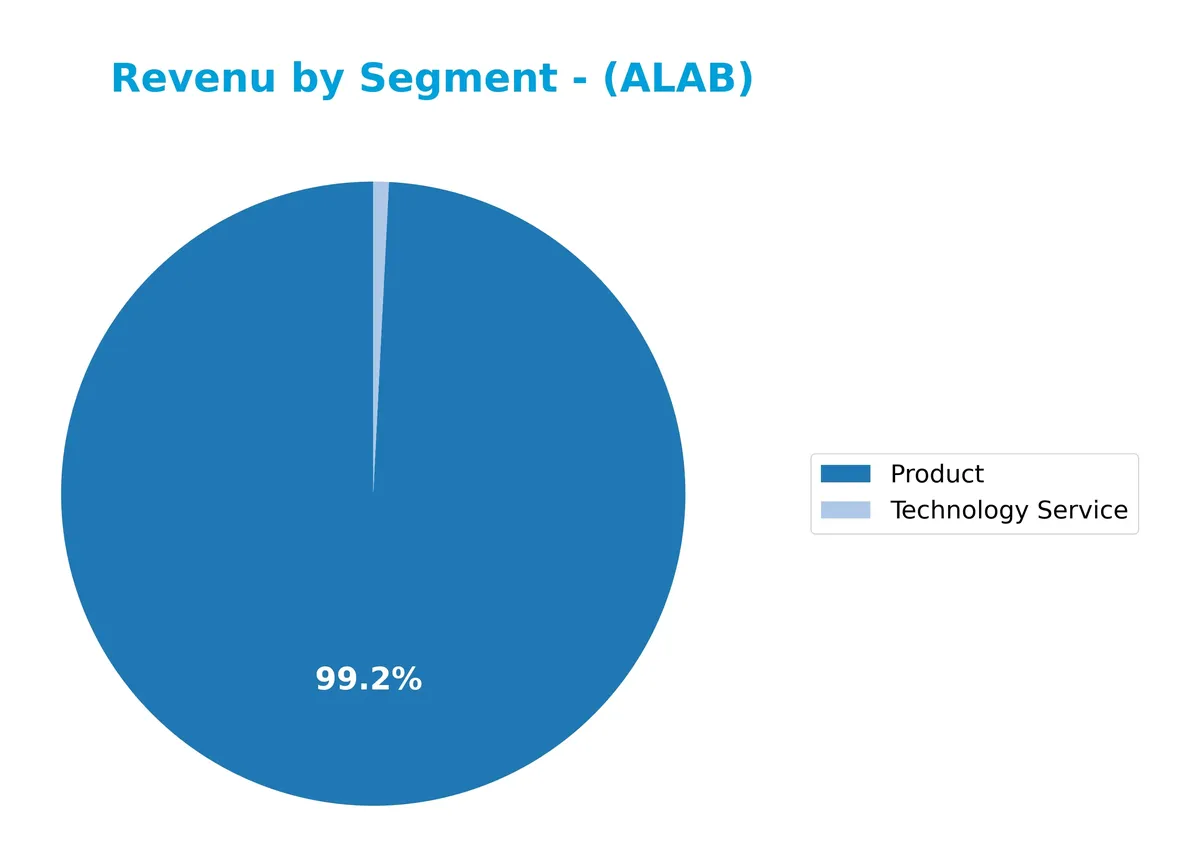
In 2024, the Product segment generated $393M, dominating revenue, with Technology Service contributing a minor $3.2M. By 2025, the company consolidated reporting into a single segment with $853M revenue, indicating significant growth or restructuring. The sharp increase suggests accelerated expansion or product line integration, though concentration risk rises without segment diversification. This shift demands close monitoring for revenue stability.
Key Products & Brands
Astera Labs offers semiconductor connectivity products designed for cloud and AI infrastructure:
| Product | Description |
|---|---|
| Intelligent Connectivity Platform | A portfolio of data, network, and memory connectivity products based on a software-defined architecture. |
| Semiconductor Connectivity Solutions | Hardware components enabling high-performance cloud and AI infrastructure deployment and operation. |
| Technology Service | Support and services complementing the product portfolio, facilitating customer implementation and scaling. |
Astera Labs focuses on semiconductor products and services that enable scalable, high-performance cloud and AI infrastructure. The Intelligent Connectivity Platform serves as the core technology, integrating connectivity hardware with software-defined controls.
Main Competitors
Astera Labs faces 38 competitors in semiconductors; here are the top 10 leaders by market capitalization:
| Competitor | Market Cap. |
|---|---|
| NVIDIA Corporation | 4.6T |
| Broadcom Inc. | 1.6T |
| Taiwan Semiconductor Manufacturing Company Limited | 1.6T |
| ASML Holding N.V. | 415B |
| Advanced Micro Devices, Inc. | 363B |
| Micron Technology, Inc. | 353B |
| Lam Research Corporation | 232B |
| Applied Materials, Inc. | 214B |
| QUALCOMM Incorporated | 185B |
| Intel Corporation | 173B |
Astera Labs ranks 20th among 38 semiconductor competitors. Its market cap is only 0.48% of NVIDIA’s, the sector leader. The company sits below both the average top 10 market cap of 975B and the sector median of 31B. It trails its nearest competitor by 52.22%, indicating a significant gap to climb.
Comparisons with competitors
Check out how we compare the company to its competitors:
Does ALAB have a competitive advantage?
Astera Labs currently does not demonstrate a clear competitive advantage, as its ROIC remains below its WACC, indicating value shedding despite strong profitability growth. However, its growing ROIC trend suggests improving capital efficiency and potential future value creation.
Looking ahead, Astera Labs benefits from expanding connectivity solutions for cloud and AI infrastructure in key markets like China, Singapore, and Taiwan. Continued innovation in its Intelligent Connectivity Platform could open new opportunities in high-performance data and memory networking sectors.
SWOT Analysis
This SWOT analysis highlights Astera Labs’ strategic position and growth potential within the semiconductor sector.
Strengths
- Strong revenue growth (+115% YoY)
- High gross margin (75.7%)
- Low debt levels (D/E 0.03)
Weaknesses
- High valuation multiples (PE 126, PB 20.3)
- Limited dividend yield (0%)
- Current ratio unusually high (10.24)
Opportunities
- Expanding AI and cloud infrastructure markets
- Geographic diversification in Asia
- Increasing demand for intelligent connectivity solutions
Threats
- Intense semiconductor industry competition
- Geopolitical risks affecting supply chains
- Rapid technology obsolescence
Astera Labs shows robust growth and profitability but trades at lofty multiples, reflecting high expectations. The company must balance aggressive expansion with valuation risks and global market uncertainties.
Stock Price Action Analysis
The weekly chart of Astera Labs, Inc. displays notable price fluctuations and trend shifts over the past 12 months:
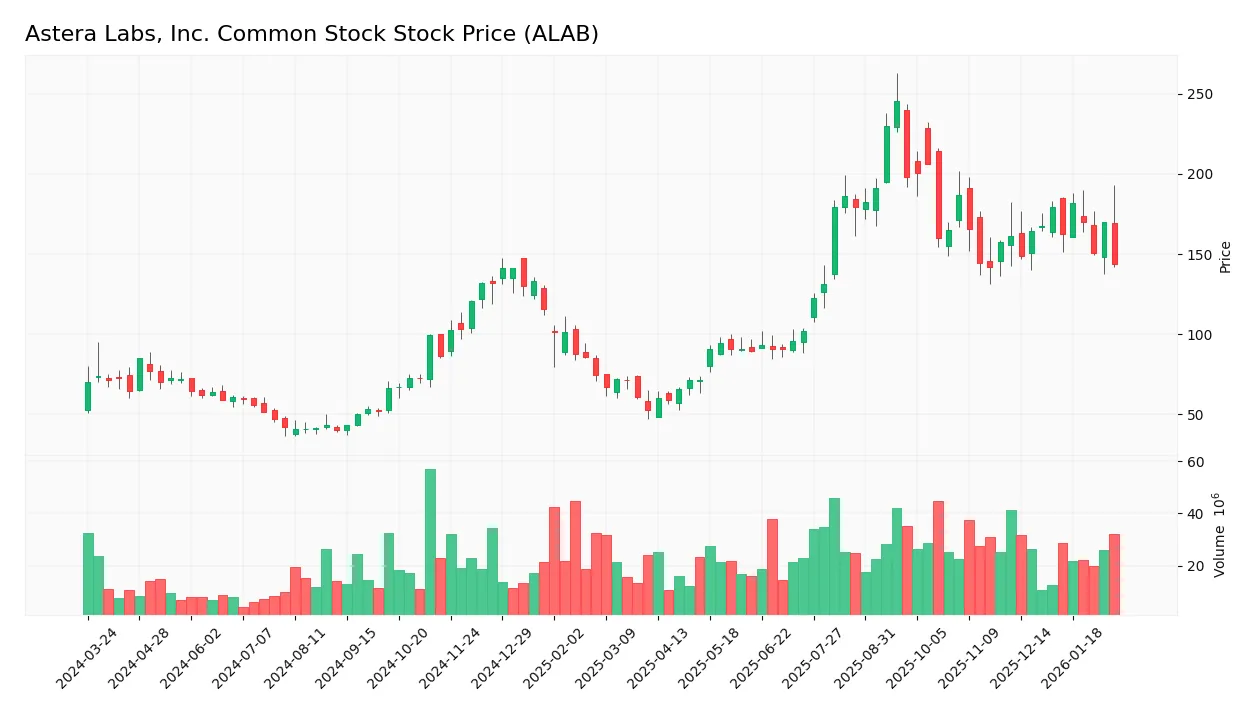
Trend Analysis
Over the past year, ALAB’s stock price rose 74.79%, indicating a strong bullish trend. Despite high volatility (std dev 50.28), the upward momentum is decelerating. The stock ranged from a low of 40.0 to a high of 245.2. Recently, a 19.57% decline occurred from December 2025 to February 2026, signaling a short-term bearish trend.
Volume Analysis
Trading volume is increasing overall, with buyers accounting for 53.68% of 2.19B shares traded, reflecting buyer-driven activity. In the recent 3 months, buyer dominance is neutral at 50.47%, with roughly equal buyer and seller volumes. This suggests balanced investor participation without strong directional conviction.
Target Prices
Analysts set a confident target consensus for Astera Labs, Inc. (ALAB).
| Target Low | Target High | Consensus |
|---|---|---|
| 165 | 225 | 202.14 |
The target range implies strong upside potential, reflecting bullish sentiment among industry experts.

Don’t Let Luck Decide Your Entry Point
Optimize your entry points with our advanced ProRealTime indicators. You’ll get efficient buy signals with precise price targets for maximum performance. Start outperforming now!
Analyst & Consumer Opinions
This section examines the latest analyst grades and consumer feedback on Astera Labs, Inc. Common Stock (ALAB).
Stock Grades
Here are the latest verified stock grades from leading financial institutions for Astera Labs, Inc. Common Stock:
| Grading Company | Action | New Grade | Date |
|---|---|---|---|
| Citigroup | Maintain | Buy | 2026-02-11 |
| Northland Capital Markets | Maintain | Outperform | 2025-12-09 |
| Northland Capital Markets | Upgrade | Outperform | 2025-11-17 |
| JP Morgan | Maintain | Overweight | 2025-11-05 |
| Roth Capital | Maintain | Buy | 2025-11-05 |
| TD Cowen | Maintain | Hold | 2025-11-05 |
| Morgan Stanley | Maintain | Overweight | 2025-11-05 |
| Stifel | Maintain | Buy | 2025-11-05 |
| Needham | Maintain | Buy | 2025-11-05 |
| Barclays | Downgrade | Equal Weight | 2025-10-20 |
The consensus trends strongly toward a Buy rating with twelve analysts favoring purchases and only three recommending holds. Most firms maintain positive stances, though Barclays’ downgrade signals some caution in valuation or outlook.
Consumer Opinions
Astera Labs, Inc. sparks mixed reactions, reflecting its innovative edge and areas demanding improvement.
| Positive Reviews | Negative Reviews |
|---|---|
| “Cutting-edge technology with reliable performance.” | “Customer support response times are slow.” |
| “Seamless integration into existing systems.” | “High price point limits accessibility.” |
| “Strong product durability in demanding environments.” | “Software updates occasionally cause glitches.” |
Overall, consumers praise Astera Labs for robust technology and seamless integration. However, recurring concerns include costly products and inconsistent customer support.
Risk Analysis
Below is a summary table highlighting key risks facing Astera Labs, Inc. Common Stock (ALAB):
| Category | Description | Probability | Impact |
|---|---|---|---|
| Valuation Risk | Extremely high P/E (126x) and P/B (20x) ratios suggest overvaluation. | High | High |
| Market Volatility | Beta of 1.51 indicates stock price is more volatile than the market. | High | Medium |
| Liquidity Risk | Current ratio at 10.24 flagged unfavorable due to potential overcapitalization. | Medium | Low |
| Growth Execution | Company is young (IPO 2024), with moderate Piotroski score (6/9) indicating average financial strength. | Medium | Medium |
| Sector Cyclicality | Semiconductor industry faces cyclical demand and supply chain disruptions. | Medium | High |
Astera Labs faces elevated valuation risk due to its sky-high P/E and P/B multiples, well above industry norms. This suggests the stock trades on growth expectations that may be overly optimistic. Its beta of 1.51 implies higher sensitivity to market swings, a caution for volatility-prone investors. Although the current ratio is unusually high, this may reflect excess cash rather than distress. The company remains young and in a cyclical, competitive semiconductor sector, exposing it to execution and macro risks. I advise close monitoring of valuation and sector dynamics before committing.
Should You Buy Astera Labs, Inc. Common Stock?
Astera Labs appears to be improving profitability with a slightly favorable moat reflecting growing ROIC, supported by a manageable leverage profile. While valuation metrics suggest caution, the overall B rating indicates a very favorable financial standing with moderate risk.
Strength & Efficiency Pillars
Astera Labs, Inc. Common Stock (ALAB) demonstrates solid operational efficiency with a net margin of 25.7% and a return on equity of 16.07%. Its return on invested capital (ROIC) stands at 12.4%, comfortably exceeding the weighted average cost of capital (WACC) at 10.76%, marking it as a value creator. The company’s strong gross margin of 75.69% and favorable EBIT margin of 25.59% further underpin robust profitability and operational discipline.
Weaknesses and Drawbacks
Despite operational strengths, ALAB faces valuation headwinds with a steep price-to-earnings ratio of 126.33 and a price-to-book ratio of 20.3, signaling a high premium that may limit upside. The current ratio at 10.24, while seemingly strong, could indicate inefficient asset usage or excess liquidity not generating returns. Dividend yield at 0% may deter income-focused investors. These factors introduce risk amid recent decelerating stock price trends and elevated volatility.
Our Final Verdict about Astera Labs, Inc. Common Stock
Astera Labs exhibits a fundamentally sound profile with strong profitability and value creation. However, its stretched valuation and recent market deceleration suggest caution. Despite long-term strength, the recent neutral buyer dominance and price pullback might warrant a wait-and-see approach for a better entry point. The stock may appear suitable for investors with a higher risk tolerance and a focus on growth potential.
Disclaimer: This content is for informational purposes only and does not constitute financial, investment, or other professional advice. Investing in financial markets involves a significant risk of loss, and past performance is not indicative of future results.
Additional Resources
- ALAB Stock Price and Chart — NASDAQ:ALAB – TradingView (Jan 30, 2026)
- Exceptional Results and Investor Enthusiasm Lifted Astera Labs (ALAB) – Yahoo Finance (Nov 03, 2025)
- New York State Common Retirement Fund Sells 66,964 Shares of Astera Labs, Inc. $ALAB – MarketBeat (Feb 02, 2026)
- Astera Labs announces CFO retirement and appoints Desmond Lynch as successor – Investing.com (Feb 10, 2026)
- Astera Labs ALAB Q4 2025 Earnings Call Transcript – The Globe and Mail (Feb 10, 2026)
For more information about Astera Labs, Inc. Common Stock, please visit the official website: asteralabs.com