Home > Analyses > Financial Services > Assurant, Inc.
Assurant, Inc. safeguards the devices and homes that power everyday life across the globe. As a specialty insurer, it leads with innovative protection solutions for mobile devices, electronics, and housing. Its dual-segment model uniquely combines Global Lifestyle and Global Housing products, carving a niche in a competitive industry. I’m eager to explore whether Assurant’s strong market presence and diversified portfolio still justify its current valuation and growth prospects.

Table of contents
Business Model & Company Overview
Assurant, Inc., founded in 1892 and headquartered in New York, NY, commands a leading position in the specialty insurance sector. The company delivers a cohesive ecosystem of lifestyle and housing solutions through its Global Lifestyle and Global Housing segments. Its offerings range from mobile device protection and vehicle coverage to lender-placed homeowners and renters insurance, creating an integrated service network that supports and protects consumer assets worldwide.
The company’s revenue engine balances recurring income from insurance premiums with value-added services in mobile and housing markets, spanning North America, Latin America, Europe, and Asia Pacific. This global footprint enhances risk diversification and growth potential. Assurant’s competitive advantage lies in its specialized insurance products and strong market presence, securing a durable economic moat that shapes the future of specialty insurance.
Financial Performance & Fundamental Metrics
I analyze Assurant, Inc.’s income statement, key financial ratios, and dividend payout policy to assess its profitability, efficiency, and shareholder return discipline.
Income Statement
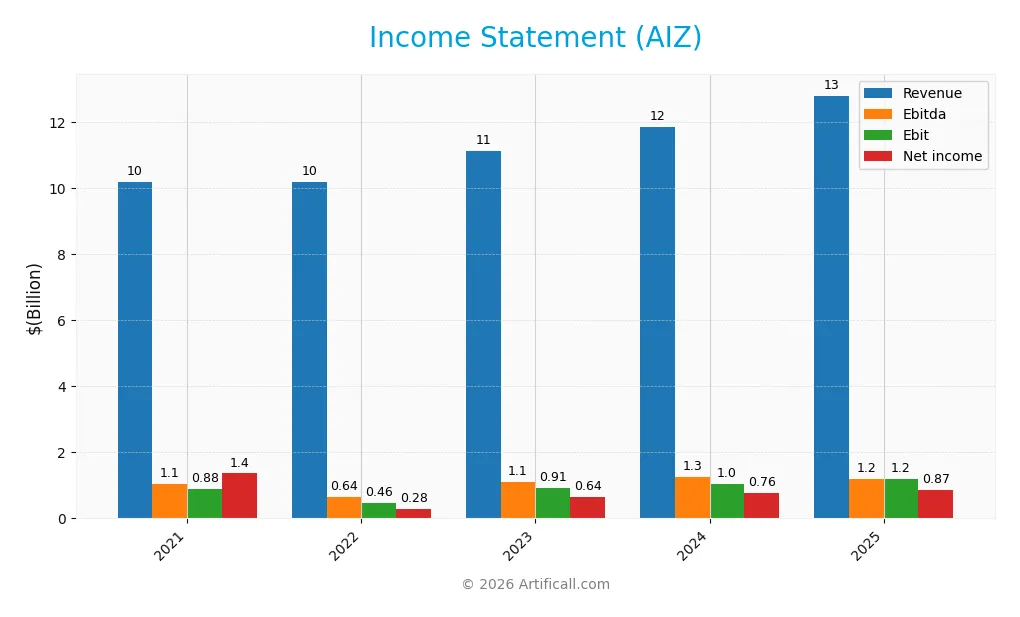
The table below summarizes Assurant, Inc.’s key income statement figures for the fiscal years 2021 through 2025, reported in USD.
| 2021 | 2022 | 2023 | 2024 | 2025 | |
|---|---|---|---|---|---|
| Revenue | 10.19B | 10.19B | 11.13B | 11.88B | 12.81B |
| Cost of Revenue | 6.04B | 2.36B | 2.52B | 2.77B | 2.93B |
| Operating Expenses | 3.38B | 7.48B | 7.80B | 8.18B | 8.80B |
| Gross Profit | 4.15B | 7.83B | 8.61B | 9.11B | 9.89B |
| EBITDA | 1.05B | 640M | 1.11B | 1.26B | 1.20B |
| EBIT | 883M | 458M | 915M | 1.03B | 1.20B |
| Interest Expense | 112M | 108M | 108M | 107M | 110M |
| Net Income | 1.36B | 277M | 643M | 760M | 873M |
| EPS | 10.37 | 5.09 | 12.02 | 14.55 | 17.29 |
| Filing Date | 2022-02-22 | 2023-02-17 | 2024-02-15 | 2025-02-20 | 2026-02-19 |
Income Statement Evolution
From 2021 to 2025, Assurant, Inc. grew revenue by 25.8%, reflecting steady market expansion. Gross margin remained robust at 77.15%, signaling strong cost control. Net income declined overall by 35.9%, but improved in the last year, with net margin stabilizing near 6.8%. EBIT margin held steady around 9.3%, indicating consistent operating efficiency.
Is the Income Statement Favorable?
In 2025, Assurant reported $12.8B revenue, up 7.9% year-over-year, with gross profit increasing 8.5%. Operating expenses grew in line with revenue, preserving margin quality. EBIT jumped 15.7%, while net income rose 14.8% from 2024, driven by a favorable tax rate and controlled interest expense at 0.86% of revenue. Overall, the fundamentals appear favorable, supported by strong margin maintenance and solid earnings growth.
Financial Ratios
The following table summarizes key financial ratios for Assurant, Inc. (AIZ) over recent fiscal years:
| Ratios | 2022 | 2023 | 2024 | 2025 |
|---|---|---|---|---|
| Net Margin | 2.7% | 5.8% | 6.4% | 6.8% |
| ROE | 6.5% | 13.4% | 14.9% | 14.9% |
| ROIC | 123%* | 0 | 0 | 6.0% |
| P/E | 24.6 | 14.0 | 14.6 | 13.9 |
| P/B | 1.6 | 1.9 | 2.2 | 2.1 |
| Current Ratio | 0 | 0 | 0 | 0 |
| Quick Ratio | 0 | 0 | 0 | 0 |
| D/E | 0.50 | 0.43 | 0.41 | 0.38 |
| Debt-to-Assets | 6.4% | 6.2% | 6.0% | 6.1% |
| Interest Coverage | 3.2 | 7.5 | 8.7 | 9.9 |
| Asset Turnover | 0.31 | 0.33 | 0.34 | 0.35 |
| Fixed Asset Turnover | 15.8 | 16.2 | 15.5 | 0 |
| Dividend Yield | 2.2% | 1.7% | 1.4% | 1.4% |
*Note: The 2022 ROIC value appears anomalously high relative to other years and may reflect a data inconsistency.
Evolution of Financial Ratios
From 2021 to 2025, Assurant, Inc.’s Return on Equity (ROE) showed moderate improvement, stabilizing near 14.86% in 2025. The Current Ratio remained at zero, indicating consistent liquidity challenges. Debt-to-Equity Ratio decreased from 0.50 in 2022 to 0.38 in 2025, reflecting reduced leverage. Profitability margins improved gradually, with net margins rising to 6.81% in 2025.
Are the Financial Ratios Favorable?
In 2025, Assurant’s profitability is neutral, with ROE and net margin slightly above average but not strong. Liquidity ratios are unfavorable due to zero current and quick ratios, raising red flags. Leverage ratios like Debt-to-Equity (0.38) and interest coverage (10.91) are favorable, showing manageable debt levels. Asset turnover is weak at 0.35, impacting efficiency. Overall, the ratios present a slightly favorable profile with clear areas of concern.
Shareholder Return Policy
Assurant, Inc. maintains a consistent dividend policy with a payout ratio near 19% in 2025, supported by stable free cash flow. The dividend per share has risen steadily, yielding around 1.39%, while coverage by operating cash flow remains robust.
The company also engages in share buybacks, complementing dividend distributions without overextending financial resources. This balanced approach aligns with sustainable long-term shareholder value, avoiding risks of excessive payouts or leverage expansion.
Score analysis
The following radar chart visualizes key financial scores assessing valuation, profitability, and leverage for Assurant, Inc.:
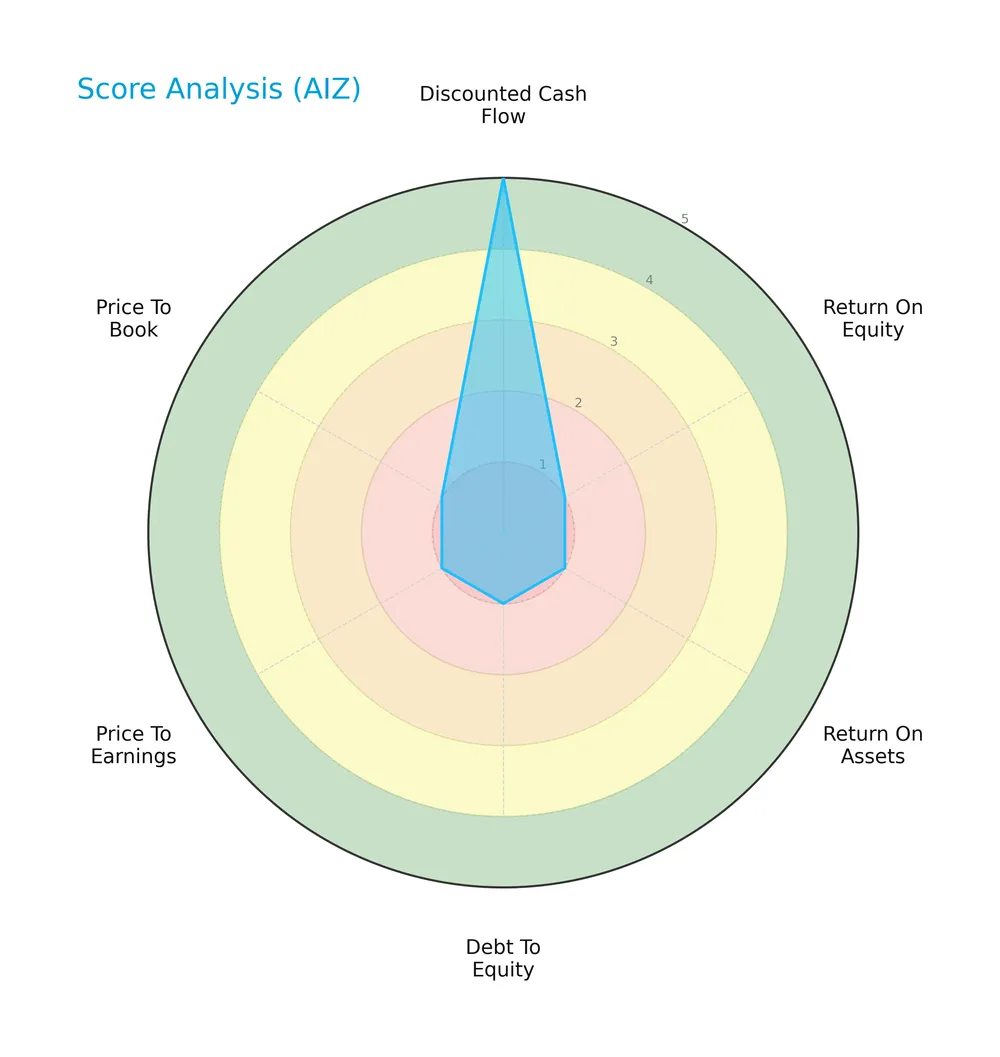
Assurant scores very favorably in discounted cash flow (5) and favorably on both return on equity (4) and return on assets (4). Its debt-to-equity ratio shows moderate leverage (3). Valuation metrics are weaker, with an unfavorable price-to-earnings score (2) and a very unfavorable price-to-book score (1).
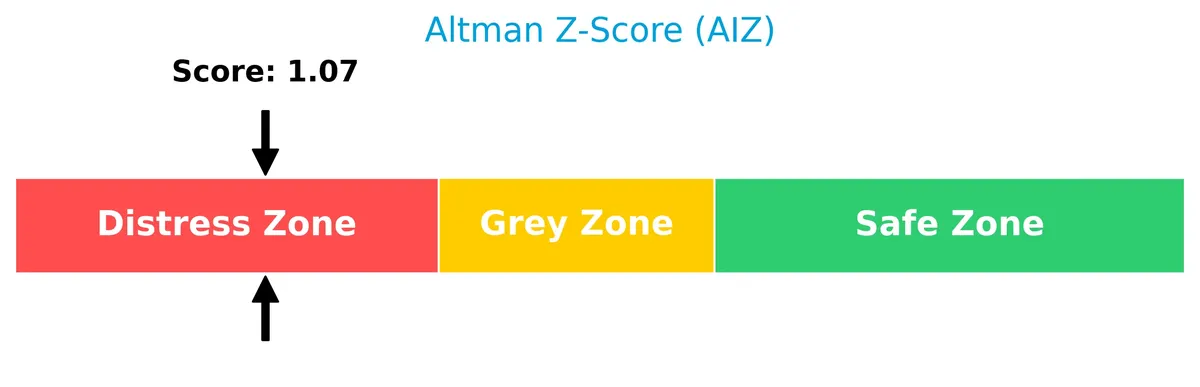
Analysis of the company’s bankruptcy risk
The Altman Z-Score places Assurant in the distress zone, signaling a high risk of financial distress and potential bankruptcy:
Is the company in good financial health?
The Piotroski Score diagram illustrates Assurant’s financial strength based on profitability, leverage, and efficiency criteria:

With a strong Piotroski Score of 7, Assurant demonstrates solid financial health and operational efficiency, despite its bankruptcy risk indicated by other measures.
Competitive Landscape & Sector Positioning
This sector analysis examines Assurant, Inc.’s strategic positioning, revenue segments, key products, and main competitors. I will assess whether Assurant holds a competitive advantage over its peers in the specialty insurance industry.
Strategic Positioning
Assurant, Inc. concentrates its product portfolio in two main segments: Global Lifestyle, generating $9.94B in 2025, and Global Housing with $2.91B. Geographically, the company heavily relies on the U.S. market, which contributed $10.5B of total revenue in 2025.
Revenue by Segment
This pie chart displays Assurant, Inc.’s revenue distribution by segment for fiscal year 2025, highlighting the relative size of Global Housing and Global Lifestyle revenues.
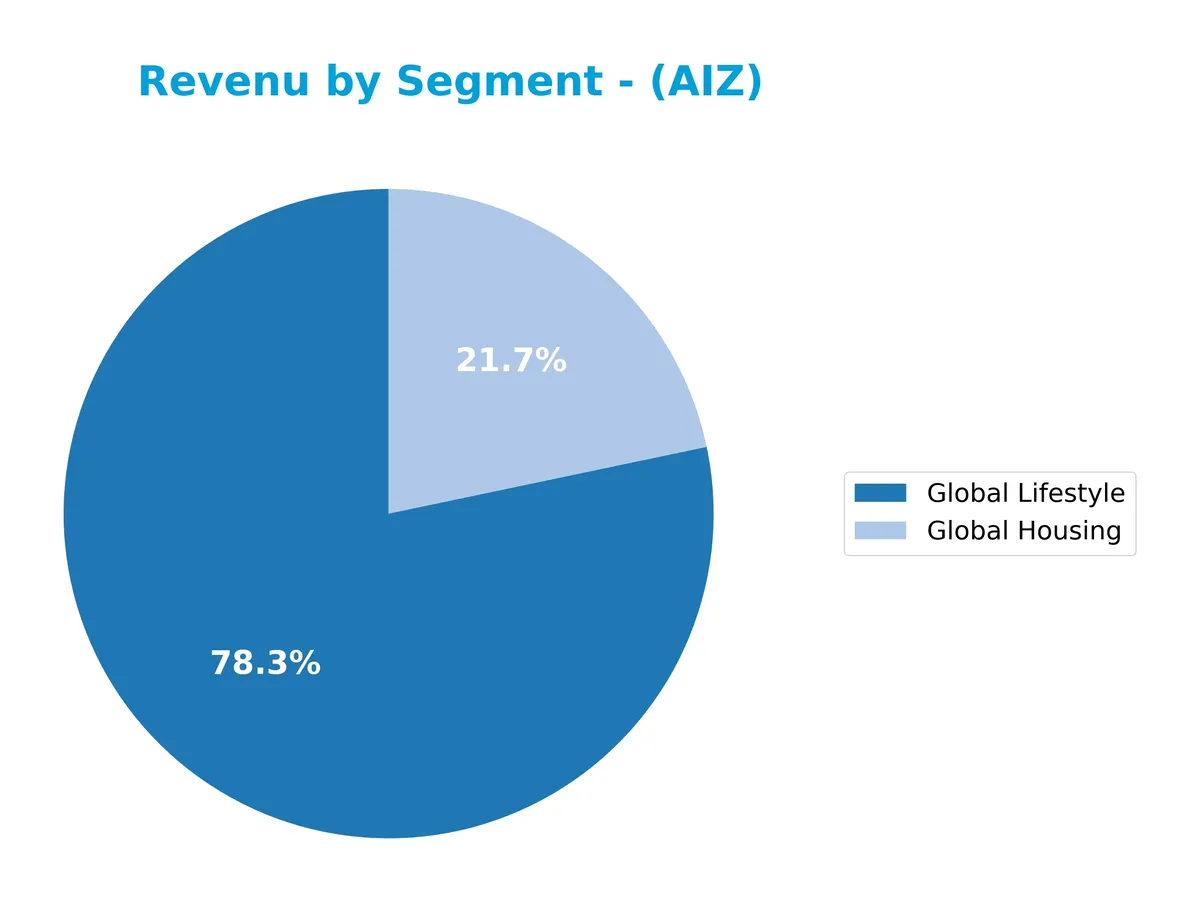
In 2025, Global Lifestyle dominates with $9.94B, nearly triple Global Housing’s $2.91B. The Global Lifestyle segment shows consistent growth since 2021, driving Assurant’s overall revenue momentum. Global Housing also expanded steadily, signaling diversification. This trend reflects a strategic focus on lifestyle products, though the heavy concentration in one segment suggests potential exposure if market dynamics shift.
Key Products & Brands
The following table outlines Assurant, Inc.’s primary products and brands across its core business segments:
| Product | Description |
|---|---|
| Global Lifestyle | Mobile device solutions, extended service products for electronics and appliances, vehicle protection, credit protection, and insurance products. |
| Global Housing | Lender-placed homeowners insurance, manufactured housing, flood insurance, renters insurance, and specialty voluntary homeowners insurance products. |
Assurant operates two main segments: Global Lifestyle, focusing on device and vehicle protection, and Global Housing, offering various insurance solutions for homeowners and renters. These segments generate the majority of the company’s revenue.
Main Competitors
There are 71 competitors in the Financial Services sector, with this table listing the top 10 leaders by market capitalization:
| Competitor | Market Cap. |
|---|---|
| Berkshire Hathaway Inc. | 1.07T |
| JPMorgan Chase & Co. | 886B |
| Visa Inc. | 672B |
| Mastercard Incorporated | 506B |
| Bank of America Corporation | 409B |
| Wells Fargo & Company | 310B |
| Morgan Stanley | 289B |
| The Goldman Sachs Group, Inc. | 287B |
| American Express Company | 260B |
| Citigroup Inc. | 221B |
Assurant, Inc. ranks 68th among 71 competitors, with a market cap just 1.05% of Berkshire Hathaway’s. The company falls below both the average market cap of the top 10 leaders (491B) and the sector median (55B). It holds a 6.75% market cap gap above its nearest competitor, indicating a modest scale difference.
Comparisons with competitors
Check out how we compare the company to its competitors:
Aucun article trouvé pour ces critères.
Does Assurant have a competitive advantage?
Assurant currently does not present a competitive advantage, as its return on invested capital (ROIC) is slightly below its weighted average cost of capital (WACC). This indicates the company is shedding value despite stable profitability, reflecting an unfavorable moat status.
Looking ahead, Assurant’s diverse segments in Global Lifestyle and Global Housing offer growth potential through expanding mobile device solutions and housing insurance products. Continued geographic revenue growth in the U.S. and evolving consumer protection trends may create new market opportunities.
SWOT Analysis
This SWOT analysis highlights Assurant, Inc.’s core strengths and weaknesses, alongside external opportunities and threats shaping its strategic outlook.
Strengths
- strong gross margin at 77%
- favorable net margin and EPS growth
- low debt-to-assets ratio at 6%
Weaknesses
- negative ROIC vs. WACC indicating value destruction
- unfavorable liquidity ratios (current and quick ratio at 0)
- low asset turnover at 0.35
Opportunities
- expanding US market with revenue growth near 8%
- growth in mobile and housing insurance products
- leverage digital transformation in specialty insurance
Threats
- regulatory risks in insurance sector
- intense competition in specialty insurance
- economic downturns affecting consumer spending
Assurant’s solid profitability and controlled leverage support resilience. However, value destruction and weak liquidity pose risks. The firm must focus on operational efficiency and capitalize on growth in US markets to strengthen its moat.
Stock Price Action Analysis
The weekly stock chart for Assurant, Inc. (AIZ) illustrates price movements and volatility patterns over the past year:
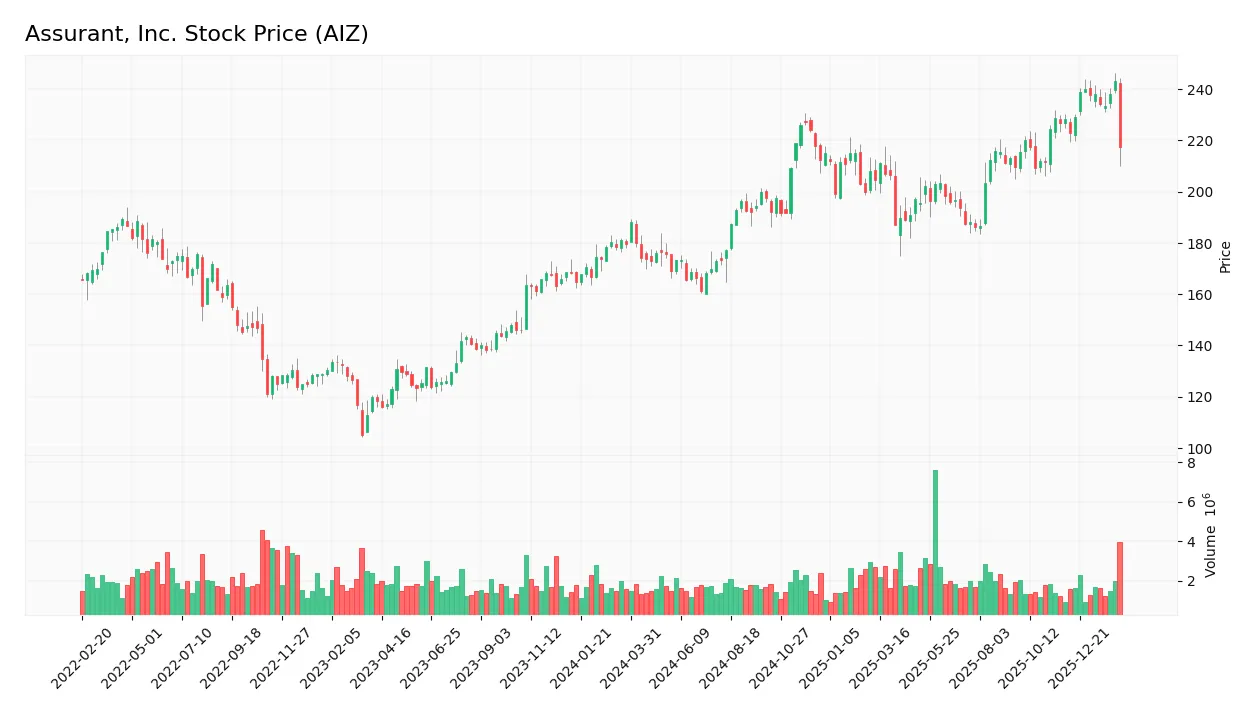
Trend Analysis
Over the past 12 months, AIZ’s stock price increased by 19.16%, indicating a bullish trend. The price ranged between 161.28 and 243.31, with decelerating momentum. The 20.09 standard deviation reflects relatively high volatility during this period.
Volume Analysis
Trading volume totaled 226M shares, with buyer volume at 119M (52.7%). Volume has been increasing, driven slightly more by buyers, who accounted for 55.3% over the recent three months. This suggests cautious but growing investor interest.
Target Prices
Analysts present a confident target consensus for Assurant, Inc., reflecting modest upside potential.
| Target Low | Target High | Consensus |
|---|---|---|
| 246 | 264 | 253.6 |
The target range suggests steady growth expectations. Overall, analysts anticipate Assurant’s shares to appreciate modestly within this corridor.

Don’t Let Luck Decide Your Entry Point
Optimize your entry points with our advanced ProRealTime indicators. You’ll get efficient buy signals with precise price targets for maximum performance. Start outperforming now!
Analyst & Consumer Opinions
This section reviews the latest analyst grades and consumer feedback regarding Assurant, Inc. (AIZ) performance and reputation.
Stock Grades
Here are the latest verified analyst grades for Assurant, Inc. from established financial firms:
| Grading Company | Action | New Grade | Date |
|---|---|---|---|
| Truist Securities | Maintain | Buy | 2026-02-12 |
| BMO Capital | Maintain | Outperform | 2026-02-12 |
| Piper Sandler | Maintain | Overweight | 2025-12-19 |
| Keefe, Bruyette & Woods | Maintain | Outperform | 2025-11-20 |
| Morgan Stanley | Maintain | Equal Weight | 2025-11-17 |
| UBS | Maintain | Buy | 2025-11-10 |
| Piper Sandler | Maintain | Overweight | 2025-10-10 |
| UBS | Maintain | Buy | 2025-10-08 |
| Morgan Stanley | Maintain | Equal Weight | 2025-10-07 |
| Morgan Stanley | Maintain | Equal Weight | 2025-08-18 |
The consensus reflects a predominantly positive stance, with multiple firms maintaining Buy or Outperform ratings. Morgan Stanley consistently assigns an Equal Weight, indicating a more cautious outlook compared to peers.
Consumer Opinions
Assurant, Inc. garners a mixed yet insightful range of consumer sentiments reflecting its service quality and operational challenges.
| Positive Reviews | Negative Reviews |
|---|---|
| Efficient claims processing speeds. | Customer service wait times often exceed expectations. |
| Comprehensive coverage options tailored to needs. | Some policies have complex terms that confuse customers. |
| Responsive and helpful support staff. | Premium costs feel high compared to competitors. |
Overall, consumers praise Assurant for its fast claims handling and tailored coverage. However, recurring concerns about customer service delays and pricing complexity suggest areas needing strategic improvement.
Risk Analysis
Below is a summary table highlighting key risks facing Assurant, Inc. and their likelihood and potential impact on the company:
| Category | Description | Probability | Impact |
|---|---|---|---|
| Financial Health | Altman Z-Score of 1.26 signals financial distress, raising bankruptcy risk concerns. | High | High |
| Liquidity | Current and quick ratios at 0 indicate poor short-term liquidity and potential cash flow issues. | High | Medium |
| Valuation | Unfavorable P/E and very unfavorable P/B ratios suggest the stock may be overvalued. | Medium | Medium |
| Operational Efficiency | Low asset turnover (0.35) and zero fixed asset turnover indicate weak asset utilization. | Medium | Medium |
| Leverage & Coverage | Favorable debt-to-equity (0.38) and strong interest coverage (10.9x) reduce financial risk. | Low | Low |
The highest risks center on liquidity and financial distress, as the Altman Z-Score places Assurant in the distress zone. This is unusual for a specialty insurance firm and requires close monitoring. Poor liquidity ratios may strain operations if capital markets tighten. Despite these risks, strong debt management and reasonable profitability provide some cushion. Investors should weigh these factors carefully against sector benchmarks before committing.
Should You Buy Assurant, Inc.?
Assurant, Inc. appears to be a company with improving profitability but an unfavorable moat, as it currently destroys value relative to its cost of capital. Despite a manageable leverage profile, its distress-zone Altman Z-score tempers the overall very favorable B+ rating.
Strength & Efficiency Pillars
Assurant, Inc. shows solid operational margins with a gross margin of 77.15% and a net margin near 6.81%. Return on equity stands at a moderate 14.86%, while ROIC at 6.0% slightly trails the WACC of 6.01%, signaling a near break-even value creation status. Interest expense remains low at 0.86%, supporting efficient capital costs. The firm maintains favorable debt metrics, with a debt-to-equity ratio at 0.38 and a strong interest coverage of 10.91x, underscoring prudent leverage management.
Weaknesses and Drawbacks
The company currently resides in the Altman Z-Score “Distress Zone” with a concerning value of 1.26, indicating heightened bankruptcy risk. This financial distress overshadows operational strengths and signals potential solvency issues. Additionally, liquidity ratios are critically weak, with current and quick ratios both at zero, exposing short-term funding vulnerabilities. Asset turnover is unfavorable at 0.35, suggesting inefficiencies in asset utilization. Valuation metrics remain mixed, with a favorable P/E of 13.93 but a neutral P/B at 2.07, indicating moderate market valuation.
Our Final Verdict about Assurant, Inc.
Despite some operational efficiency and a strong Piotroski score of 7, Assurant’s solvency risk, highlighted by the Altman Z-Score at 1.26, makes its investment profile highly speculative. The distress zone classification warns of potential bankruptcy, outweighing profitability and market indicators. Investors seeking capital preservation may find this profile too risky, warranting cautious monitoring before considering exposure.
Disclaimer: This content is for informational purposes only and does not constitute financial, investment, or other professional advice. Investing in financial markets involves a significant risk of loss, and past performance is not indicative of future results.
Additional Resources
- Assurant, Inc. $AIZ Shares Sold by Vanguard Group Inc. – MarketBeat (Feb 21, 2026)
- Assurant Incorporated (AIZ) Sparks Confidence Following Topline Outperformance – Yahoo Finance (Feb 19, 2026)
- Decoding Assurant Inc (AIZ): A Strategic SWOT Insight – GuruFocus (Feb 20, 2026)
- Assurant Earns Feefo’s Platinum Trusted Service Award for 2026 in New Zealand – Business Wire (Feb 18, 2026)
- 3 Reasons AIZ is Risky and 1 Stock to Buy Instead – Finviz (Feb 16, 2026)
For more information about Assurant, Inc., please visit the official website: assurant.com