Home > Analyses > Technology > Asana, Inc.
Asana, Inc. transforms how teams coordinate and execute work, turning chaos into clarity. Its platform powers millions of users worldwide, streamlining everything from daily tasks to complex, cross-department projects. Renowned for innovation and user-friendly design, Asana commands respect in the competitive software application sector. As we dive into its financial health, I ask: does Asana’s current valuation reflect sustainable growth, or are hidden risks creeping into its trajectory?

Table of contents
Business Model & Company Overview
Asana, Inc. is a San Francisco-based leader in work management software, founded in 2008. It delivers a unified platform that empowers individuals, teams, and executives to coordinate daily tasks and complex projects seamlessly. Asana’s ecosystem supports diverse sectors such as technology, retail, education, and healthcare, enabling strategic initiatives and goal alignment across organizations worldwide.
The company’s revenue engine balances subscription-based software services with scalable platform capabilities, driving recurring income from a global customer base spanning the Americas, Europe, and Asia. This model fuels steady growth in a competitive landscape. I see Asana’s robust competitive advantage in its ability to integrate task management with strategic workflows, securing its role as a critical tool shaping the future of collaborative work.
Financial Performance & Fundamental Metrics
I analyze Asana, Inc.’s income statement, key financial ratios, and dividend payout policy to assess its profitability, efficiency, and shareholder returns.
Income Statement
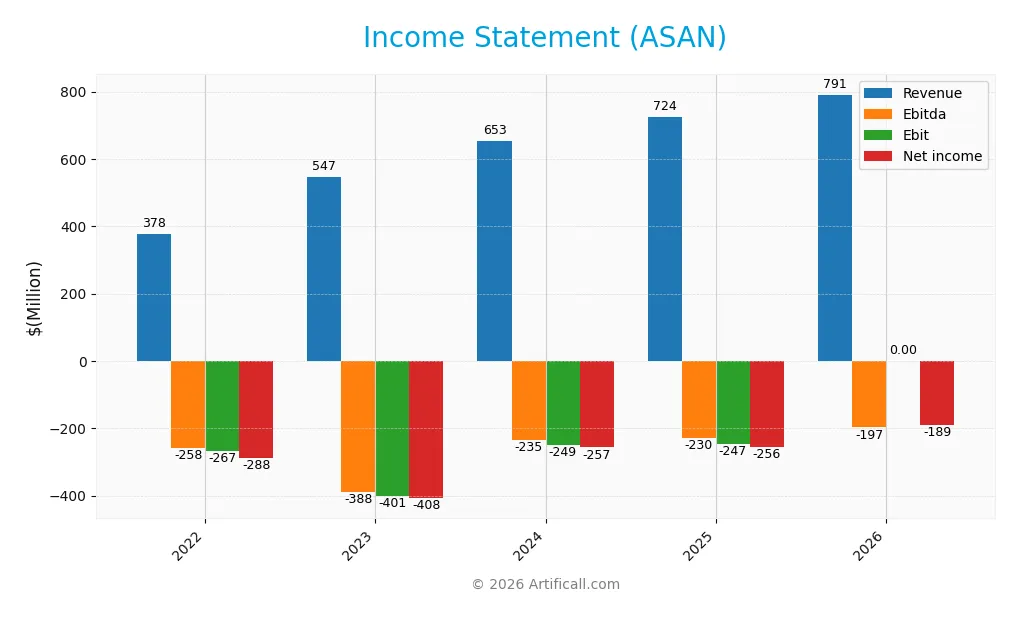
The following table summarizes Asana, Inc.’s annual income statement figures for fiscal years 2022 through 2026, reported in USD.
| 2022 | 2023 | 2024 | 2025 | 2026 | |
|---|---|---|---|---|---|
| Revenue | 378M | 547M | 653M | 724M | 791M |
| Cost of Revenue | 39M | 57M | 65M | 77M | 87M |
| Operating Expenses | 605M | 898M | 858M | 913M | 901M |
| Gross Profit | 340M | 491M | 588M | 647M | 704M |
| EBITDA | -258M | -388M | -235M | -230M | -146M |
| EBIT | -267M | -401M | -249M | -247M | -168M |
| Interest Expense | 18M | 2M | 4M | 4M | 16M |
| Net Income | -288M | -408M | -257M | -256M | -189M |
| EPS | -1.63 | -2.04 | -1.17 | -1.11 | -0.80 |
| Filing Date | 2022-03-24 | 2023-03-24 | 2024-03-14 | 2025-03-18 | 2026-03-13 |
Income Statement Evolution
Asana’s revenue rose steadily from 378M in 2022 to 791M in 2026, more than doubling over five years. Gross profit expanded consistently, maintaining a high gross margin near 89%. Operating and net margins remain negative but improved significantly, reflecting better cost control and operational leverage over time.
Is the Income Statement Favorable?
In 2026, Asana posted a 9.25% revenue increase and an 8.87% gross profit rise year-over-year. The company sustained a high gross margin of 89%, though EBIT and net margins stayed negative at -21% and -24%, respectively. Interest expense was well managed at 2%. Overall, fundamentals show marked improvement but still reflect ongoing operating losses.
Financial Ratios
The table below summarizes key financial ratios for Asana, Inc. from 2022 to 2026, highlighting profitability, efficiency, leverage, and liquidity metrics:
| Ratios | 2022 | 2023 | 2024 | 2025 | 2026 |
|---|---|---|---|---|---|
| Net Margin | -76% | -75% | -39% | -35% | -24% |
| ROE | -141% | -114% | -79% | -112% | -123% |
| ROIC | -56% | -64% | -44% | -53% | -54% |
| P/E | -32 | -8 | -15 | -19 | -13 |
| P/B | 45.4 | 8.7 | 11.8 | 21.5 | 15.8 |
| Current Ratio | 1.61 | 1.99 | 1.80 | 1.44 | 1.18 |
| Quick Ratio | 1.61 | 1.99 | 1.80 | 1.44 | 1.18 |
| D/E | 1.25 | 0.76 | 0.85 | 1.18 | 1.35 |
| Debt-to-Assets | 36% | 28% | 29% | 30% | 25% |
| Interest Coverage | -14 | -204 | -68 | -72 | -12 |
| Asset Turnover | 0.54 | 0.57 | 0.68 | 0.81 | 0.94 |
| Fixed Asset Turnover | 1.38 | 2.02 | 2.34 | 2.76 | 3.57 |
| Dividend Yield | 0 | 0 | 0 | 0 | 0 |
All percentages are rounded. Negative values indicate losses or negative returns. Interest coverage below zero signals earnings insufficient to cover interest expenses. The elevated P/B ratios reflect a high market valuation against book value. Current and quick ratios above 1 suggest adequate short-term liquidity.
Evolution of Financial Ratios
I observe Asana’s Return on Equity (ROE) remained deeply negative, worsening from -1.41 in 2022 to -1.23 in 2026, indicating persistent losses. The Current Ratio steadily declined from 1.99 in 2023 to 1.18 in 2026, reflecting reduced short-term liquidity. Debt-to-Equity increased from 0.76 in 2023 to 1.35 in 2026, signaling rising leverage. Profitability margins showed slight improvement but stayed negative.
Are the Financial Ratios Favorable?
In 2026, Asana’s profitability ratios, including net margin (-23.9%) and ROE (-122.65%), are unfavorable, underscoring ongoing losses. Liquidity ratios are mixed: a neutral Current Ratio (1.18) contrasts with a favorable Quick Ratio. Leverage is unfavorable, with a Debt-to-Equity of 1.35. Efficiency appears neutral for asset turnover (0.94) but favorable for fixed asset turnover (3.57). Market valuation ratios are mostly unfavorable, leading to a slightly unfavorable overall assessment.
Shareholder Return Policy
Asana, Inc. does not pay dividends, reflecting its ongoing net losses and reinvestment focus. The company prioritizes growth and R&D over shareholder distributions. It does not currently engage in share buybacks.
This approach aligns with a high-growth phase strategy, aiming to build long-term value rather than provide immediate returns. However, sustained negative margins and leverage require monitoring to assess if this policy supports durable shareholder value creation.
Score analysis
The following radar chart illustrates Asana, Inc.’s key financial scores across valuation and profitability metrics:
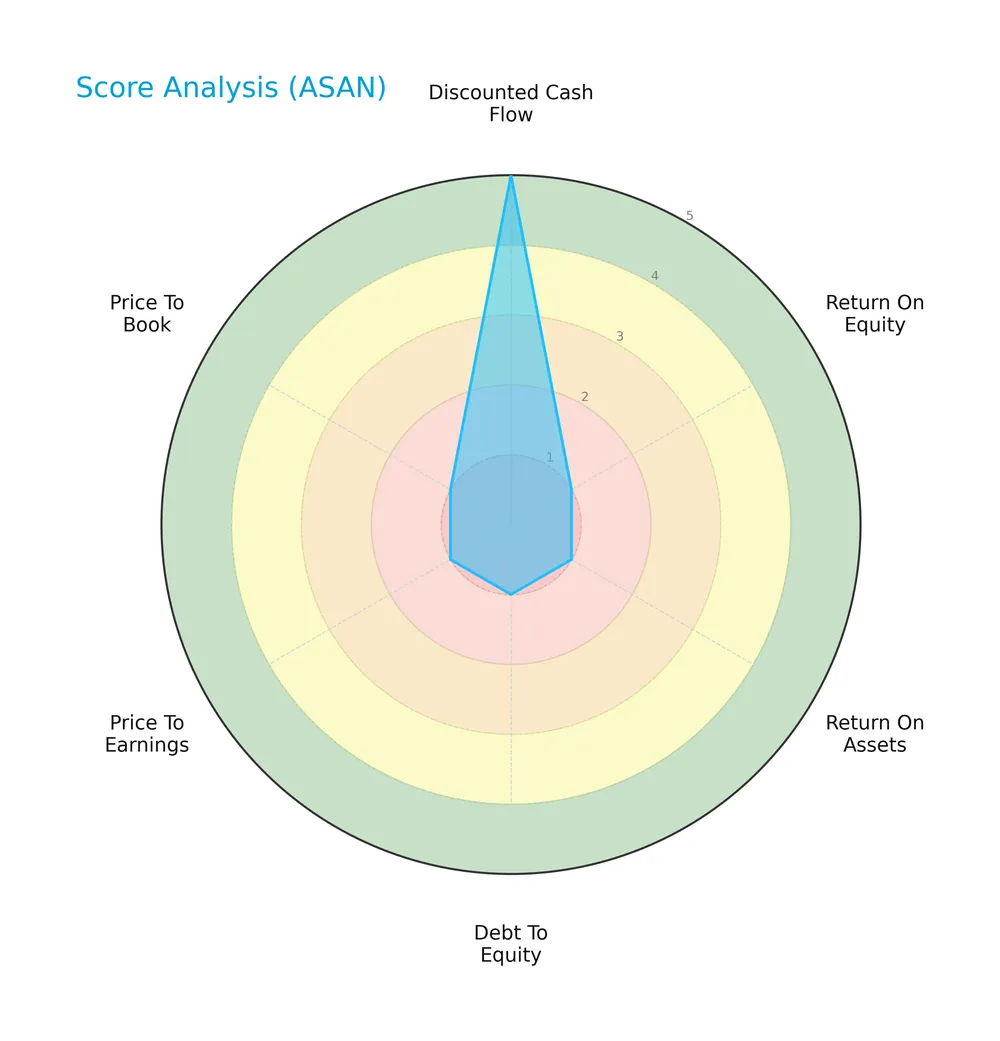
Asana scores highest on discounted cash flow with a very favorable 5. However, it registers very unfavorable scores of 1 in return on equity, return on assets, debt to equity, price to earnings, and price to book, signaling underlying financial challenges.
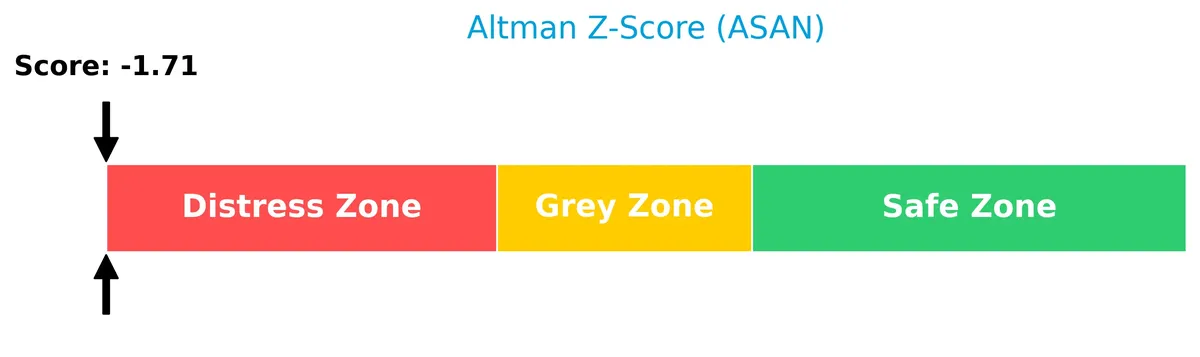
Analysis of the company’s bankruptcy risk
The Altman Z-Score places Asana firmly in the distress zone, indicating a high probability of financial distress and potential bankruptcy risk:
Is the company in good financial health?
The Piotroski F-Score diagram below assesses Asana’s financial strength based on nine accounting criteria:

With a very weak Piotroski score of 3, Asana exhibits poor financial health, reflecting weaknesses in profitability, leverage, and operational efficiency.
Competitive Landscape & Sector Positioning
This sector analysis explores Asana, Inc.’s strategic positioning, revenue segments, key products, main competitors, and competitive advantages. I will assess whether Asana maintains a sustainable edge over its peers in the software application industry.
Strategic Positioning
Asana concentrates on a work management platform serving diverse industries, primarily in the US, which accounts for about 59% of 2026 revenue. Non-US markets contribute 41%, reflecting a growing but still secondary geographic exposure. The product portfolio remains focused on application software.
Key Products & Brands
The following table outlines Asana, Inc.’s key products and brand focus areas:
| Product | Description |
|---|---|
| Work Management Platform | A software platform that helps individuals, team leads, and executives manage tasks and strategic initiatives across industries. |
Asana, Inc. specializes in a versatile work management platform that supports collaboration on daily tasks and large projects. It serves diverse sectors, including technology, retail, healthcare, and government, emphasizing cross-functional coordination.
Main Competitors
There are 33 competitors in the Software – Application industry; below are the top 10 leaders by market capitalization:
| Competitor | Market Cap. |
|---|---|
| Salesforce, Inc. | 242.5B |
| Shopify Inc. | 209.6B |
| AppLovin Corporation | 209.0B |
| Intuit Inc. | 175.2B |
| Uber Technologies, Inc. | 172.2B |
| ServiceNow, Inc. | 153.0B |
| Cadence Design Systems, Inc. | 84.5B |
| Snowflake Inc. | 73.4B |
| Autodesk, Inc. | 61.2B |
| Workday, Inc. | 54.9B |
Asana, Inc. ranks 30th among 33 competitors, with a market cap just 0.6% of the top player Salesforce. It sits well below both the average market cap of the top 10 competitors (143.6B) and the sector median (18.8B). The company is separated from its closest competitor above by a significant 186.7% gap, highlighting a steep climb to the upper echelons of the sector.
Does ASAN have a competitive advantage?
Asana, Inc. currently lacks a strong competitive advantage, as its ROIC significantly trails its WACC, indicating value destruction despite improving profitability. The company operates in a competitive software application sector with high gross margins but negative net margins.
Looking ahead, Asana’s expanding revenue in both U.S. and international markets and ongoing product development present growth opportunities. Continued improvement in operating efficiency and margin expansion will be critical to translating these prospects into a sustainable competitive advantage.
Comparisons with competitors
Check out how we compare the company to its competitors:
SWOT Analysis
This analysis identifies Asana’s internal strengths and weaknesses alongside external opportunities and threats to inform strategic decisions.
Strengths
- High gross margin at 89%
- Strong revenue growth over 108% (2022-26)
- Expanding international sales
- Favorable one-year growth in EBIT and EPS
Weaknesses
- Negative net margin at -24%
- ROIC well below WACC, destroying value
- Weak return on equity at -123%
- High price-to-book ratio at 15.75
Opportunities
- Growing global demand for work management software
- Opportunity to improve profitability and ROIC
- Expansion into diverse industries and geographies
Threats
- Intense competition in software applications
- Financial distress risk indicated by Altman Z-score
- High debt-to-equity ratio at 1.35 raises leverage concerns
Asana demonstrates strong top-line growth and market penetration but suffers from poor profitability and value destruction. The company must focus on improving operational efficiency and capital allocation to convert growth into sustainable returns.
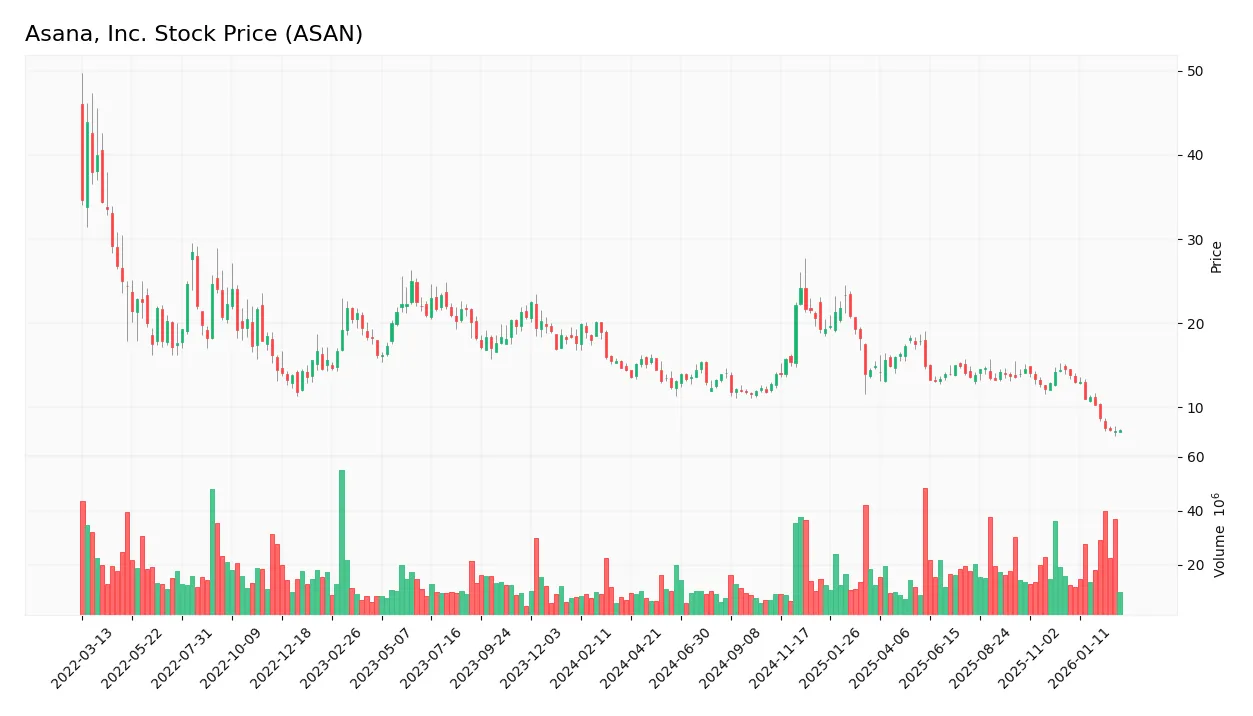
Stock Price Action Analysis
The weekly stock chart for Asana, Inc. (ASAN) reveals significant price fluctuations and a marked downward trajectory over the analyzed period:
Trend Analysis
Over the past 12 months, ASAN’s stock price declined 60.75%, indicating a strong bearish trend. The highest price was 24.15, the lowest 6.17, with trend deceleration noted. The 3.52 standard deviation signals substantial volatility throughout the year.
Volume Analysis
Trading volumes over the last three months show increasing activity but remain seller-dominant. Buyer volume accounted for only 17.2%, reflecting cautious investor sentiment and stronger selling pressure during this period.
Target Prices
Analysts set a target consensus of $13.29 for Asana, Inc., reflecting moderate growth expectations.
| Target Low | Target High | Consensus |
|---|---|---|
| 8 | 18 | 13.29 |
The range from $8 to $18 indicates some uncertainty, but the consensus suggests steady appreciation potential.
Analyst & Consumer Opinions
This section examines analyst grades and consumer feedback to provide a comprehensive view of Asana, Inc.’s market perception.

Don’t Let Luck Decide Your Entry Point
Optimize your entry points with our advanced ProRealTime indicators. You’ll get efficient buy signals with precise price targets for maximum performance. Start outperforming now!
Stock Grades
Here is the latest snapshot of Asana, Inc. stock grades from recognized analysts as of early 2026:
| Grading Company | Action | New Grade | Date |
|---|---|---|---|
| Keybanc | Maintain | Overweight | 2026-03-03 |
| Baird | Maintain | Neutral | 2026-03-03 |
| Citigroup | Maintain | Buy | 2026-03-03 |
| Morgan Stanley | Maintain | Underweight | 2026-03-03 |
| RBC Capital | Maintain | Underperform | 2026-03-03 |
| UBS | Maintain | Neutral | 2026-03-03 |
| Piper Sandler | Maintain | Overweight | 2026-03-03 |
| Jefferies | Maintain | Hold | 2026-02-23 |
| Piper Sandler | Maintain | Overweight | 2026-02-03 |
| Citigroup | Upgrade | Buy | 2026-01-15 |
The consensus leans toward a Buy with 8 out of 18 actionable grades favoring it, while 7 recommend Hold and 3 advise Sell. Overall, the ratings reveal a cautious optimism with mixed views across top firms.
Consumer Opinions
Consumers express mixed feelings about Asana, Inc., reflecting strong appreciation for usability but concerns over pricing and feature depth.
| Positive Reviews | Negative Reviews |
|---|---|
| Intuitive interface simplifies teamwork | Pricing feels steep for small teams |
| Reliable performance with minimal bugs | Lacks advanced reporting for power users |
| Excellent integration with other tools | Steeper learning curve for new users |
Overall, users praise Asana’s ease of use and seamless integrations. However, some find the cost prohibitive and desire more robust analytics. These points suggest room to enhance value for diverse customer segments.
Risk Analysis
Below is a summary table highlighting key risks facing Asana, Inc., with their probability and potential impact:
| Category | Description | Probability | Impact |
|---|---|---|---|
| Financial Health | Negative net margin (-23.9%) and ROE (-122.65%) indicate ongoing losses. | High | High |
| Bankruptcy Risk | Altman Z-Score of -1.92 places the company in distress zone. | High | Very High |
| Leverage | Debt-to-equity ratio of 1.35 signals heavy reliance on debt financing. | Medium | Medium |
| Liquidity | Current ratio at 1.18 is borderline; limited cushion for short-term obligations. | Medium | Medium |
| Profitability | Negative ROIC (-53.64%) well below WACC (8.94%) indicates value destruction. | High | High |
| Market Valuation | Price-to-book ratio of 15.75 suggests overvaluation risk. | Medium | Medium |
| Dividend Policy | Zero dividend yield limits income for yield-focused investors. | Low | Low |
The greatest risks lie in Asana’s financial health and bankruptcy potential. A distress-level Altman Z-Score coupled with deep losses signals high financial vulnerability. Historically, companies in the software sector with similar profiles struggle to sustain growth or attract capital without strategic shifts. Investors must weigh these red flags against the company’s growth prospects and market position.
Should You Buy Asana, Inc.?
Asana, Inc. appears to be shedding value despite a modestly improving ROIC, suggesting operational efficiency gains. Its leverage profile seems substantial amid distress-zone Altman Z-Scores, while the overall rating of C reflects a very weak financial health profile and limited profitability.
Strength & Efficiency Pillars
Asana, Inc. exhibits operational resilience with a robust gross margin of 89.03%, reflecting strong pricing power and cost control. Interest expense remains low at 2.06%, supporting manageable financing costs. The company’s revenue growth of 9.25% and net margin growth of 32.29% over one year indicate improving operational momentum. However, profitability metrics such as net margin (-23.9%), ROE (-122.65%), and ROIC (-53.64%) remain deeply negative. Notably, ROIC is well below WACC (8.94%), signaling that Asana is currently destroying value rather than creating it.
Weaknesses and Drawbacks
Asana is in financial distress, with an Altman Z-Score of -1.92 firmly in the Distress Zone, implying a high bankruptcy risk. This solvency concern outweighs any operational progress. The company also faces valuation headwinds: a high price-to-book ratio of 15.75 suggests an inflated market premium despite poor fundamentals. Leverage is elevated, with a debt-to-equity ratio of 1.35, raising financial risk. Recent market action is seller-dominant with only 17.2% buyer volume, reflecting investor skepticism and short-term pressure.
Our Final Verdict about Asana, Inc.
Despite some favorable trends in revenue and gross margin growth, Asana’s distressed financial position and negative returns on capital render its profile highly speculative. The solvency risk marked by the Altman Z-Score of -1.92 makes the stock too risky for conservative capital. Investors might consider waiting for a material improvement in financial health before increasing exposure.
Disclaimer: This content is for informational purposes only and does not constitute financial, investment, or other professional advice. Investing in financial markets involves a significant risk of loss, and past performance is not indicative of future results.
Additional Resources
- [144] Asana, Inc. SEC Filing – Stock Titan (Mar 27, 2026)
- Growing market skepticism ahead of Asana (ASAN) earnings release – MSN (Mar 27, 2026)
- Insider Sell: Sonalee Parekh Sells Shares of Asana Inc (ASAN) – GuruFocus (Mar 25, 2026)
- Insider Selling: Asana (NYSE:ASAN) CFO Sells 34,151 Shares of Stock – MarketBeat (Mar 25, 2026)
- Asana to Present at Upcoming Investor Events – Asana (Nov 25, 2025)
For more information about Asana, Inc., please visit the official website: asana.com