Home > Analyses > Financial Services > Arthur J. Gallagher & Co.
Arthur J. Gallagher & Co. molds risk landscapes for thousands of businesses worldwide. It commands the insurance brokerage arena with a diverse portfolio spanning retail, wholesale, and specialized coverage. Renowned for innovation and deep market insight, AJG delivers tailored risk management and consulting services across multiple continents. As global uncertainties evolve, I ask: Does Gallagher’s robust model still justify its premium valuation and growth outlook in 2026?

Table of contents
Business Model & Company Overview
Arthur J. Gallagher & Co., founded in 1927 and headquartered in Rolling Meadows, Illinois, stands as a leading insurance broker with a global footprint. It unites insurance brokerage, consulting, and claims settlement into a comprehensive ecosystem. This approach serves commercial, industrial, public, and not-for-profit clients through a vast network of brokers and consultants, reinforcing its dominant industry position.
The company’s revenue engine balances retail and wholesale brokerage with risk management services, generating stable, recurring income. Its strategic presence spans the Americas, Europe, Asia, and beyond, enabling tailored solutions in insurance placement and claims administration. Arthur J. Gallagher & Co. wields a durable economic moat through its extensive distribution network and specialized expertise, shaping the future of global risk management.
Financial Performance & Fundamental Metrics
I analyze Arthur J. Gallagher & Co.’s income statement, key financial ratios, and dividend payout policy to assess its core financial health and shareholder value.
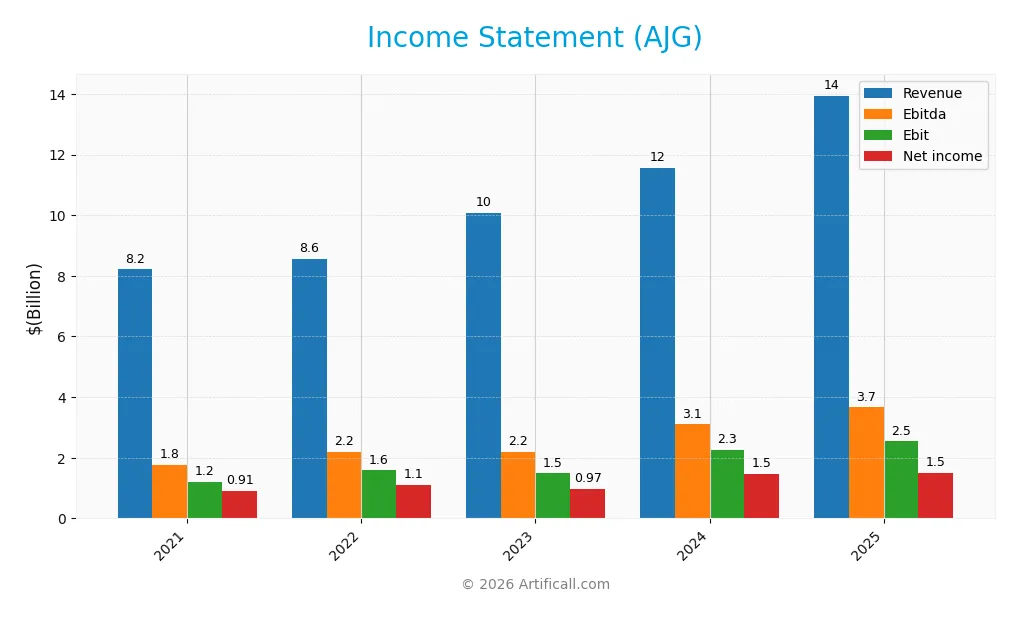
Income Statement
The table below summarizes Arthur J. Gallagher & Co.’s key income statement metrics from 2021 to 2025, illustrating its financial progression over five fiscal years.
| 2021 | 2022 | 2023 | 2024 | 2025 | |
|---|---|---|---|---|---|
| Revenue | 8.21B | 8.55B | 10.07B | 11.55B | 13.94B |
| Cost of Revenue | 5.23B | 4.95B | 5.83B | 6.68B | 6.31B |
| Operating Expenses | 1.64B | 1.93B | 2.39B | 2.60B | 5.08B |
| Gross Profit | 2.98B | 3.60B | 4.25B | 4.88B | 7.63B |
| EBITDA | 1.77B | 2.18B | 2.18B | 3.10B | 3.66B |
| EBIT | 1.20B | 1.58B | 1.48B | 2.26B | 2.54B |
| Interest Expense | 226M | 257M | 297M | 381M | 639M |
| Net Income | 907M | 1.11B | 970M | 1.46B | 1.49B |
| EPS | 4.47 | 5.30 | 4.51 | 6.63 | 5.83 |
| Filing Date | 2022-02-18 | 2023-02-10 | 2024-02-09 | 2025-02-18 | 2026-02-17 |
Income Statement Evolution
Arthur J. Gallagher & Co. grew revenue by nearly 70% from 2021 to 2025, with a strong 21% jump in 2025 alone. Net income rose 65% over the period but showed slight margin compression. Gross margin remains robust at 54.75%, while EBIT margin improved favorably to 18.21%. Net margin dipped marginally by 3%, reflecting a minor efficiency challenge.
Is the Income Statement Favorable?
The 2025 income statement reveals solid fundamentals with $13.9B revenue and $1.49B net income. EBITDA margin and interest expense ratio both signal operational strength. Yet, a 15% decline in net margin and 12% drop in EPS year-over-year raise caution. Overall, 71% of key metrics rate favorable, supporting a broadly positive financial health view.
Financial Ratios
The table below summarizes key financial ratios for Arthur J. Gallagher & Co. across recent fiscal years, offering a snapshot of profitability, liquidity, leverage, and valuation metrics:
| Ratios | 2021 | 2022 | 2023 | 2024 | 2025 |
|---|---|---|---|---|---|
| Net Margin | 11% | 13% | 10% | 13% | 11% |
| ROE | 11% | 12% | 9.0% | 7.3% | 6.4% |
| ROIC | 7.7% | 8.0% | 7.0% | 5.1% | 5.2% |
| P/E | 38 | 36 | 50 | 43 | 45 |
| P/B | 4.0 | 4.3 | 4.5 | 3.1 | 2.9 |
| Current Ratio | 1.06 | 1.04 | 1.03 | 1.51 | 1.06 |
| Quick Ratio | 1.06 | 1.04 | 1.03 | 1.51 | 1.06 |
| D/E | 0.77 | 0.70 | 0.77 | 0.67 | 0.60 |
| Debt-to-Assets | 20% | 17% | 16% | 21% | 20% |
| Interest Coverage | 5.9x | 6.5x | 6.3x | 6.0x | 4.0x |
| Asset Turnover | 0.25 | 0.22 | 0.20 | 0.18 | 0.20 |
| Fixed Asset Turnover | 9.6 | 9.3 | 8.9 | 11.2 | 10.1 |
| Dividend Yield | 1.1% | 1.1% | 1.0% | 0.8% | 1.0% |
Evolution of Financial Ratios
Arthur J. Gallagher & Co.’s Return on Equity (ROE) declined from around 12% in 2022 to 6.4% in 2025. The Current Ratio showed volatility, peaking at 1.51 in 2024 and settling near 1.06 in 2025. Debt-to-Equity ratio decreased steadily from 0.77 in 2021 to 0.60 in 2025, reflecting moderate deleveraging. Profitability margins fluctuated with net margin shrinking from 13% in 2022 to 10.7% in 2025.
Are the Financial Ratios Favorable?
In 2025, AJG’s profitability shows mixed signals: net margin is favorable at 10.7%, but ROE at 6.4% is unfavorable compared to typical market benchmarks above 10%. Liquidity ratios are neutral to favorable, with Current Ratio at 1.06 and Quick Ratio slightly better. Leverage is moderate, with Debt-to-Equity at 0.6 and Debt-to-Assets at 19.8%, considered favorable. Market valuation appears stretched, with a high P/E of 45.1 marked unfavorable, while asset turnover remains low and unfavorable. Overall, the ratios present a slightly favorable financial position.
Shareholder Return Policy
Arthur J. Gallagher & Co. maintains a consistent dividend policy, with a payout ratio around 36%-49% over recent years and a dividend yield near 1%. The company also executes share buybacks, indicating a balanced approach to returning capital.
The dividend payments appear well-covered by earnings, supporting sustainability. This distribution strategy, combined with buybacks, aligns with prudent capital allocation to enhance long-term shareholder value without overextending financial resources.
Score analysis
Here is a radar chart illustrating Arthur J. Gallagher & Co.’s key financial scores across valuation and performance metrics:
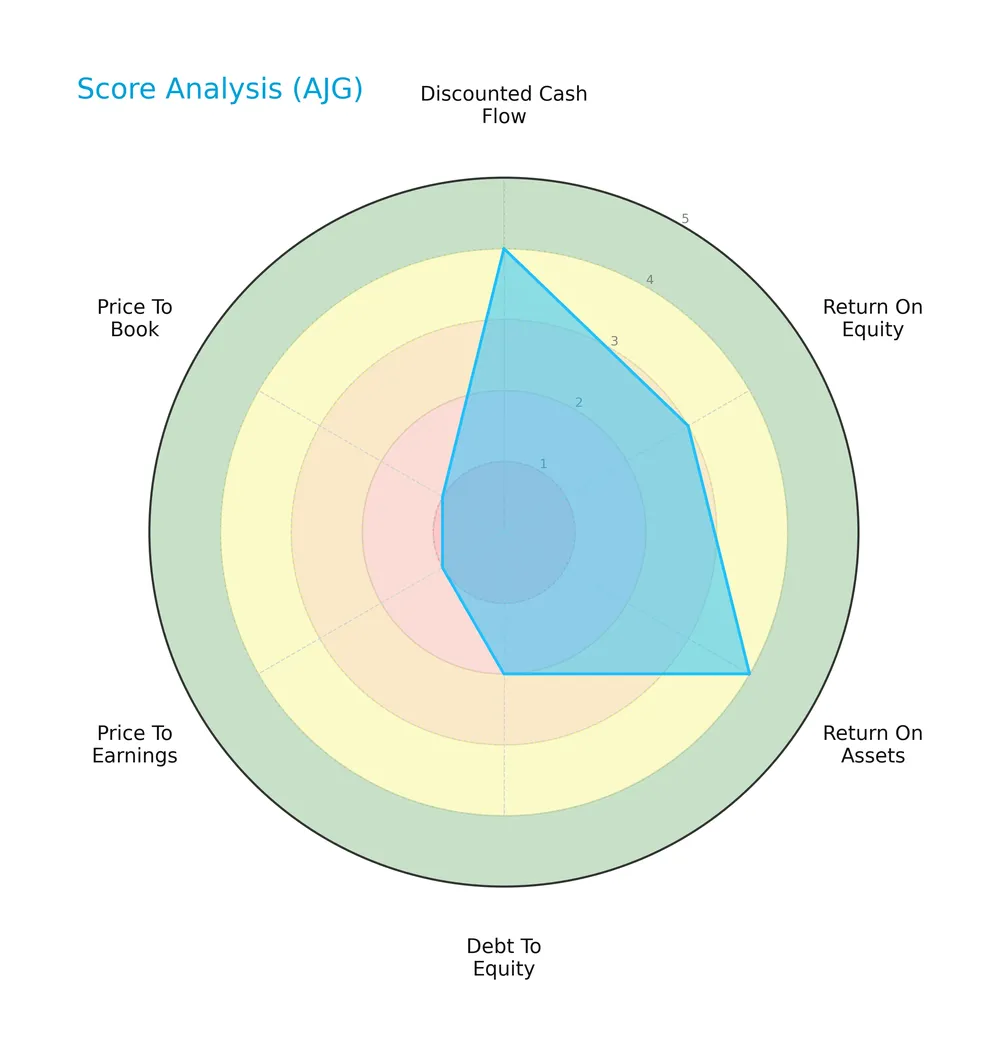
The company scores favorably in discounted cash flow (4) and return on assets (4), showing solid operational efficiency. Return on equity is moderate (3). However, debt to equity (2) is unfavorable, and valuation metrics price to earnings (1) and price to book (1) are very unfavorable, signaling valuation concerns.
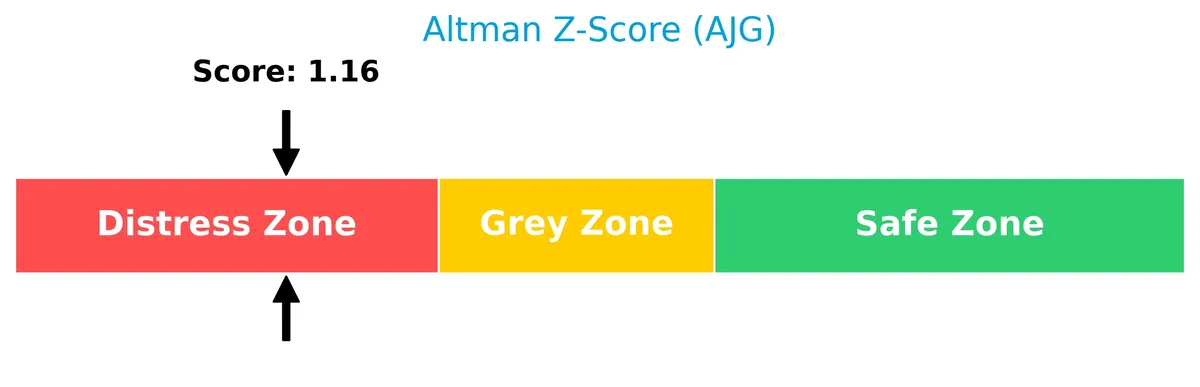
Analysis of the company’s bankruptcy risk
Arthur J. Gallagher & Co.’s Altman Z-Score places it in the distress zone, indicating a high risk of financial distress and potential bankruptcy:
Is the company in good financial health?
The Piotroski Score diagram presents a middle-ground view of the company’s overall financial strength:

With a Piotroski Score of 4, the company shows average financial health. This suggests moderate profitability and efficiency but leaves room for improvement in financial robustness.
Competitive Landscape & Sector Positioning
This analysis explores Arthur J. Gallagher & Co.’s strategic positioning, revenue segments, and competitive environment. I will assess whether AJG holds a competitive advantage over its main rivals.
Strategic Positioning
Arthur J. Gallagher & Co. maintains a diversified insurance brokerage and risk management portfolio. It operates primarily in the US (9.4B in 2025), with significant presence in the UK (2.5B), Australia, Canada, and New Zealand. The company balances retail and wholesale brokerage with consulting and claims services globally.
Revenue by Segment
This pie chart displays Arthur J. Gallagher & Co.’s revenue distribution by segment for the fiscal year 2025, highlighting the key business drivers and revenue sources.
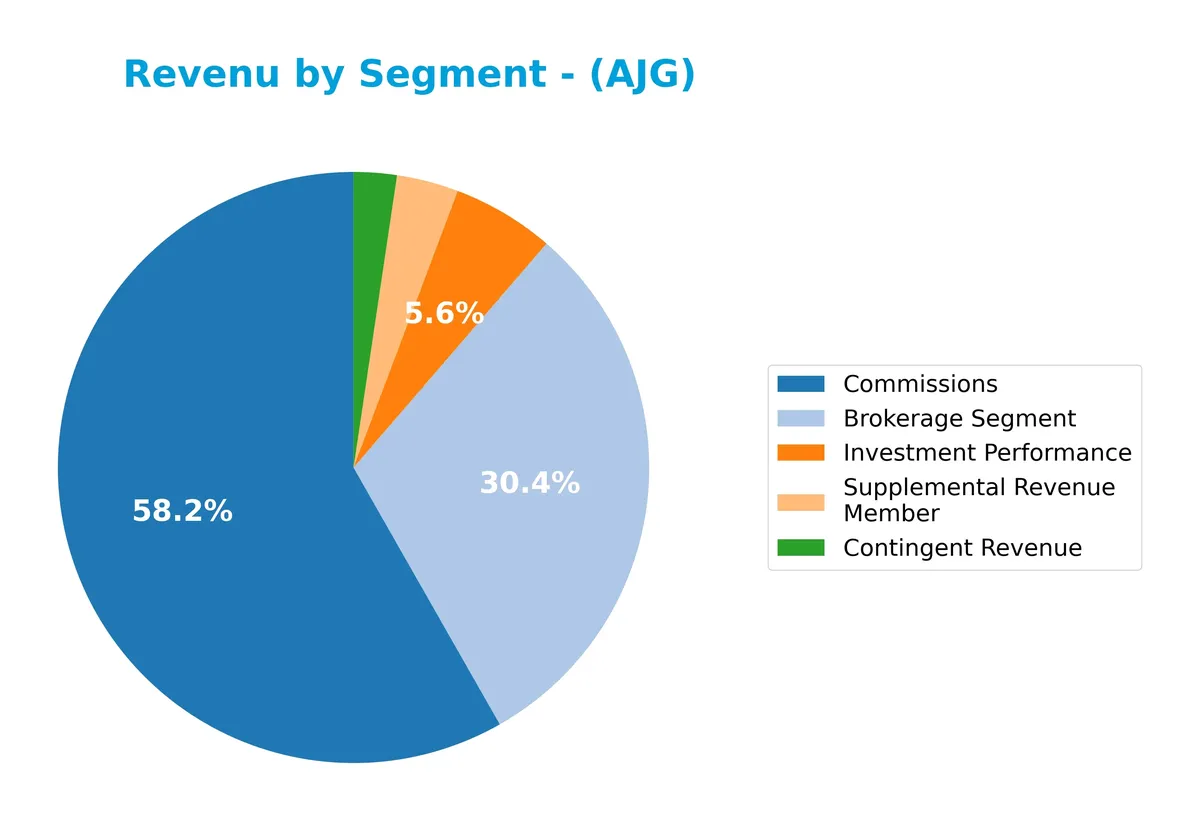
In 2025, Commissions lead with $8B, underlining its dominant role in Gallagher’s revenue mix. The Brokerage Segment follows with $4.2B, showing steady growth from prior years. Investment Performance and Supplemental Revenue contribute smaller but notable streams at $769M and $466M, respectively. Contingent Revenue remains minor at $324M. The data reflects a concentration in Commissions and Brokerage, signaling reliance on core insurance brokerage activities while ancillary revenues grow modestly.
Key Products & Brands
The following table details Arthur J. Gallagher & Co.’s primary products and services generating revenue:
| Product | Description |
|---|---|
| Brokerage Segment | Retail and wholesale insurance brokerage, specialized and hard-to-place insurance placement, policy underwriting, and consulting. |
| Risk Management Segment | Contract claim settlement, claims management, loss control consulting, and insurance property appraisal services. |
| Commissions | Fees earned from placing insurance policies and related brokerage services. |
| Contingent Revenue | Performance-based income linked to insurance brokerage activities. |
| Investment Performance | Income generated from investment activities related to brokerage operations. |
| Supplemental Revenue Member | Additional revenue streams associated with membership or supplementary services. |
| Corporate Segment | Corporate-level activities and services not classified under brokerage or risk management segments. |
Arthur J. Gallagher & Co. operates a diversified portfolio centered on insurance brokerage and risk management. Its offerings cover a broad spectrum from retail brokerage to claims administration, reflecting steady growth in both core and ancillary revenue streams.
Main Competitors
There are 6 competitors in the Financial Services sector; the table lists the top 6 leaders by market capitalization:
| Competitor | Market Cap. |
|---|---|
| Marsh & McLennan Companies, Inc. | 89.8B |
| Aon plc | 74.4B |
| Arthur J. Gallagher & Co. | 65.7B |
| Willis Towers Watson Public Limited Company | 32.3B |
| Brown & Brown, Inc. | 26.5B |
| Erie Indemnity Company | 12.8B |
Arthur J. Gallagher & Co. ranks 3rd among its 6 main competitors. Its market cap is 61.2% of the leader, Marsh & McLennan Companies. The company trades above both the average market cap of the top 10 (50.3B) and the sector median (49.0B). It maintains a 35.4% market cap premium over its closest rival, Aon plc, highlighting a solid positioning gap.
Comparisons with competitors
Check out how we compare the company to its competitors:
Does AJG have a competitive advantage?
Arthur J. Gallagher & Co. does not present a competitive advantage. Its return on invested capital (ROIC) has trended downward and currently falls below its weighted average cost of capital (WACC), indicating value destruction.
Looking ahead, AJG’s diversified geographic footprint and expanding revenue in the United States and United Kingdom offer growth opportunities. Continued innovation in insurance brokerage and risk management services could improve future profitability.
SWOT Analysis
This SWOT analysis highlights Arthur J. Gallagher & Co.’s key internal and external factors shaping its strategic positioning.
Strengths
- strong market presence in US and UK
- diverse global footprint
- robust gross margin of 54.75%
Weaknesses
- declining ROIC indicating value destruction
- net margin growth negative over recent year
- relatively high P/E of 45.1 signals valuation risk
Opportunities
- expanding insurance demand in emerging markets
- growth through acquisitions
- technological advances in risk management
Threats
- intense competition in insurance brokerage
- regulatory changes in financial services
- economic downturns impacting client spending
Overall, Arthur J. Gallagher & Co. benefits from a broad global reach and solid profitability but faces challenges with declining capital efficiency and valuation concerns. The company must leverage growth opportunities while addressing operational efficiency to sustain its competitive edge.
Stock Price Action Analysis
The weekly price chart below illustrates Arthur J. Gallagher & Co.’s stock performance over the past 12 months:
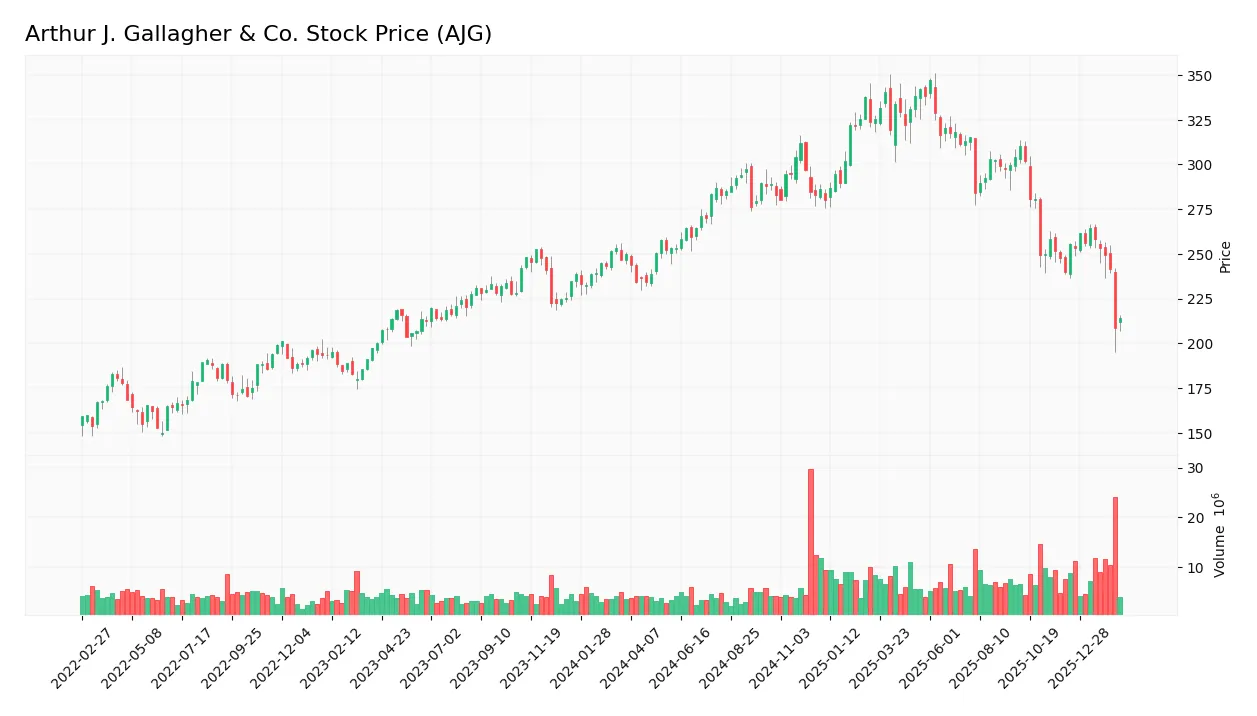
Trend Analysis
Over the past 12 months, AJG’s stock price declined by 14.41%, indicating a bearish trend. The price moved from a high of 347.44 to a low of 208.45, with volatility at a high 31.36 standard deviation. The trend shows deceleration, reflecting a slowing pace in the downward movement.
Volume Analysis
Trading volumes have increased overall, with sellers dominating at 51.87% of the total 764M shares traded. In the recent three months, seller volume surged to 91M vs. buyer volume at 24M, signaling strong selling pressure and cautious investor sentiment.
Target Prices
Analysts set a clear target consensus for Arthur J. Gallagher & Co., reflecting cautious optimism.
| Target Low | Target High | Consensus |
|---|---|---|
| 247 | 334 | 282.23 |
The target prices suggest analysts expect moderate upside potential, balancing growth prospects with sector volatility.

Don’t Let Luck Decide Your Entry Point
Optimize your entry points with our advanced ProRealTime indicators. You’ll get efficient buy signals with precise price targets for maximum performance. Start outperforming now!
Analyst & Consumer Opinions
This section examines Arthur J. Gallagher & Co.’s analyst ratings and consumer feedback to gauge market sentiment accurately.
Stock Grades
The following table presents the latest verified grades for Arthur J. Gallagher & Co. from established financial institutions:
| Grading Company | Action | New Grade | Date |
|---|---|---|---|
| Citigroup | Maintain | Neutral | 2026-02-02 |
| Jefferies | Maintain | Hold | 2026-02-02 |
| UBS | Maintain | Neutral | 2026-02-02 |
| Piper Sandler | Maintain | Neutral | 2026-01-30 |
| Wells Fargo | Maintain | Overweight | 2026-01-30 |
| Keefe, Bruyette & Woods | Maintain | Market Perform | 2026-01-30 |
| Cantor Fitzgerald | Downgrade | Neutral | 2026-01-14 |
| BMO Capital | Downgrade | Market Perform | 2026-01-13 |
| Wells Fargo | Maintain | Overweight | 2026-01-13 |
| Barclays | Maintain | Underweight | 2026-01-08 |
Grades remain largely stable with a majority maintaining neutral or hold ratings. Notably, recent downgrades from overweight and outperform to neutral and market perform suggest cautious sentiment among some analysts.
Consumer Opinions
Arthur J. Gallagher & Co. enjoys a solid reputation among clients for its reliable insurance brokerage services.
| Positive Reviews | Negative Reviews |
|---|---|
| Responsive customer service | Complex claims process |
| Knowledgeable and professional staff | Occasional delays in policy updates |
| Competitive pricing | Limited digital self-service options |
Overall, clients praise Gallagher for its expert advice and attentive service. However, some express frustration with administrative delays and a need for improved digital tools. These issues may affect customer satisfaction in an increasingly tech-driven market.
Risk Analysis
Below is a summary of key risks facing Arthur J. Gallagher & Co., categorized by their likelihood and potential impact:
| Category | Description | Probability | Impact |
|---|---|---|---|
| Financial Health | Altman Z-Score in distress zone indicates bankruptcy risk | High | High |
| Valuation | Elevated P/E (45.1) and unfavorable P/B suggest overvaluation | Medium | Medium |
| Profitability | Low ROE (6.41%) relative to WACC (6.15%) signals weak capital returns | Medium | Medium |
| Liquidity | Current ratio near 1.06 poses moderate liquidity risk | Medium | Low |
| Debt Management | Moderate debt-to-equity ratio (0.6) with neutral interest coverage | Low | Low |
| Market Volatility | Beta at 0.658 indicates below-average sensitivity to market swings | Low | Low |
Arthur J. Gallagher & Co. faces its most critical threat from a low Altman Z-Score, signaling possible financial distress despite stable liquidity. Its high valuation metrics amplify risk if growth stalls. Investors must weigh these risks amid modest profitability and conservative leverage.
Should You Buy Arthur J. Gallagher & Co.?
Arthur J. Gallagher & Co. appears to have weakening profitability and a deteriorating moat, suggesting value destruction. Despite manageable leverage concerns, its overall rating of B- indicates moderate financial health, tempered by signs of operational inefficiency and risk.
Strength & Efficiency Pillars
Arthur J. Gallagher & Co. posts a solid gross margin of 54.75% and an EBIT margin of 18.21%, underscoring operational efficiency. The net margin at 10.72% confirms profitability, although the return on equity (6.41%) is below industry averages. The return on invested capital (5.25%) slightly trails the weighted average cost of capital (6.15%), signaling that the company is currently shedding value rather than creating it. Operational margins remain the primary strength amid broader financial challenges.
Weaknesses and Drawbacks
The company is in financial distress, with an Altman Z-Score of 1.16 signaling a high bankruptcy risk. This solvency concern overrides profitability metrics. Additionally, valuation appears stretched, with a high price-to-earnings ratio of 45.1 indicating a premium that may not be justified by fundamentals. The debt-to-equity ratio is moderate at 0.6 but coupled with a current ratio of 1.06, liquidity is tight. Recent seller dominance (21.02% buyer volume) adds short-term market pressure and bearish momentum.
Our Final Verdict about Arthur J. Gallagher & Co.
Despite operational profitability, the company’s distressed solvency profile and high valuation make its investment case highly speculative. The Altman Z-Score below 1.8 places it squarely in the distress zone, suggesting elevated bankruptcy risk. Hence, Arthur J. Gallagher & Co. may appear too risky for conservative capital, warranting a cautious stance regardless of favorable income statement metrics.
Disclaimer: This content is for informational purposes only and does not constitute financial, investment, or other professional advice. Investing in financial markets involves a significant risk of loss, and past performance is not indicative of future results.
Additional Resources
- Arthur J. Gallagher adds Pittsburgh-area broker in latest US retail buy – Insurance Business (Feb 18, 2026)
- Arthur J. Gallagher & Co. Acquires B&W Insurance Agency, Inc. – PR Newswire (Feb 17, 2026)
- Arthur J. Gallagher & Co. Acquires B&W Insurance Agency, Inc. – Yahoo Finance (Feb 17, 2026)
- Arthur J. Gallagher & Co. SEC 10-K Report – TradingView (Feb 17, 2026)
- Local Pa. broker B&W Insurance joins global broker Arthur J. Gallagher – Stock Titan (Feb 17, 2026)
For more information about Arthur J. Gallagher & Co., please visit the official website: ajg.com