Home > Analyses > Technology > Arm Holdings plc American Depositary Shares
Arm Holdings plc fundamentally shapes the digital world by designing the core processing technologies that power billions of devices globally—from smartphones to automotive systems and the expanding Internet of Things. As a dominant force in the semiconductor industry, Arm stands out for its innovative CPU architectures and comprehensive intellectual property portfolio, enabling manufacturers worldwide to build efficient, cutting-edge products. As we explore Arm’s current market position and growth prospects, the key question remains: does its valuation still reflect the strength and potential of its technology leadership?

Table of contents
Business Model & Company Overview
Arm Holdings plc American Depositary Shares, founded in 1990 and headquartered in Cambridge, UK, stands as a dominant player in the semiconductor industry. The company architects, develops, and licenses a comprehensive ecosystem of microprocessors, systems IPs, and software tools that enable a wide range of markets including automotive, computing infrastructure, consumer technologies, and IoT. This integrated approach positions Arm as a crucial enabler for semiconductor companies and OEMs globally.
Arm’s revenue engine balances licensing of its core microprocessor technologies with software and support services across key global markets such as the US, China, Taiwan, and South Korea. By offering a mix of intellectual property and software, it captures recurring value while fueling innovation. This strategic footprint and diversified product portfolio create a robust economic moat that underpins its role in shaping the future of semiconductor design worldwide.
Financial Performance & Fundamental Metrics
In this section, I analyze Arm Holdings plc American Depositary Shares’ income statement, key financial ratios, and dividend payout policy to assess its fundamental strength.
Income Statement
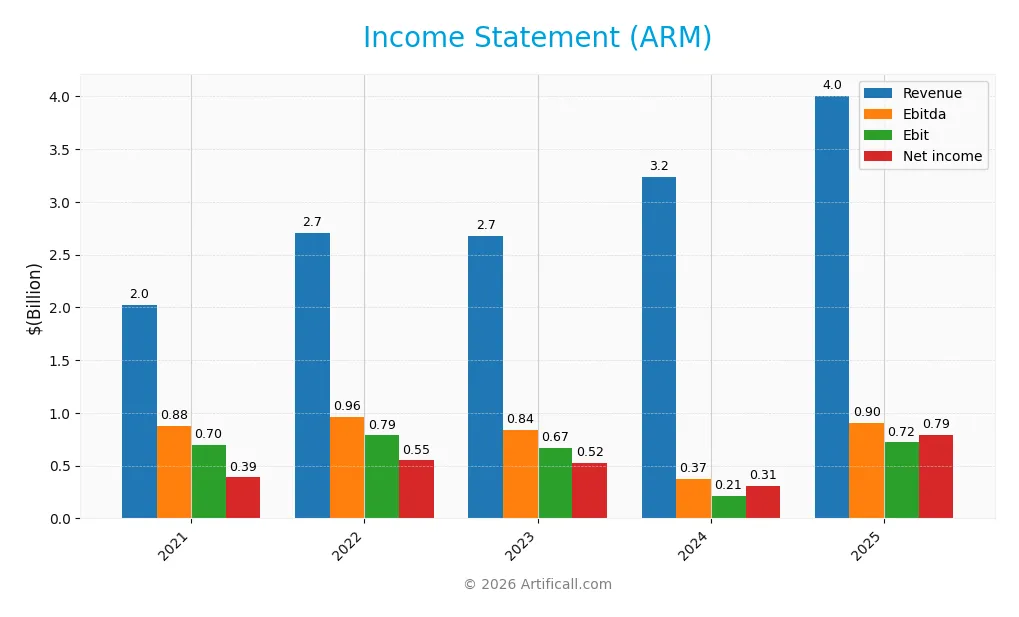
The table below presents Arm Holdings plc’s key income statement figures for fiscal years 2021 through 2025, reported in USD.
| 2021 | 2022 | 2023 | 2024 | 2025 | |
|---|---|---|---|---|---|
| Revenue | 2.03B | 2.70B | 2.68B | 3.23B | 4.01B |
| Cost of Revenue | 236M | 220M | 195M | 234M | 206M |
| Operating Expenses | 1.55B | 1.80B | 1.81B | 2.90B | 2.97B |
| Gross Profit | 1.79B | 2.48B | 2.48B | 3.00B | 3.80B |
| EBITDA | 877M | 963M | 841M | 374M | 903M |
| EBIT | 697M | 786M | 671M | 212M | 720M |
| Interest Expense | 0 | 0 | 0 | 0 | 0 |
| Net Income | 388M | 549M | 524M | 306M | 792M |
| EPS | 0.38 | 0.54 | 0.51 | 0.30 | 0.75 |
| Filing Date | 2021-03-31 | 2022-03-31 | 2023-03-31 | 2024-05-29 | 2025-05-28 |
Income Statement Evolution
Between 2021 and 2025, Arm Holdings plc’s revenue nearly doubled, rising by 97.7% to $4.01B, with net income equally impressive, growing 104.1% to $792M. Margins remained strong, with gross margin steady near 95%, and net margin showing a slight positive shift of 3.26%, indicating stable profitability alongside robust top-line growth.
Is the Income Statement Favorable?
In 2025, Arm demonstrated favorable fundamentals with a 23.9% revenue increase and a net margin of 19.8%, reflecting effective cost management and strong operational leverage. The EBIT margin at 18% and absence of interest expenses further support financial health. Overall, the income statement presents a consistently favorable profile, highlighted by substantial EPS growth and solid profit generation.
Financial Ratios
The following table presents key financial ratios for Arm Holdings plc American Depositary Shares (ARM) over the fiscal years 2021 to 2025, offering a snapshot of profitability, valuation, liquidity, leverage, efficiency, and dividend metrics:
| Ratios | 2021 | 2022 | 2023 | 2024 | 2025 |
|---|---|---|---|---|---|
| Net Margin | 19% | 20% | 20% | 9% | 20% |
| ROE | 0% | 15% | 13% | 6% | 12% |
| ROIC | 0% | 11% | 10% | 2% | 10% |
| P/E | 161 | 114 | 119 | 426 | 142 |
| P/B | 0 | 18 | 15 | 25 | 16 |
| Current Ratio | 0 | 2.2 | 2.6 | 2.8 | 5.2 |
| Quick Ratio | 0 | 2.2 | 2.6 | 2.8 | 5.2 |
| D/E | 0 | 0.07 | 0.05 | 0.04 | 0.05 |
| Debt-to-Assets | 0 | 4% | 3% | 3% | 4% |
| Interest Coverage | 0 | 0 | 0 | 0 | 0 |
| Asset Turnover | 0 | 0.42 | 0.39 | 0.41 | 0.45 |
| Fixed Asset Turnover | 0 | 6.5 | 6.9 | 7.7 | 5.6 |
| Dividend Yield | 1.2% | 0% | 0% | 0% | 0% |
Evolution of Financial Ratios
From 2021 to 2025, Arm Holdings’ Return on Equity (ROE) showed fluctuations with a peak around 15.5% in 2022 before settling near 11.6% in 2025, indicating some variability in profitability. The Current Ratio increased notably from zero in 2021 to about 5.2 in 2025, reflecting improved short-term liquidity. The Debt-to-Equity Ratio remained low and stable around 0.05, suggesting consistent leverage management.
Are the Financial Ratios Fovorable?
In 2025, Arm’s profitability ratios reveal a favorable net margin of 19.77% but a neutral ROE at 11.58% and an unfavorable return on invested capital (10.28%), while the weighted average cost of capital is high at 24.37%. Liquidity appears mixed with a high current ratio of 5.2 labeled unfavorable, but the quick ratio is favorable at the same level. Leverage ratios, including debt-to-equity (0.05) and debt-to-assets (3.99%), are favorable, yet valuation multiples such as price-to-earnings (141.58) and price-to-book (16.4) are unfavorable, combining for a slightly unfavorable overall ratio evaluation.
Shareholder Return Policy
Arm Holdings plc does not currently pay dividends, with a dividend payout ratio and yield at zero across recent fiscal years. This absence likely reflects a reinvestment strategy aligned with growth priorities, supported by strong profit margins and free cash flow generation.
The company does not engage in share buybacks either, emphasizing a focus on capital retention and reinvestment. This approach appears consistent with sustainable long-term value creation, prioritizing growth over immediate shareholder distributions.
Score analysis
The following radar chart presents an overview of key financial scores reflecting Arm Holdings plc’s valuation and performance metrics:
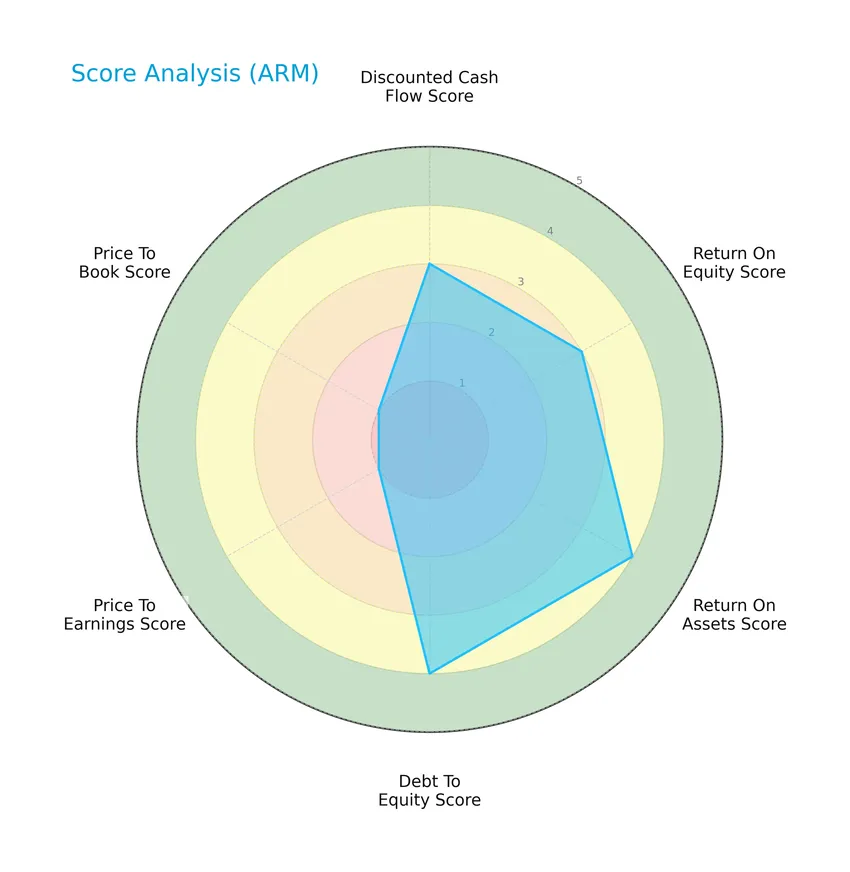
Arm Holdings plc shows moderate scores for discounted cash flow and return on equity at 3 each, with favorable returns on assets and debt-to-equity scores of 4. However, valuation metrics like price-to-earnings and price-to-book ratios score very unfavorably at 1, indicating potential market pricing concerns.
Analysis of the company’s bankruptcy risk
The Altman Z-Score places Arm Holdings plc well within the safe zone, indicating a very low risk of bankruptcy currently:

Is the company in good financial health?
The Piotroski Score diagram illustrates the financial strength of Arm Holdings plc based on nine accounting criteria:

With a strong Piotroski Score of 7, Arm Holdings plc demonstrates solid financial health, suggesting effective management of profitability, leverage, and operational efficiency.
Competitive Landscape & Sector Positioning
This sector analysis will explore Arm Holdings plc’s strategic positioning, revenue by segment, key products, main competitors, and competitive advantages. I will assess whether the company holds a competitive edge over its peers in the semiconductor industry.
Strategic Positioning
Arm Holdings plc maintains a focused product portfolio centered on CPU architectures, IPs, and related technologies for semiconductors, serving diverse markets including automotive and IoT. Geographically, it has a broad exposure with significant revenue from the United States (1.72B), China (749M), Taiwan (629M), South Korea (324M), and other countries (589M) in FY2025.
Revenue by Segment
The pie chart displays Arm Holdings plc’s revenue distribution by segment for fiscal years 2024 and 2025, highlighting the relative contributions of License and Other Revenue and Royalty streams.
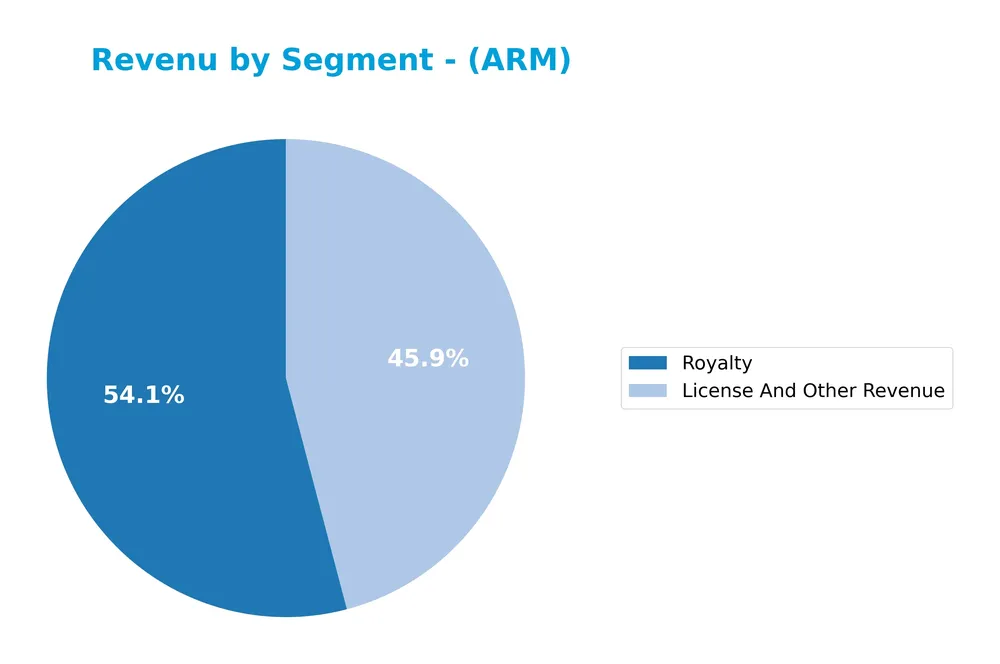
In 2025, Arm’s revenue was driven primarily by Royalty income at 2.17B, up from 1.80B in 2024, indicating strong growth in usage-based earnings. License and Other Revenue also increased significantly to 1.84B from 1.43B, showing solid expansion in upfront and ancillary revenues. The company’s revenue mix remains balanced between these two segments, with both contributing to overall growth and no apparent concentration risk.
Key Products & Brands
The table below outlines Arm Holdings plc’s principal products and revenue segments:
| Product | Description |
|---|---|
| Microprocessors | Central processing units designed and licensed to semiconductor companies and original equipment manufacturers. |
| Systems Intellectual Property (IPs) | Includes physical IP and associated systems IPs used in semiconductor design and development. |
| Graphics Processing Units (GPUs) | Specialized processors for rendering graphics in various computing applications. |
| Software and Tools | Development software and tools supporting semiconductor and system design. |
| License And Other Revenue | Income from licensing technology and related services, totaling $1.84B in fiscal 2025. |
| Royalty | Revenue generated from royalties on products using Arm’s technology, amounting to $2.17B in fiscal 2025. |
Arm Holdings plc generates revenue primarily through licensing and royalties on its semiconductor technologies, including microprocessors, system IPs, and GPUs. The company also provides software tools supporting hardware development.
Main Competitors
There are 38 competitors in the Technology sector’s Semiconductors industry, with the table below listing the top 10 leaders by market capitalization:
| Competitor | Market Cap. |
|---|---|
| NVIDIA Corporation | 4.6T |
| Broadcom Inc. | 1.6T |
| Taiwan Semiconductor Manufacturing Company Limited | 1.6T |
| ASML Holding N.V. | 415B |
| Advanced Micro Devices, Inc. | 363B |
| Micron Technology, Inc. | 353B |
| Lam Research Corporation | 232B |
| Applied Materials, Inc. | 214B |
| QUALCOMM Incorporated | 185B |
| Intel Corporation | 173B |
Arm Holdings plc American Depositary Shares ranks 14th among 38 competitors, with a market cap approximately 2.68% that of the leader, NVIDIA Corporation. The company is positioned below the average market cap of the top 10 competitors (974.8B) but remains above the sector median market cap of 30.7B. It maintains a +9.89% market cap gap from its closest competitor above.
Comparisons with competitors
Check out how we compare the company to its competitors:
Does ARM have a competitive advantage?
Arm Holdings plc does not present a competitive advantage based on its economic moat evaluation, as its return on invested capital (ROIC) is significantly below its weighted average cost of capital (WACC), indicating value destruction. The company’s ROIC trend remains neutral, reflecting stable profitability but an overall unfavorable moat status.
Looking ahead, Arm’s growth is supported by expanding revenues across key markets including the United States, China, Taiwan, and South Korea. The company also benefits from its broad product portfolio in semiconductors, microprocessors, and systems IPs, which positions it to capitalize on opportunities in automotive, computing infrastructure, consumer technologies, and the Internet of Things.
SWOT Analysis
This SWOT analysis highlights the key internal and external factors impacting Arm Holdings plc to guide strategic investment decisions.
Strengths
- Strong revenue growth at 23.94% YoY
- High gross margin of 94.86%
- Diverse global market presence including US and Asia
Weaknesses
- Very high valuation with PE ratio of 141.58
- Low ROIC at 10.28% below WACC
- Limited dividend yield at 0%
Opportunities
- Expansion in automotive and IoT markets
- Increasing demand for semiconductor IP globally
- Growth potential in emerging markets like China and Taiwan
Threats
- Intense competition in semiconductor industry
- Geopolitical risks affecting supply chains
- High beta of 4.36 indicating stock volatility
Arm Holdings shows robust growth and strong profitability but faces valuation and capital efficiency challenges. Strategic focus on leveraging market opportunities while managing geopolitical and competitive risks is essential to sustain value creation.
Stock Price Action Analysis
The weekly stock price chart for Arm Holdings plc American Depositary Shares (ticker: ARM) over the past 12 months shows significant fluctuations and a clear downward trajectory:

Trend Analysis
Over the past 12 months, ARM’s stock price declined by 18.04%, indicating a bearish trend. The trend shows deceleration with a high volatility level, evidenced by a standard deviation of 19.4. The stock fluctuated between a high of 181.19 and a low of 87.19, confirming sustained downward pressure.
Volume Analysis
In the last three months, trading volumes have been decreasing overall. Seller-driven activity dominates, with sellers accounting for 70% of volume. This suggests weakened buyer interest and a cautious or negative investor sentiment amid declining market participation.
Target Prices
The consensus target prices for Arm Holdings plc indicate a bullish outlook from analysts.
| Target High | Target Low | Consensus |
|---|---|---|
| 190 | 120 | 154 |
Analysts expect Arm’s share price to reach around 154 on average, with a high target of 190 and a low of 120, reflecting moderate optimism tempered by some caution.

Don’t Let Luck Decide Your Entry Point
Optimize your entry points with our advanced ProRealTime indicators. You’ll get efficient buy signals with precise price targets for maximum performance. Start outperforming now!
Analyst & Consumer Opinions
This section examines the ratings and feedback provided by analysts and consumers concerning Arm Holdings plc American Depositary Shares (ARM).
Stock Grades
Here are the latest verified stock grades for Arm Holdings plc American Depositary Shares from recognized financial institutions:
| Grading Company | Action | New Grade | Date |
|---|---|---|---|
| Morgan Stanley | Maintain | Overweight | 2026-01-23 |
| Susquehanna | Upgrade | Positive | 2026-01-21 |
| B of A Securities | Downgrade | Neutral | 2026-01-13 |
| B of A Securities | Maintain | Buy | 2025-12-16 |
| Goldman Sachs | Downgrade | Sell | 2025-12-15 |
| Loop Capital | Maintain | Buy | 2025-11-12 |
| Needham | Maintain | Hold | 2025-11-06 |
| UBS | Maintain | Buy | 2025-11-06 |
| Mizuho | Maintain | Outperform | 2025-11-06 |
| Barclays | Maintain | Overweight | 2025-11-06 |
The overall grading trend shows a mix of stable positive ratings and some recent downgrades reflecting cautious sentiment. Most firms maintain Buy or Overweight ratings, while a few have lowered their outlook to Neutral or Sell, indicating varied analyst perspectives.
Consumer Opinions
Consumers of Arm Holdings plc American Depositary Shares (ARM) generally appreciate the company’s innovation and product reliability, though some express concerns about pricing and customer support.
| Positive Reviews | Negative Reviews |
|---|---|
| “Arm’s chips deliver excellent performance and energy efficiency.” | “Customer service response times could be improved.” |
| “Innovative technology that powers many devices I use daily.” | “Products are sometimes priced higher than competitors.” |
| “Strong ecosystem and developer support make integration smooth.” | “Limited availability of certain chip models in some regions.” |
Overall, consumers praise ARM’s technological leadership and product efficiency but note challenges in customer support and pricing competitiveness as areas for improvement.
Risk Analysis
Below is a summary table outlining the key risk factors associated with investing in Arm Holdings plc American Depositary Shares (ARM):
| Category | Description | Probability | Impact |
|---|---|---|---|
| Valuation Risk | Extremely high P/E (141.58) and P/B (16.4) ratios indicate overvaluation. | High | High |
| Market Volatility | Beta of 4.363 suggests significant stock price fluctuations and risk. | High | High |
| Profitability | Moderate ROE (11.58%) and unfavorable ROIC (10.28%) may constrain growth. | Medium | Medium |
| Industry Exposure | Semiconductor sector cyclicality and geopolitical tensions in Asia markets. | Medium | High |
| Dividend Policy | No dividend yield, limiting income for yield-focused investors. | High | Low |
| Financial Health | Strong Altman Z-Score (31.1) and Piotroski Score (7) indicate stability. | Low | Low |
| Liquidity | Current ratio high (5.2) but flagged as unfavorable, could signal inefficiency. | Medium | Medium |
The most pressing risks are valuation and market volatility due to ARM’s very high price multiples and elevated beta. Additionally, semiconductor industry cyclicality and geopolitical challenges in key Asian markets remain impactful. Despite these, ARM’s strong financial health metrics provide some risk mitigation. I advise careful monitoring of market conditions and valuation trends before investing.
Should You Buy Arm Holdings plc American Depositary Shares?
Arm Holdings plc appears to be characterized by improving profitability and a manageable leverage profile, supported by a strong liquidity position. Despite an unfavorable moat suggesting value erosion, the company’s overall rating of B and solid financial strength scores indicate a moderate yet potentially resilient investment profile.
Strength & Efficiency Pillars
Arm Holdings plc American Depositary Shares exhibits strong profitability with a net margin of 19.77% and an EBIT margin of 17.97%, supported by a robust gross margin of 94.86%. The company maintains a conservative capital structure, reflected in a low debt-to-equity ratio of 0.05 and a very favorable interest coverage ratio. Its Altman Z-Score at 31.10 places it comfortably in the safe zone, while a Piotroski score of 7 indicates strong financial health. Although ROIC at 10.28% is below the WACC of 24.37%, signaling value destruction, the overall financial health and profitability metrics affirm operational efficiency.
Weaknesses and Drawbacks
Arm Holdings faces significant valuation headwinds, with a price-to-earnings ratio of 141.58 and a price-to-book ratio of 16.4, both flagged as very unfavorable and indicative of a highly premium market pricing that may limit upside. The current ratio is elevated at 5.2, which, despite suggesting liquidity, could imply inefficient asset use or excess working capital. Market pressure is tangible, as recent trading shows seller dominance with only 30.15% buyer volume, pushing the stock price down by 23.83% over the last quarter, reflecting short-term bearish sentiment and volatility.
Our Verdict about Arm Holdings plc American Depositary Shares
The company’s long-term fundamental profile is moderately favorable, supported by strong profitability and financial health scores but tempered by valuation concerns and value destruction at the capital allocation level. Despite the fundamental strength, recent market behavior is seller dominant, suggesting a cautious stance. Therefore, Arm Holdings may appear attractive for investors with a high risk tolerance but could warrant a wait-and-see approach for a more favorable entry point amid current market pressures.
Disclaimer: This content is for informational purposes only and does not constitute financial, investment, or other professional advice. Investing in financial markets involves a significant risk of loss, and past performance is not indicative of future results.
Additional Resources
- Pacific Heights Asset Management LLC Has $26.18 Million Stock Holdings in ARM Holdings PLC Sponsored ADR $ARM – MarketBeat (Jan 20, 2026)
- ARM Holdings (ARM) Stock: 8% Jump Fueled by AI Chip Strategy and Analyst Upgrade – Blockonomi (Jan 22, 2026)
- Arm Holdings (ARM) stock price ticks up into MLK Day shutdown as traders look to Feb. 4 earnings – TechStock² (Jan 18, 2026)
- AI for investors – MLQ.ai (Oct 10, 2025)
- 43,952 Shares in ARM Holdings PLC Sponsored ADR $ARM Acquired by Stanley Laman Group Ltd. – MarketBeat (Jan 05, 2026)
For more information about Arm Holdings plc American Depositary Shares, please visit the official website: arm.com