Home > Analyses > Technology > Arista Networks, Inc.
Arista Networks powers the backbone of modern cloud infrastructure, enabling seamless data flow across global networks. Its cutting-edge Ethernet switching and routing platforms are indispensable to internet giants, financial firms, and government agencies alike. Known for innovation and robust performance, Arista sets the standard in cloud networking hardware. As the sector evolves rapidly, I ask: does Arista’s strong market position still translate into compelling investment value in 2026?

Table of contents
Business Model & Company Overview
Arista Networks, Inc., founded in 2004 and headquartered in Santa Clara, California, commands a leading position in the computer hardware sector. Its core mission revolves around delivering a unified cloud networking ecosystem, combining extensible operating systems with high-performance Ethernet switching and routing platforms. Arista’s solutions cater to diverse industries, including internet companies, financial services, and government agencies, reflecting its broad industrial footprint.
The company’s revenue engine balances hardware sales with software and post-contract support services across the Americas, Europe, the Middle East, Africa, and Asia-Pacific. Its global reach is amplified by a diverse sales network of distributors, value-added resellers, and direct sales teams. Arista’s competitive advantage lies in its ability to integrate scalable cloud networking with technical support, forming a robust economic moat in a rapidly evolving industry.
Financial Performance & Fundamental Metrics
I analyze Arista Networks, Inc.’s income statement, key financial ratios, and dividend payout policy to reveal its operational strength and capital allocation discipline.
Income Statement
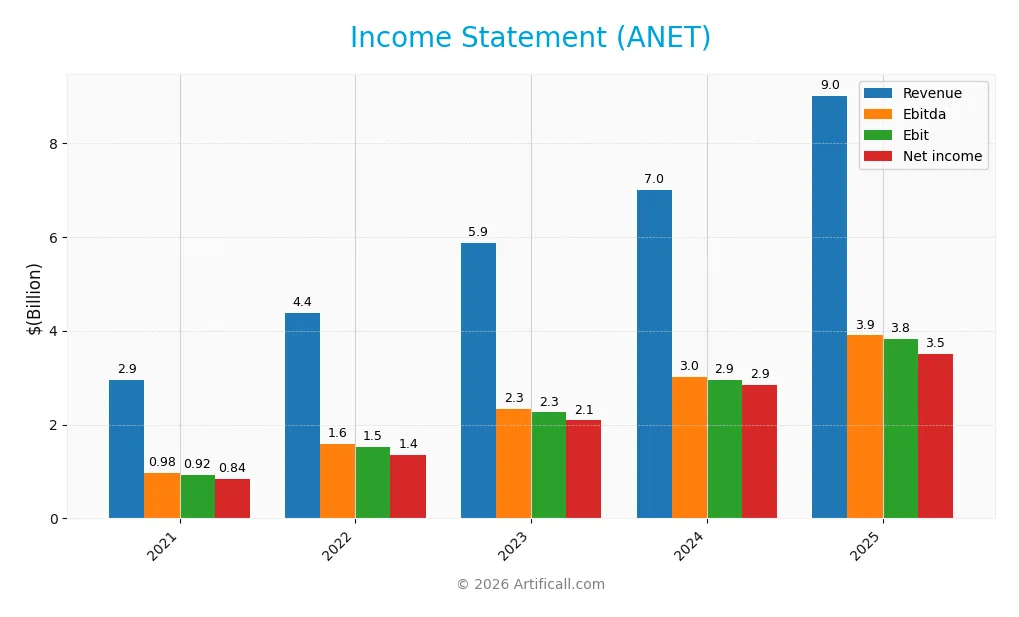
The table below summarizes Arista Networks, Inc.’s key income statement figures from 2021 to 2025, highlighting revenue growth and profitability trends.
| 2021 | 2022 | 2023 | 2024 | 2025 | |
|---|---|---|---|---|---|
| Revenue | 2.95B | 4.38B | 5.86B | 7.00B | 9.01B |
| Cost of Revenue | 1.07B | 1.71B | 2.23B | 2.51B | 3.27B |
| Operating Expenses | 956M | 1.15B | 1.37B | 1.55B | 1.91B |
| Gross Profit | 1.88B | 2.68B | 3.63B | 4.49B | 5.74B |
| EBITDA | 975M | 1.59B | 2.33B | 3.01B | 3.90B |
| EBIT | 925M | 1.53B | 2.26B | 2.94B | 3.83B |
| Interest Expense | 0 | 0 | 0 | 0 | 0 |
| Net Income | 841M | 1.35B | 2.09B | 2.85B | 3.51B |
| EPS | 0.69 | 1.10 | 1.69 | 2.27 | 2.79 |
| Filing Date | 2022-02-15 | 2023-02-14 | 2024-02-13 | 2025-02-19 | 2026-02-17 |
Income Statement Evolution
From 2021 to 2025, Arista Networks’ revenue soared 205%, reaching $9B in 2025. Net income surged 318% to $3.5B, reflecting strong operational leverage. Gross margin stabilized near 64%, while EBIT margin held firm above 42%, demonstrating consistent profitability despite rapid growth. Margins improved overall, signaling efficient cost control and scaling.
Is the Income Statement Favorable?
In 2025, Arista Networks posted solid fundamentals with a 38.99% net margin and no interest expense, underscoring financial strength. Revenue and EBIT growth of nearly 29% and 30% respectively highlight robust operational performance. However, a slight 4.26% dip in net margin growth signals margin pressure that warrants monitoring, though the overall income statement remains favorable.
Financial Ratios
The following table summarizes key financial ratios for Arista Networks, Inc. from 2021 to 2025, providing insight into profitability, valuation, liquidity, leverage, efficiency, and dividend metrics:
| Ratios | 2021 | 2022 | 2023 | 2024 | 2025 |
|---|---|---|---|---|---|
| Net Margin | 28.5% | 30.9% | 35.6% | 40.7% | 39.0% |
| ROE | 21.1% | 27.7% | 28.9% | 28.5% | 28.4% |
| ROIC | 18.1% | 23.8% | 24.2% | 22.7% | 22.5% |
| P/E | 52.4 | 27.5 | 34.9 | 48.7 | 46.9 |
| P/B | 11.1 | 7.6 | 10.1 | 13.9 | 13.3 |
| Current Ratio | 4.3 | 4.3 | 4.4 | 4.4 | 3.0 |
| Quick Ratio | 3.8 | 3.3 | 3.4 | 3.7 | 2.6 |
| D/E | 0.01 | 0.01 | 0.00 | 0.00 | 0.00 |
| Debt-to-Assets | 1.0% | 0.6% | 0.0% | 0.0% | 0.0% |
| Interest Coverage | 0 | 0 | 0 | 0 | 0 |
| Asset Turnover | 0.51 | 0.65 | 0.59 | 0.50 | 0.46 |
| Fixed Asset Turnover | 20.5 | 46.1 | 57.7 | 70.8 | 44.3 |
| Dividend Yield | 0% | 0% | 0% | 0% | 0% |
Evolution of Financial Ratios
Arista Networks’ Return on Equity remained strong, fluctuating around 28%, indicating stable and efficient profitability. The Current Ratio declined from around 4.3 to 3.05, showing reduced short-term liquidity but still above 1. Debt-to-Equity Ratio consistently stayed at zero, reflecting no reliance on debt financing and a conservative capital structure.
Are the Financial Ratios Fovorable?
In 2025, profitability ratios like net margin (39%) and ROE (28%) were favorable, highlighting efficient operations. The zero debt levels and high interest coverage signal low financial risk. However, valuation multiples such as PE (47) and PB (13.3) are elevated, suggesting high market expectations. Liquidity shows mixed signals: quick ratio is strong (2.63), but current ratio is less favorable (3.05). Asset turnover is relatively low (0.46), indicating moderate operational efficiency. Overall, the financial ratios lean toward a favorable assessment.
Shareholder Return Policy
Arista Networks, Inc. does not pay dividends, reflecting its reinvestment strategy during a high growth phase. The company maintains zero dividend payout ratio and yield, focusing capital allocation on expanding operations and innovation rather than immediate shareholder distributions.
Despite no dividends, Arista engages in share buybacks, supporting shareholder value through capital returns. This approach aligns with sustainable long-term growth, as the company preserves cash flow for reinvestment while selectively repurchasing shares to enhance equity value.
Score analysis
The following radar chart visualizes Arista Networks, Inc.’s key financial scores across valuation and profitability metrics:
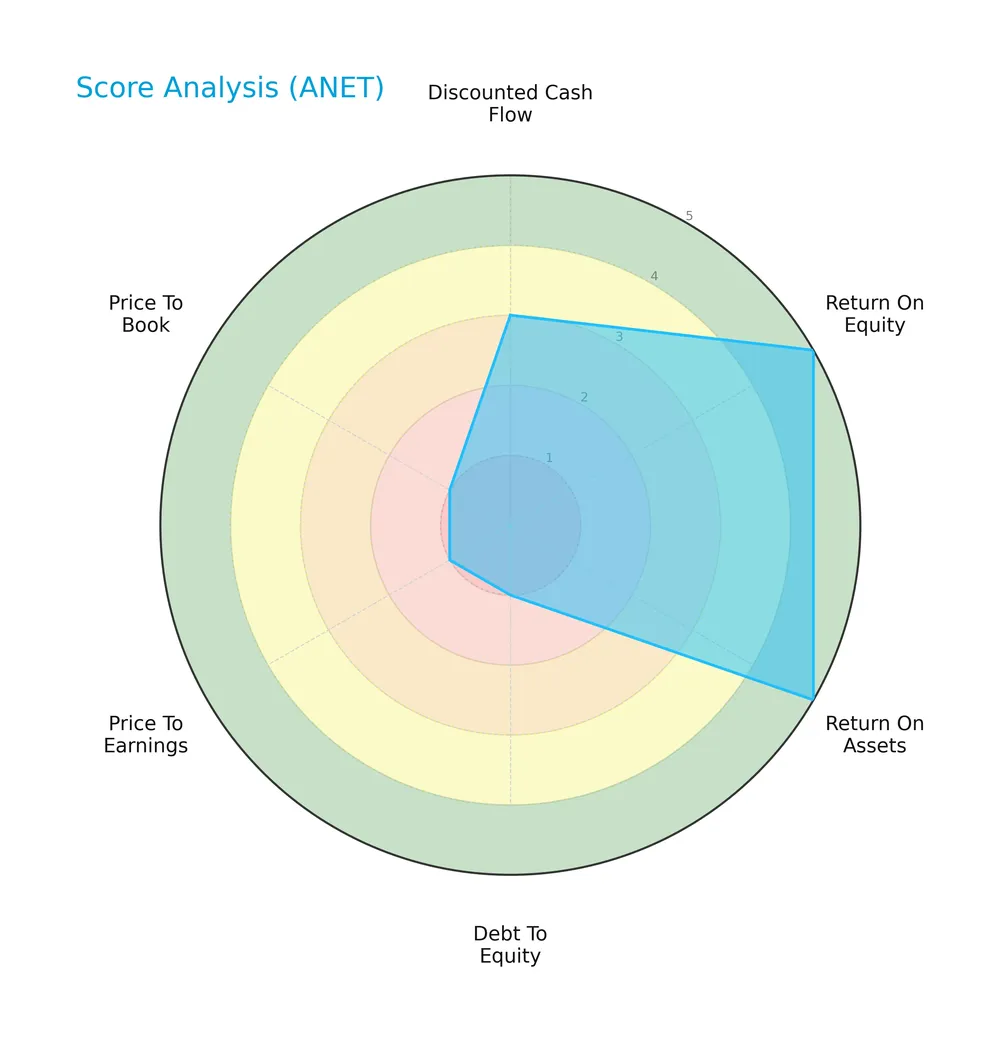
Arista shows strong returns with very favorable ROE and ROA scores of 5 each. However, valuation indicators like PE and PB scores stand at 1, signaling very unfavorable pricing. The debt-to-equity score is also low at 1, indicating high leverage risk.
Analysis of the company’s bankruptcy risk
The Altman Z-Score places Arista Networks well within the safe zone, indicating a low risk of bankruptcy:

Is the company in good financial health?
This Piotroski diagram illustrates Arista Networks’ moderate financial health with a mid-range score:

With a Piotroski Score of 5, Arista exhibits average financial strength, balancing profitability and efficiency with some areas needing improvement.
Competitive Landscape & Sector Positioning
This sector analysis reviews Arista Networks, Inc.’s strategic positioning, revenue segments, products, competitors, and strengths. I will assess whether Arista holds a competitive advantage over its main rivals.
Strategic Positioning
Arista Networks concentrates its portfolio on cloud networking hardware and services, with products generating $7.6B and services $1.4B in 2025. Geographically, it leans heavily on the Americas, which accounted for $7.1B, while Asia Pacific and EMEA contribute $813M and $1.1B respectively.
Revenue by Segment
This pie chart displays Arista Networks, Inc.’s revenue breakdown by product and service segments for fiscal year 2025.
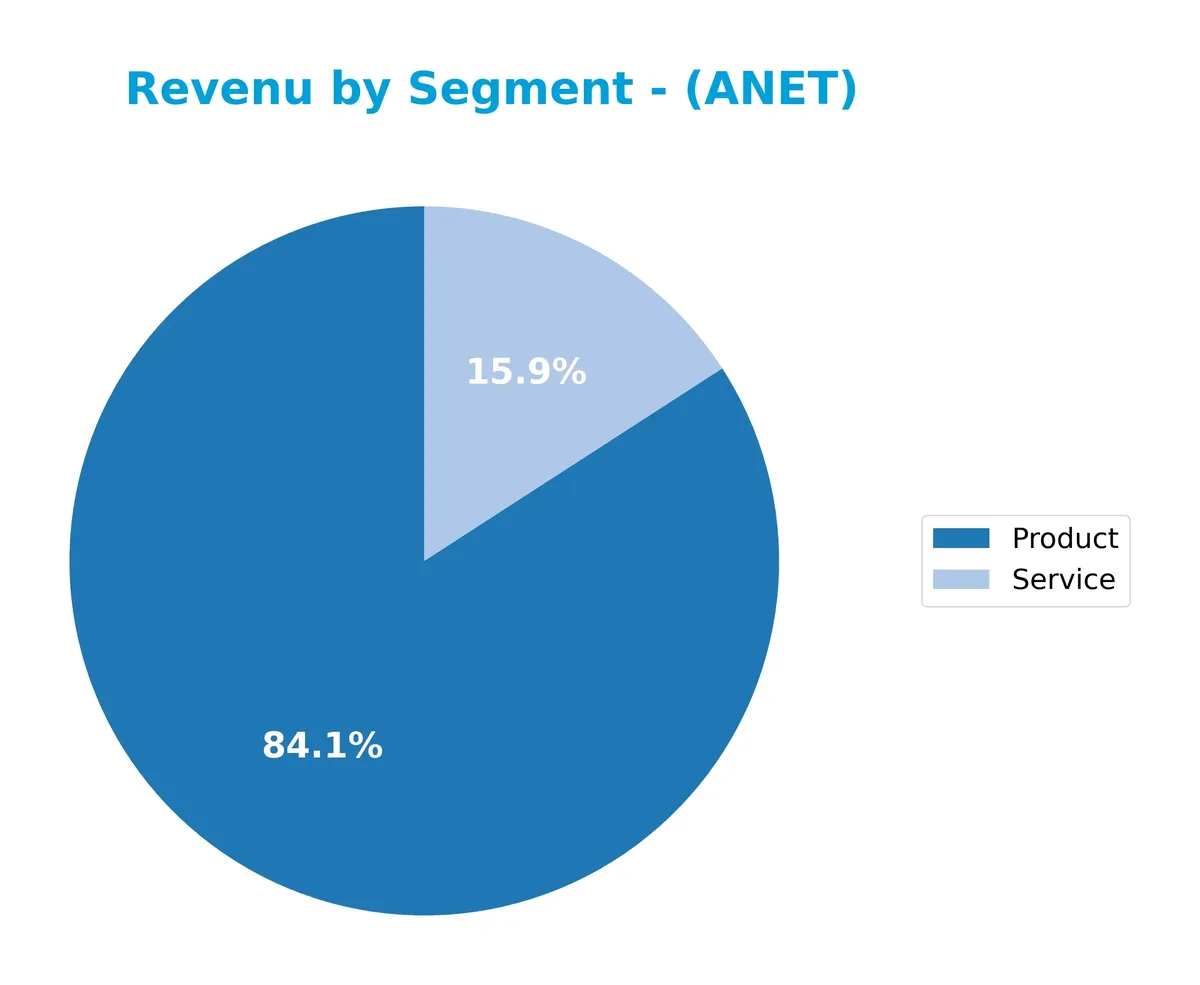
Arista’s revenue is heavily driven by its Product segment, which reached $7.6B in 2025, showing strong acceleration compared to $5B in 2023. The Service segment grew more modestly to $1.4B, reflecting steady expansion. This concentration in Products highlights Arista’s core competitive moat, yet investors should watch for potential risks if service revenue does not diversify further. Overall, the business demonstrates robust growth with a clear product dominance.
Key Products & Brands
Arista Networks’ portfolio centers on cloud networking products and services generating significant revenue:
| Product | Description |
|---|---|
| Cloud Networking Products | Extensible operating systems, network applications, and gigabit Ethernet switching and routing platforms. |
| Customer Support Services | Post-contract technical support, hardware repair, parts replacement, bug fixes, patches, and upgrades. |
Arista’s key offerings combine hardware and software solutions tailored for large-scale cloud networking. Products dominate revenue, reflecting strong market demand, while services enhance customer retention and lifecycle value.
Main Competitors
Arista Networks, Inc. operates in a competitive field with 12 companies; here are the top 10 leaders by market capitalization:
| Competitor | Market Cap. |
|---|---|
| Arista Networks, Inc. | 168B |
| Dell Technologies Inc. | 86B |
| Western Digital Corporation | 65B |
| Seagate Technology Holdings | 61B |
| Pure Storage, Inc. | 22B |
| NetApp, Inc. | 21B |
| HP Inc. | 21B |
| Super Micro Computer, Inc. | 18B |
| IonQ, Inc. | 16B |
| D-Wave Quantum Inc. | 9B |
Arista Networks ranks 1st among its peers, with a market cap 7% above the top player benchmark. It stands well above both the average market cap of the top 10 (48.7B) and the sector median (21B). The gap to the next competitor, Dell Technologies, is significant, highlighting Arista’s dominant market position.
Comparisons with competitors
Check out how we compare the company to its competitors:
Does ANET have a competitive advantage?
Arista Networks demonstrates a very favorable competitive advantage, consistently creating value with a ROIC 12% above WACC and a growing ROIC trend. Its profitability and efficient capital use confirm a sustainable economic moat.
Looking ahead, ANET’s expansion into diverse global markets and continued innovation in cloud networking solutions position it well for future growth. The company targets opportunities in Asia-Pacific and EMEA, supported by its strong product portfolio and customer support services.
SWOT Analysis
This SWOT analysis highlights Arista Networks’ key internal and external factors shaping its strategic positioning in 2026.
Strengths
- strong 38.99% net margin
- growing ROIC at 22.46%, well above WACC
- zero debt and infinite interest coverage
Weaknesses
- high valuation with 46.94 PE and 13.32 PB ratios
- modest asset turnover at 0.46
- no dividend yield limits income appeal
Opportunities
- expanding cloud networking demand
- geographic growth in Asia-Pacific and EMEA
- innovation in network applications and platforms
Threats
- intense competition in cloud hardware
- rising valuation risks
- global supply chain and regulatory uncertainties
Arista’s solid profitability and moat support sustained growth. However, stretched valuation and moderate asset efficiency require caution. Strategic focus on innovation and market expansion must offset competitive and macro risks.
Stock Price Action Analysis
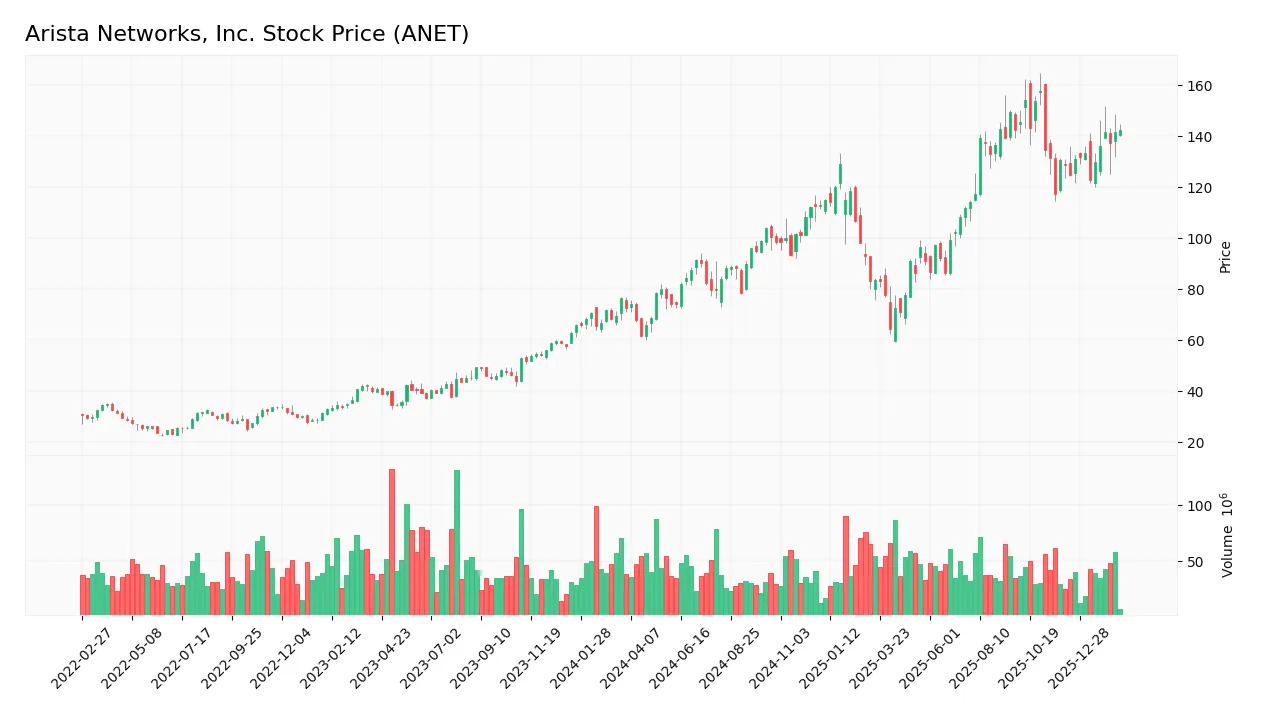
The weekly stock chart illustrates Arista Networks, Inc.’s price movements over the past 12 months, highlighting key fluctuations and trend shifts:
Trend Analysis
Over the past 12 months, Arista Networks, Inc. stock rose 96.66%, signaling a bullish trend. The price accelerated with a high volatility of 24.89. The highest price reached 157.69, the lowest was 61.52. Recent three-month growth of 10.88% confirms sustained positive momentum.
Volume Analysis
Trading volume shows an increasing trend with 5.1B total shares traded. Buyers dominate 56.34% overall, rising to 62.79% in the recent period, indicating strong buyer-driven activity and heightened investor confidence. Seller volume remains significantly lower, reinforcing positive market participation.
Target Prices
Analysts project a solid upside for Arista Networks, reflecting confidence in its growth trajectory.
| Target Low | Target High | Consensus |
|---|---|---|
| 165 | 200 | 180.44 |
The target range suggests a robust appreciation potential, with consensus firmly above current trading levels. This aligns with Arista’s strong market position and innovation-driven moat.

Don’t Let Luck Decide Your Entry Point
Optimize your entry points with our advanced ProRealTime indicators. You’ll get efficient buy signals with precise price targets for maximum performance. Start outperforming now!
Analyst & Consumer Opinions
This section examines Arista Networks, Inc.’s analyst ratings alongside consumer feedback to provide a balanced perspective.
Stock Grades
Here are the latest verified analyst grades for Arista Networks, Inc., reflecting current market sentiment:
| Grading Company | Action | New Grade | Date |
|---|---|---|---|
| Goldman Sachs | Maintain | Buy | 2026-02-13 |
| Barclays | Maintain | Overweight | 2026-02-13 |
| Piper Sandler | Maintain | Overweight | 2026-02-13 |
| Evercore ISI Group | Maintain | Outperform | 2026-02-13 |
| Wells Fargo | Maintain | Overweight | 2026-02-13 |
| Rosenblatt | Maintain | Neutral | 2026-02-13 |
| Needham | Maintain | Buy | 2026-02-13 |
| Keybanc | Maintain | Overweight | 2026-02-13 |
| Rosenblatt | Maintain | Neutral | 2026-02-10 |
| Piper Sandler | Upgrade | Overweight | 2026-01-05 |
The consensus across these reputable firms leans strongly toward a Buy or Overweight stance, with no Sell ratings. Rosenblatt’s Neutral grades suggest some caution, but the overall trend favors optimism on Arista Networks’ outlook.
Consumer Opinions
Arista Networks inspires mixed reactions, reflecting its cutting-edge technology alongside some usability challenges.
| Positive Reviews | Negative Reviews |
|---|---|
| High-performance networking gear. | Complex setup for non-experts. |
| Reliable and low-latency connections. | Customer support can be slow to respond. |
| Scalable solutions fit growing needs. | Pricing is on the higher side. |
Consumers consistently praise Arista’s robust and scalable products, yet often cite complexity and cost as barriers. This signals strong technical appeal but room for improving user experience and support responsiveness.
Risk Analysis
Below is a table summarizing key risks for Arista Networks, Inc., including their likelihood and potential impact:
| Category | Description | Probability | Impact |
|---|---|---|---|
| Valuation Risk | Elevated PE (46.94) and PB (13.32) ratios may signal overvaluation. | High | High |
| Market Volatility | Beta of 1.444 indicates higher stock price sensitivity to market swings. | High | Medium |
| Liquidity Risk | Current ratio at 3.05 flagged as unfavorable, despite seeming healthy. | Medium | Medium |
| Competitive Risk | Intense competition in cloud networking could pressure margins. | Medium | High |
| Dividend Policy | No dividend yield may deter income-focused investors. | Low | Low |
The most pressing risks stem from Arista’s lofty valuation multiples and market volatility. Its PE and PB ratios notably exceed sector averages, raising concerns about price sustainability. Meanwhile, a beta above 1.4 suggests the stock will swing more than the market, increasing volatility risk. Despite a strong Altman Z-Score placing it safely out of bankruptcy danger, investors must remain cautious of valuation and market-driven fluctuations.
Should You Buy Arista Networks, Inc.?
Arista Networks appears to be a robust value creator with a very favorable competitive moat supported by growing ROIC well above WACC. Despite a manageable leverage profile, the overall B rating suggests moderate investment appeal tempered by some valuation concerns.
Strength & Efficiency Pillars
Arista Networks, Inc. delivers robust profitability with a net margin of 38.99% and a return on equity (ROE) of 28.39%. The return on invested capital (ROIC) at 22.46% significantly exceeds the weighted average cost of capital (WACC) of 10.45%, confirming the company as a clear value creator. This positive spread underscores a sustainable competitive advantage, supported by growing ROIC trends. Operational efficiency shines through a strong gross margin of 63.71% and an EBIT margin of 42.48%, reflecting superior cost control and pricing power.
Weaknesses and Drawbacks
Despite solid fundamentals, Arista faces notable valuation risks. The price-to-earnings ratio stands elevated at 46.94, indicating a premium that may pressure future returns. Price-to-book at 13.32 further suggests overvaluation relative to book value. While the current ratio is strong at 3.05, its “unfavorable” status may reflect working capital inefficiencies or excess liquidity not deployed optimally. The asset turnover ratio of 0.46 flags potential underutilization of assets. These factors require cautious consideration amid the bullish market backdrop.
Our Final Verdict about Arista Networks, Inc.
Arista Networks presents a fundamentally strong profile with significant value creation and operational excellence. The stock’s bullish trend and buyer dominance over recent months may support continued momentum. However, premium valuation multiples and some asset efficiency concerns advise a measured approach. Investors might consider waiting for a more favorable entry point despite the company’s attractive long-term prospects. The overall risk-reward balance suggests the stock may appear suitable for those with a growth orientation.
Disclaimer: This content is for informational purposes only and does not constitute financial, investment, or other professional advice. Investing in financial markets involves a significant risk of loss, and past performance is not indicative of future results.
Additional Resources
- Arista Networks: Expect Growth To Pick Up In The Second Half Of 2026 (NYSE:ANET) – Seeking Alpha (Feb 17, 2026)
- AI network vendor Arista tops $1B in quarterly profit as 2025 revenue hits $9B – Stock Titan (Feb 12, 2026)
- Should ANET Stock Be Added to Your Portfolio Post Record Q4 Earnings? – The Globe and Mail (Feb 17, 2026)
- Arista Networks Inc (ANET) Strengthens Position in AI Networking – Insider Monkey (Feb 16, 2026)
- Arista Networks (ANET) Beats Q4 Earnings and Revenue Estimates – Yahoo Finance (Feb 12, 2026)
For more information about Arista Networks, Inc., please visit the official website: arista.com