Home > Analyses > Financial Services > Ares Management Corporation
Ares Management Corporation transforms capital into opportunity across global markets. It excels in alternative asset management, shaping credit, private equity, and real estate landscapes. Known for its strategic control investments and innovative financing, Ares commands respect among institutional and retail investors alike. As it navigates complex economic cycles and competitive pressures, I ask: do Ares’ fundamentals still justify its robust market valuation and growth ambitions?

Table of contents
Business Model & Company Overview
Ares Management Corporation, founded in 1997 and based in Los Angeles, stands as a dominant alternative asset manager. It operates a cohesive ecosystem spanning credit, private equity, real estate, and direct lending. The firm integrates these segments to deliver tailored investment solutions, addressing diverse market needs with control or shared-control stakes in under-capitalized companies and commercial real estate.
The company’s revenue engine balances recurring management fees from commingled funds and separately managed accounts with performance-based income from private equity and direct lending. Ares maintains a strategic footprint across the Americas, Europe, and Asia, leveraging global market dynamics. Its economic moat derives from deep sector expertise and a multi-strategy platform that shapes the future of alternative asset management.
Financial Performance & Fundamental Metrics
I analyze Ares Management Corporation’s income statement, key financial ratios, and dividend payout policy to assess its long-term value and stability.
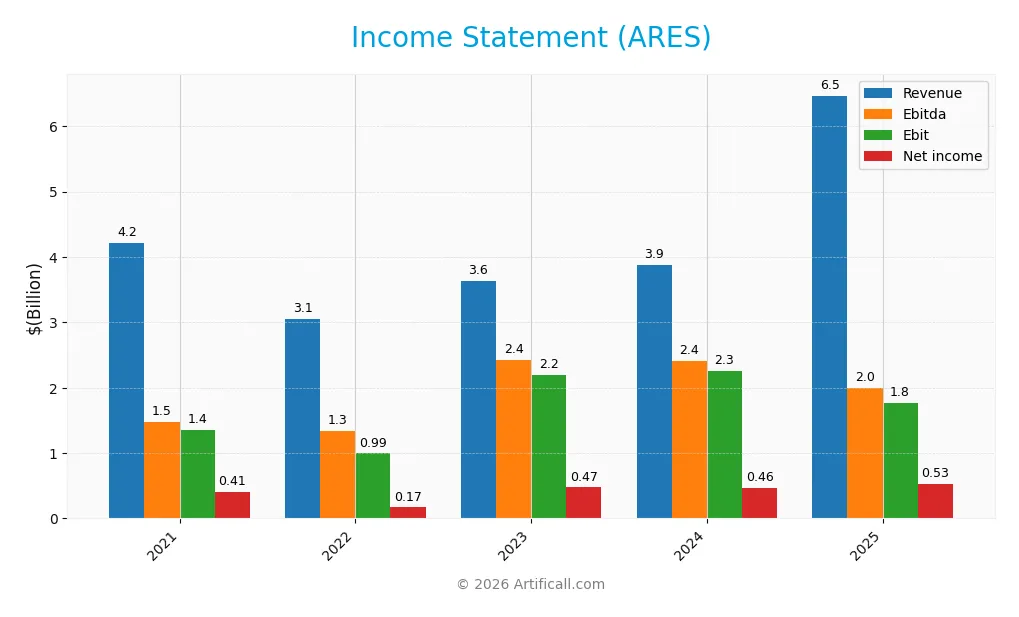
Income Statement
The table below summarizes Ares Management Corporation’s key income statement figures over the last five fiscal years, highlighting revenue, expenses, and net income trends.
| 2021 | 2022 | 2023 | 2024 | 2025 | |
|---|---|---|---|---|---|
| Revenue | 4.21B | 3.06B | 3.63B | 3.88B | 6.47B |
| Cost of Revenue | 1.16B | 1.50B | 1.49B | 1.73B | 1.63B |
| Operating Expenses | 2.25B | 1.25B | 1.31B | 1.21B | 3.08B |
| Gross Profit | 3.05B | 1.56B | 2.15B | 2.15B | 4.84B |
| EBITDA | 1.47B | 1.33B | 2.43B | 2.41B | 2.30B |
| EBIT | 1.36B | 994M | 2.19B | 2.25B | 2.05B |
| Interest Expense | 295M | 483M | 861M | 978M | 767M |
| Net Income | 409M | 168M | 474M | 464M | 527M |
| EPS | 2.25 | 0.87 | 2.46 | 2.07 | 1.96 |
| Filing Date | 2022-02-28 | 2023-02-24 | 2024-02-27 | 2025-02-27 | 2026-02-25 |
Income Statement Evolution
Ares Management Corporation’s revenue grew 54% from 2021 to 2025, showing strong top-line expansion. Net income increased nearly 29% over the period, although net margin declined by 16%, signaling margin pressure. The gross margin remained robust at 74.8%, while EBIT margin stayed favorable near 32%, despite a one-year EBIT decline of 8.8%.
Is the Income Statement Favorable?
In 2025, Ares reported revenue of $6.47B, up 67% from 2024, with gross profit growth exceeding 124%. However, operating expenses also rose proportionally, diluting EBIT which fell by 8.8% year-over-year. Interest expense at 11.9% of revenue weighs on profitability. Net margin of 8.15% is favorable, but earnings per share dropped 5.3%. Overall, the income statement reflects mixed fundamentals.
Financial Ratios
The table below presents key financial ratios for Ares Management Corporation (ARES) over the fiscal years 2021 to 2025, offering a snapshot of profitability, valuation, liquidity, leverage, efficiency, and dividend metrics:
| Ratios | 2021 | 2022 | 2023 | 2024 | 2025 |
|---|---|---|---|---|---|
| Net Margin | 9.7% | 5.5% | 13.1% | 11.9% | 8.2% |
| ROE | 22.4% | 10.5% | 25.1% | 13.1% | 6.1% |
| ROIC | 3.9% | 1.4% | 3.4% | 4.0% | 7.7% |
| P/E | 32.5 | 71.7 | 46.3 | 75.6 | 66.6 |
| P/B | 7.3 | 7.6 | 11.6 | 9.9 | 4.1 |
| Current Ratio | 0.63 | 0.64 | 0.73 | 0.98 | 0.73 |
| Quick Ratio | 0.63 | 0.64 | 0.73 | 0.98 | 0.73 |
| D/E | 6.8 | 8.4 | 8.3 | 3.7 | 0.08 |
| Debt-to-Assets | 58% | 61% | 64% | 53% | 2.3% |
| Interest Coverage | 2.7 | 0.6 | 1.0 | 1.0 | 2.3 |
| Asset Turnover | 0.19 | 0.14 | 0.15 | 0.16 | 0.23 |
| Fixed Asset Turnover | 17.6 | 13.0 | 9.8 | 5.6 | 12.5 |
| Dividend Yield | 4.5% | 7.0% | 4.7% | 3.7% | 2.8% |
Evolution of Financial Ratios
From 2021 to 2025, Ares Management’s Return on Equity (ROE) declined markedly from 22.4% to 6.1%, signaling weakening profitability. The Current Ratio remained below 1, fluctuating slightly but indicating persistent liquidity constraints. Meanwhile, the Debt-to-Equity Ratio improved significantly, dropping from over 6.8 to 0.08, reflecting a sharp reduction in leverage.
Are the Financial Ratios Favorable?
In 2025, profitability metrics such as net margin (8.15%) and ROIC (7.67%) were neutral, but ROE underperformed relative to cost of capital (WACC 11.59%), marking an unfavorable profitability outlook. Liquidity ratios (current and quick) were unfavorable at 0.73, while leverage ratios were favorable with debt-to-equity at 0.08 and debt-to-assets at 2.34%. Asset turnover was weak at 0.23, but fixed asset turnover was strong at 12.51. Dividend yield stood at a favorable 2.77%. Overall, 50% of key ratios were unfavorable, leading to a slightly unfavorable assessment.
Shareholder Return Policy
Ares Management Corporation maintains a dividend payout ratio above 100%, with a dividend yield around 2.8% in 2025 and a dividend per share of $4.48. The company supports distributions with strong free cash flow coverage and engages in share buybacks.
This high payout ratio suggests aggressive distribution relative to net income, warranting caution on sustainability. However, consistent free cash flow coverage and buybacks indicate a balanced approach to shareholder returns, potentially supporting long-term value creation.
Score analysis
The radar chart below illustrates Ares Management Corporation’s key financial scores across multiple valuation and performance metrics:
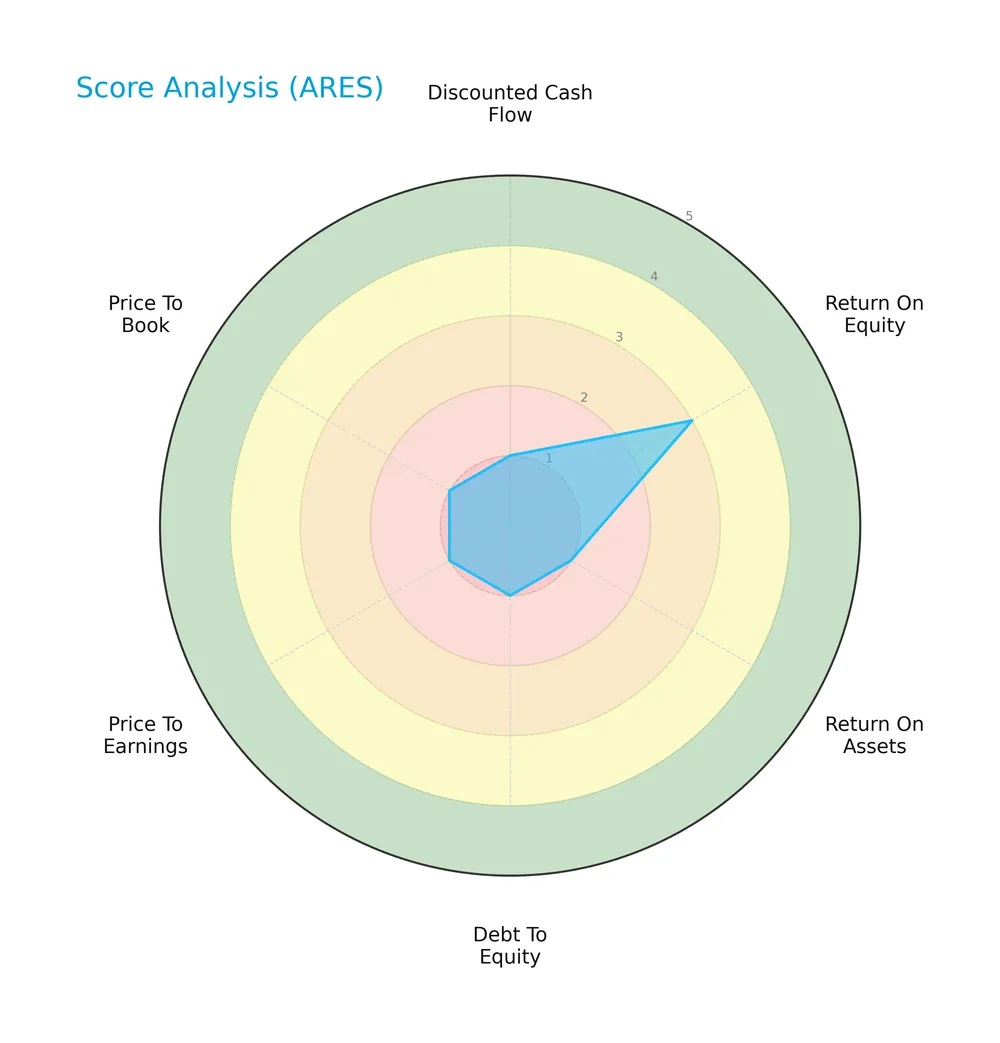
Ares scores very low on discounted cash flow, return on assets, debt to equity, price to earnings, and price to book, all rated as very unfavorable. Return on equity is slightly better but still unfavorable, reflecting overall weak financial indicators.
Analysis of the company’s bankruptcy risk
The Altman Z-Score places Ares Management Corporation deep in the distress zone, signaling a high risk of financial distress and potential bankruptcy:

Is the company in good financial health?
The Piotroski Score diagram highlights Ares Management Corporation’s financial strength using nine key criteria:

With a Piotroski Score of 7, Ares demonstrates strong financial health, indicating solid profitability, liquidity, and operational efficiency despite other weaknesses.
Competitive Landscape & Sector Positioning
This section explores Ares Management Corporation’s position within the asset management sector through strategic, product, and competitive lenses. I will assess whether Ares holds a competitive advantage over its main industry peers.
Strategic Positioning
Ares Management Corporation diversifies across alternative asset classes, including credit, private equity, direct lending, and real estate. It operates globally, with offices in the US, Europe, and Asia, reflecting a balanced geographic exposure and a multi-segment revenue model.
Revenue by Segment
This pie chart depicts Ares Management Corporation’s revenue distribution by segment for fiscal year 2025, illustrating the key drivers behind its business model.
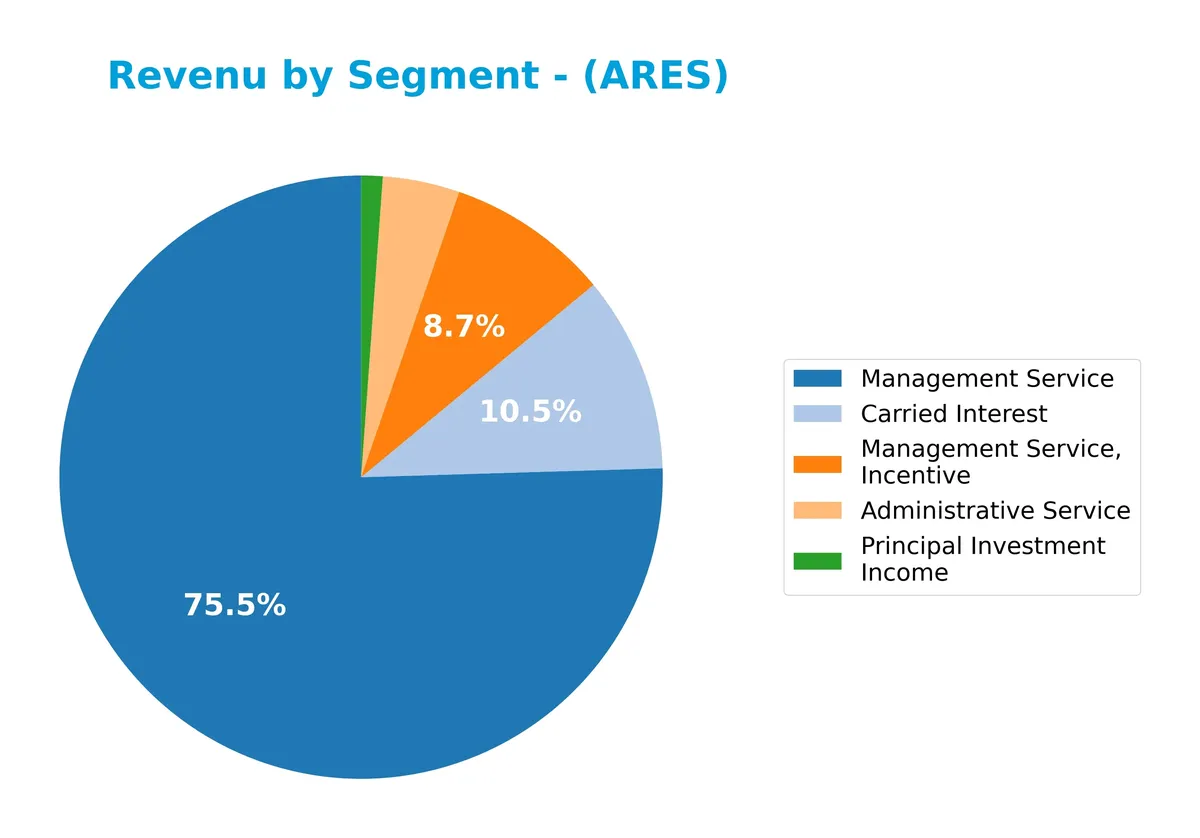
Management Service dominates with $3.7B, reflecting steady growth from prior years. Carried Interest surged to $1.2B, highlighting increased performance fees. Administrative Service and Management Service, Incentive contribute $366M and $365M respectively, showing diversification but lower scale. Principal Investment Income remains minor at $139M. The 2025 figures confirm Ares’ reliance on fee-based revenue, with notable acceleration in carried interest.
Key Products & Brands
Ares Management Corporation generates revenue from diverse asset management and investment services, detailed below:
| Product | Description |
|---|---|
| Administrative Service | Provides operational and administrative support services for investment funds and accounts. |
| Carried Interest | Earnings from profit shares in private equity and alternative investments, reflecting incentive fees. |
| Management Service | Fees earned from managing investment funds and accounts across various asset classes. |
| Management Service, Incentive | Performance-based fees earned when investment returns exceed predetermined benchmarks. |
| Principal Investment Income | Income or losses from Ares’ own capital investments in private equity, credit, and real estate assets. |
| Direct Lending Group | Financing solutions targeted at small-to-medium sized companies, focusing on middle-market lending. |
| Private Equity Group | Investments primarily in under-capitalized companies with majority or shared-control stakes. |
| Real Estate Group | Investments in new developments, asset repositioning, and financing opportunities in commercial real estate. |
| Tradable Credit Group | Management of commingled and separately managed accounts in tradable and non-investment grade credit markets. |
Ares Management Corporation’s revenue streams reflect its multi-strategy approach, spanning credit, private equity, real estate, and direct lending. The mix balances fee-based income with principal investment returns, illustrating diversified capital allocation across market cycles.
Main Competitors
This sector includes 11 competitors. The table below lists the top 10 leaders by market capitalization:
| Competitor | Market Cap. |
|---|---|
| Blackstone Inc. | 191B |
| BlackRock, Inc. | 168B |
| KKR & Co. Inc. | 115B |
| The Bank of New York Mellon Corporation | 82B |
| Ares Management Corporation | 55B |
| Ameriprise Financial, Inc. | 46B |
| State Street Corporation | 36B |
| Northern Trust Corporation | 26B |
| T. Rowe Price Group, Inc. | 23B |
| Franklin Resources, Inc. | 12B |
Ares Management Corporation ranks 5th among its peers with a market cap at 20.54% of the leader, Blackstone Inc. The company sits below both the average market cap of the top 10 (75B) and the sector median (46B). It holds a significant 108.53% gap above its nearest rival, The Bank of New York Mellon Corporation, highlighting its distinct positioning within the industry.
Comparisons with competitors
Check out how we compare the company to its competitors:
Does Ares have a competitive advantage?
Ares Management Corporation currently lacks a clear competitive advantage, as its ROIC falls below WACC, indicating value destruction despite improving profitability. Its income statement shows mixed signals with solid gross margins offset by rising interest expenses and declining net margin growth.
Looking ahead, Ares benefits from diversified asset management segments across credit, private equity, and real estate, targeting under-capitalized and middle-market companies. Expansion opportunities exist in new markets and financing solutions, which could enhance its position if it translates into sustained value creation.
SWOT Analysis
This SWOT analysis highlights Ares Management Corporation’s key strategic factors for investor consideration.
Strengths
- strong revenue growth
- diversified asset management platform
- favorable gross and EBIT margins
Weaknesses
- negative ROIC vs WACC indicates value destruction
- low current and quick ratios (0.73)
- high valuation multiples (PE 66.6, PB 4.07)
Opportunities
- expanding alternative credit markets
- growing global private equity demand
- increasing profitability trend (ROIC growth)
Threats
- macroeconomic volatility impacting credit markets
- rising interest expenses
- regulatory risks in financial services
ARES shows solid operational strengths and growth potential but suffers from balance sheet liquidity and valuation concerns. The firm must focus on improving capital efficiency and managing financial leverage to convert growing profitability trends into sustainable shareholder value.
Stock Price Action Analysis
The weekly stock chart below illustrates Ares Management Corporation’s price movements over the past 12 months, highlighting key highs and lows:
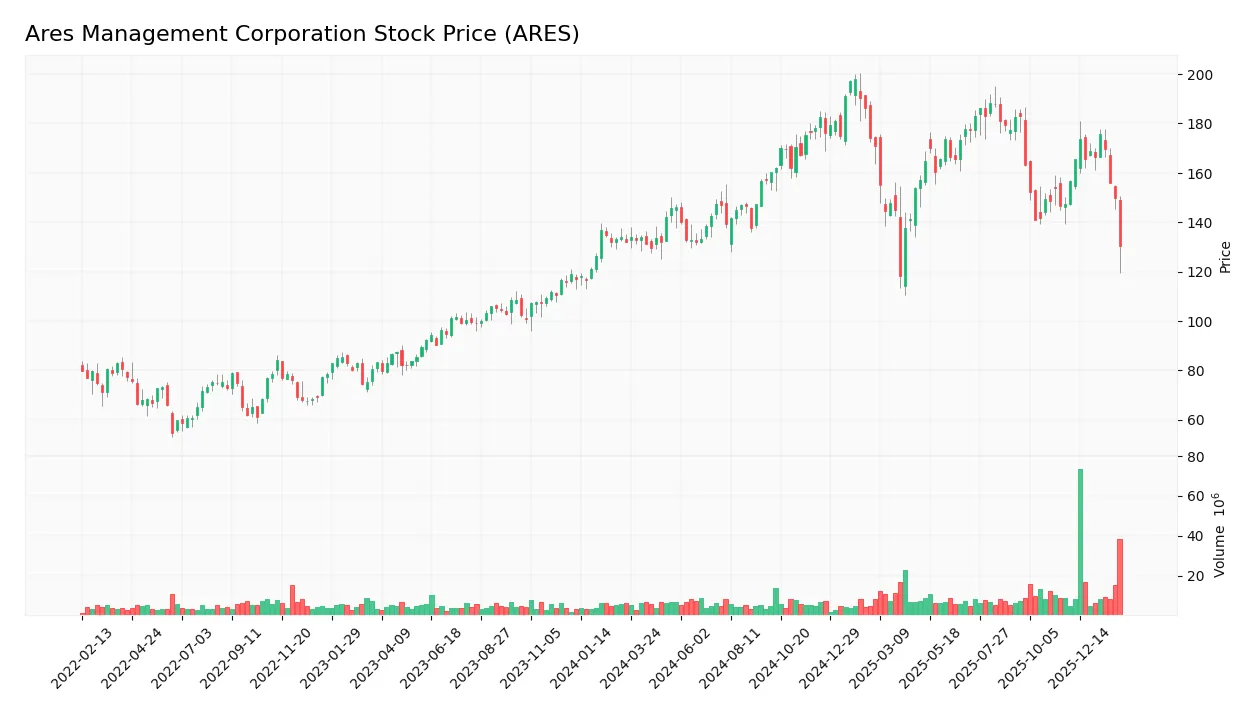
Trend Analysis
Over the past year, ARES stock declined by 11.17%, confirming a bearish trend. Volatility remains elevated with a 19.13 standard deviation. The highest price reached 198.22, and the lowest dropped to 118.04, showing a deceleration in the downtrend.
Volume Analysis
During the last three months, volume increased but showed slight seller dominance at 54.8%. This suggests cautious investor sentiment, with selling pressure outweighing buying interest despite rising market participation.
Target Prices
Analysts present a confident target consensus for Ares Management Corporation, reflecting a positive outlook.
| Target Low | Target High | Consensus |
|---|---|---|
| 148 | 215 | 179.25 |
The target range suggests upside potential from current levels, with a consensus price indicating steady growth expectations.

Don’t Let Luck Decide Your Entry Point
Optimize your entry points with our advanced ProRealTime indicators. You’ll get efficient buy signals with precise price targets for maximum performance. Start outperforming now!
Analyst & Consumer Opinions
This section examines Ares Management Corporation’s analyst ratings alongside consumer feedback to provide a balanced perspective.
Stock Grades
Here are the latest verified stock grades from leading financial institutions for Ares Management Corporation:
| Grading Company | Action | New Grade | Date |
|---|---|---|---|
| Goldman Sachs | Maintain | Buy | 2026-02-09 |
| Deutsche Bank | Upgrade | Buy | 2026-02-09 |
| RBC Capital | Maintain | Outperform | 2026-02-09 |
| Raymond James | Upgrade | Strong Buy | 2026-02-09 |
| Oppenheimer | Maintain | Outperform | 2026-02-06 |
| Barclays | Maintain | Overweight | 2026-02-06 |
| TD Cowen | Maintain | Buy | 2026-01-14 |
| UBS | Maintain | Neutral | 2026-01-13 |
| Barclays | Maintain | Overweight | 2026-01-09 |
| Barclays | Maintain | Overweight | 2025-12-12 |
The overall trend shows consistent support with multiple firms maintaining or upgrading their grades. Notably, Raymond James upgraded to Strong Buy, signaling growing confidence in the stock’s outlook.
Consumer Opinions
Consumers express a mixed but largely favorable view of Ares Management Corporation, emphasizing its strong asset management capabilities and client service.
| Positive Reviews | Negative Reviews |
|---|---|
| “Ares delivers consistent returns with a clear investment strategy.” | “Fees are higher than some competitors, impacting net gains.” |
| “Customer service is responsive and knowledgeable.” | “Occasional delays in reporting transparency create uncertainty.” |
| “Diverse portfolio options provide solid risk management.” | “Some clients find communication on fee structure confusing.” |
Overall, clients praise Ares for strong portfolio performance and attentive support. However, fee transparency and occasional reporting delays remain areas for improvement.
Risk Analysis
Below is a summary table outlining key risks facing Ares Management Corporation, with estimates of their likelihood and potential impact:
| Category | Description | Probability | Impact |
|---|---|---|---|
| Financial Distress | Altman Z-Score in distress zone signals high bankruptcy risk | High | Very High |
| Valuation Risk | Elevated P/E of 66.6 and P/B of 4.07 suggest overvaluation | Medium | High |
| Liquidity Risk | Current and quick ratios at 0.73 indicate weak short-term liquidity | Medium | Medium |
| Profitability Risk | ROE at 6.11% below WACC of 11.59% implies value destruction | High | High |
| Market Volatility | Beta of 1.52 signals above-market stock price volatility | High | Medium |
The most critical risk is financial distress, with the Altman Z-Score deeply negative, indicating a high bankruptcy probability. Elevated valuation multiples and weak returns on equity exacerbate concerns. Liquidity remains strained, raising short-term operational risks. Investors must weigh these against the company’s strong Piotroski score and favorable debt metrics for a balanced risk profile.
Should You Buy Ares Management Corporation?
Ares Management Corporation appears to be in financial distress, with a slightly unfavorable moat due to value destruction despite improving profitability. Supported by a manageable leverage profile but a very unfavorable rating (D+), it suggests a high-risk profile despite operational efficiency gains.
Strength & Efficiency Pillars
Ares Management Corporation sustains robust operational efficiency with a gross margin of 74.79% and an EBIT margin of 31.75%. The net margin stands at a healthy 8.15%, indicating solid profitability. However, the return on invested capital (7.67%) falls short of the weighted average cost of capital (11.59%), signaling the company is currently destroying value despite its improving profitability trend. This disconnect highlights a critical challenge in capital allocation effectiveness.
Weaknesses and Drawbacks
The company is in financial distress, reflected by a troubling Altman Z-Score of -2.33, pointing to a high bankruptcy risk. This solvency concern overshadows other metrics. Valuation multiples also raise red flags; a steep P/E of 66.62 and a P/B of 4.07 suggest an expensive market pricing. Poor liquidity ratios (current ratio and quick ratio both at 0.73) compound risks, indicating potential difficulties in meeting short-term obligations. Recent market behavior shows slight seller dominance (45.2% buyer percentage), adding short-term pressure.
Our Final Verdict about Ares Management Corporation
Despite operational strengths, Ares Management’s severe solvency risk renders the investment profile highly speculative and too risky for conservative capital. The Altman Z-Score firmly places the company in distress, which outweighs favorable margins and a strong Piotroski score. Investors seeking stability may find this profile unsuitable under current conditions, while risk-tolerant players might watch for signs of financial stabilization.
Disclaimer: This content is for informational purposes only and does not constitute financial, investment, or other professional advice. Investing in financial markets involves a significant risk of loss, and past performance is not indicative of future results.
Additional Resources
- Ares Management Corporation to Present at the 2026 RBC Capital Markets Global Financial Institutions Conference – ACCESS Newswire (Feb 25, 2026)
- Ares Management Hire Highlights Liquidity Questions In Private Credit Valuation – simplywall.st (Feb 26, 2026)
- Ares Management Corp SEC 10-K Report – TradingView (Feb 25, 2026)
- Month-End Portfolio Data Now Available for Ares Dynamic Credit Allocation Fund, Inc. – Voice of Alexandria (Feb 25, 2026)
- Ares’ $400 Million-Plus Bet on Football Has Turned Ugly – Bloomberg.com (Feb 25, 2026)
For more information about Ares Management Corporation, please visit the official website: aresmgmt.com