Home > Analyses > Consumer Defensive > Archer-Daniels-Midland Company
Archer-Daniels-Midland Company transforms raw agricultural commodities into essential products that touch daily life worldwide. As a global leader in agricultural processing, ADM excels in oilseeds, carbohydrate solutions, and nutrition ingredients. The company’s innovation and scale set industry standards for quality and efficiency. Yet, as markets evolve, I ask: do ADM’s fundamentals still support its current valuation and growth ambitions? This analysis seeks to answer that critical question.

Table of contents
Business Model & Company Overview
Archer-Daniels-Midland Company, founded in 1902 and headquartered in Chicago, commands a dominant position in the Agricultural Farm Products sector. It operates a cohesive ecosystem spanning procurement, processing, and merchandising of key agricultural commodities like oilseeds, corn, and wheat. Its integrated approach connects raw materials to diverse end markets, including food, feed, energy, and industrial sectors.
The company’s revenue engine balances physical commodity handling with value-added ingredients and specialty nutrition products. It maintains strategic global footprints across the Americas, Europe, and Asia. ADM’s broad portfolio—from vegetable oils to natural health products—fortifies its competitive advantage. This comprehensive, vertically integrated model underpins a durable economic moat shaping the future of global agriculture.
Financial Performance & Fundamental Metrics
I analyze Archer-Daniels-Midland Company’s income statement, key financial ratios, and dividend payout policy to assess its underlying financial health and shareholder value.
Income Statement
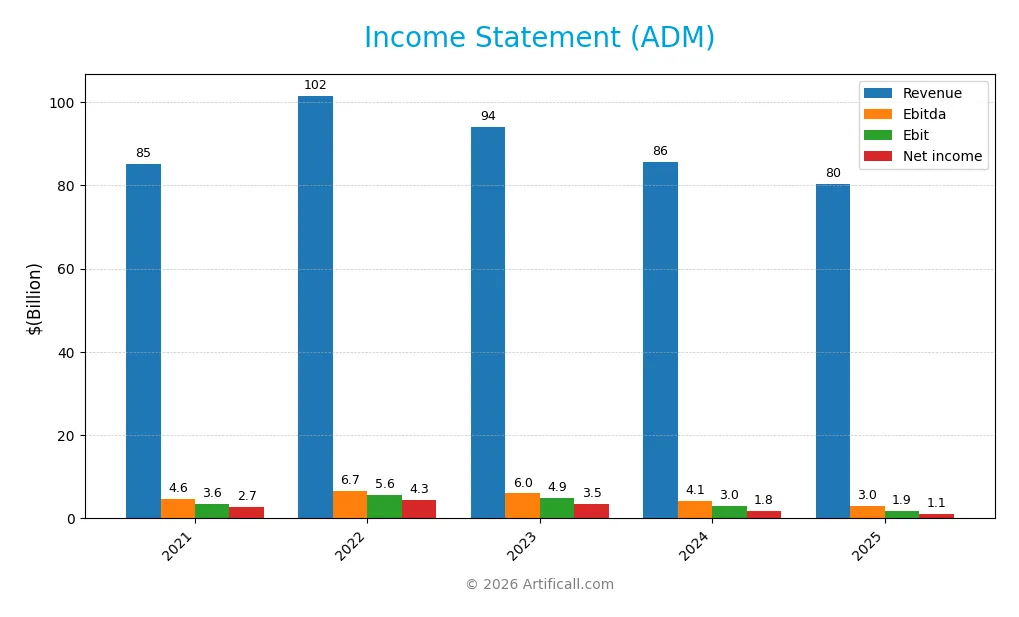
The table below summarizes Archer-Daniels-Midland Company’s key income statement figures for the fiscal years 2021 through 2025, highlighting trends in revenue, expenses, and profitability.
| 2021 | 2022 | 2023 | 2024 | 2025 | |
|---|---|---|---|---|---|
| Revenue | 85.2B | 101.6B | 93.9B | 85.5B | 80.3B |
| Cost of Revenue | 79.3B | 94.0B | 86.4B | 79.8B | 75.2B |
| Operating Expenses | 3.0B | 3.4B | 3.5B | 3.7B | 3.6B |
| Gross Profit | 6.0B | 7.6B | 7.5B | 5.8B | 5.0B |
| EBITDA | 4.6B | 6.7B | 6.0B | 4.1B | 3.0B |
| EBIT | 3.6B | 5.6B | 4.9B | 3.0B | 1.9B |
| Interest Expense | 284M | 405M | 653M | 706M | 612M |
| Net Income | 2.7B | 4.3B | 3.5B | 1.8B | 1.1B |
| EPS | 4.80 | 7.72 | 6.44 | 3.66 | 2.23 |
| Filing Date | 2022-02-17 | 2023-02-14 | 2024-03-12 | 2025-02-20 | 2026-02-17 |
Income Statement Evolution
Between 2021 and 2025, ADM’s revenue declined by 5.8%, with 2025 showing a 6.1% drop from 2024. Net income fell sharply by 60.2% over the period, reflecting a significant margin contraction. Gross margin stabilized around 6.3%, while EBIT margin tightened to 2.3%, indicating pressure on profitability despite relatively stable cost control.
Is the Income Statement Favorable?
The 2025 income statement reveals weakening fundamentals. Revenue and gross profit fell by over 6% and 12%, respectively, year-on-year. EBIT declined nearly 37%, dragging net margin down to 1.3%. Interest expense is favorable at 0.76% of revenue, but overall, net income and EPS contracted over 38%. These trends indicate an unfavorable income statement profile in 2025.
Financial Ratios
The following table presents key financial ratios for Archer-Daniels-Midland Company (ADM) over the past five fiscal years, offering insight into its profitability, leverage, liquidity, and market valuation:
| Ratios | 2021 | 2022 | 2023 | 2024 | 2025 |
|---|---|---|---|---|---|
| Net Margin | 3.18% | 4.27% | 3.71% | 2.10% | 1.34% |
| ROE | 12.05% | 17.87% | 14.43% | 8.12% | 4.74% |
| ROIC | 6.86% | 9.41% | 9.00% | 4.51% | 3.51% |
| P/E | 14.07 | 12.02 | 11.22 | 13.42 | 25.81 |
| P/B | 1.70 | 2.15 | 1.62 | 1.09 | 1.22 |
| Current Ratio | 1.45 | 1.46 | 1.60 | 1.39 | 11.20 |
| Quick Ratio | 0.79 | 0.85 | 0.95 | 0.81 | 11.20 |
| D/E | 0.47 | 0.42 | 0.40 | 0.52 | 0.37 |
| Debt-to-Assets | 18.8% | 17.2% | 17.6% | 21.7% | 24.3% |
| Interest Coverage | 10.54 | 10.40 | 6.21 | 2.93 | 2.33 |
| Asset Turnover | 1.52 | 1.70 | 1.72 | 1.61 | 2.32 |
| Fixed Asset Turnover | 7.87 | 9.21 | 8.02 | 7.01 | 7.18 |
| Dividend Yield | 2.19% | 1.72% | 2.50% | 4.08% | 3.55% |
Evolution of Financial Ratios
Return on Equity (ROE) declined sharply from 17.87% in 2022 to 4.74% in 2025, signaling weakened profitability. The Current Ratio surged dramatically to 11.2 in 2025, far above prior years’ stable range near 1.4–1.6, indicating a major shift in liquidity. Debt-to-Equity ratio improved, dropping to 0.37 in 2025 from 0.52 in 2024, reflecting reduced leverage.
Are the Financial Ratios Fovorable?
In 2025, profitability ratios like ROE (4.74%) and net margin (1.34%) are unfavorable, indicating thin earnings relative to equity and sales. Liquidity is mixed: Current Ratio at 11.2 is unfavorable due to inefficiency, but Quick Ratio is favorable. Leverage ratios, including Debt-to-Equity (0.37) and Debt-to-Assets (24.26%), are favorable, showing manageable debt levels. Asset turnover and dividend yield also rate favorably. Overall, 57% of ratios are favorable, supporting a generally positive view despite profitability concerns.
Shareholder Return Policy
Archer-Daniels-Midland pays dividends with a payout ratio rising to 91.6% in 2025, supported by a 3.55% yield and share buybacks. Dividend coverage by free cash flow remains adequate, though the high payout ratio signals limited buffer for earnings volatility.
The dividend trend shows steady increases, balancing returns with capital expenditure. This distribution approach aligns with sustainable shareholder value creation, assuming consistent cash flow, but investors should monitor potential risks from the elevated payout level.
Score analysis
The following radar chart illustrates key financial metrics evaluating the company’s current valuation and operational efficiency:
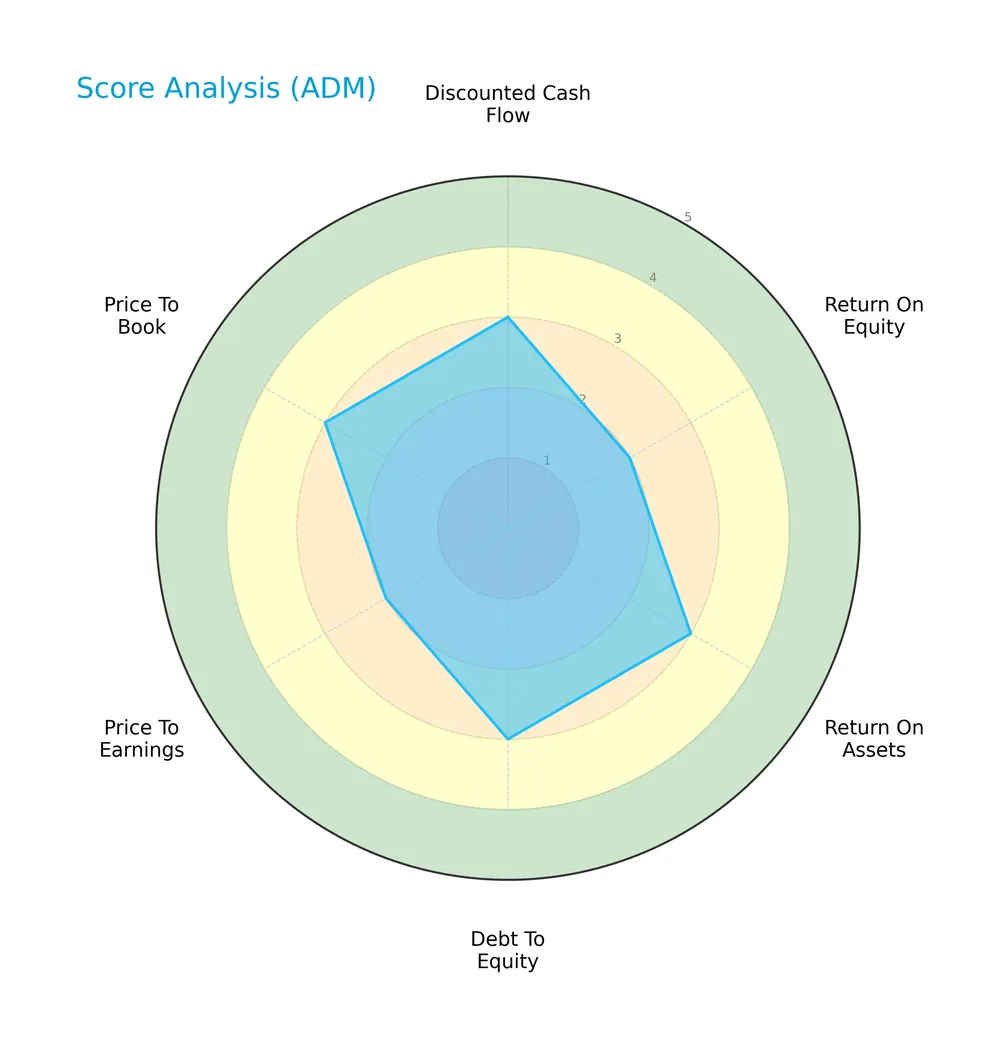
The company shows moderate scores in discounted cash flow, return on assets, debt to equity, and price to book. However, return on equity and price to earnings scores are unfavorable, signaling weaker profitability and valuation metrics.
Analysis of the company’s bankruptcy risk
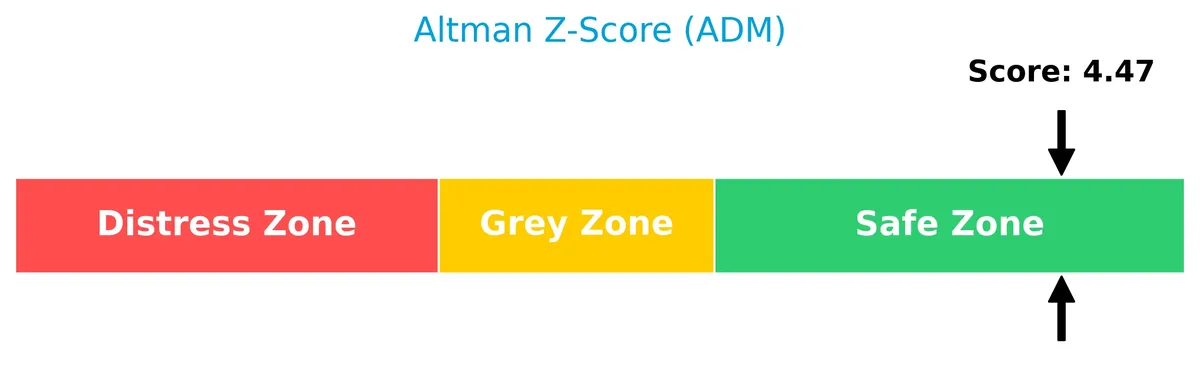
The Altman Z-Score places the company firmly in the safe zone, indicating a low risk of bankruptcy and strong financial stability:
Is the company in good financial health?
The Piotroski Score diagram highlights the company’s financial strength based on profitability, leverage, liquidity, and efficiency:

A score of 7 reflects strong financial health. This suggests the company maintains solid fundamentals, although not at the very highest level of financial robustness.
Competitive Landscape & Sector Positioning
This analysis examines Archer-Daniels-Midland Company’s strategic position within the agricultural farm products sector. It covers revenue segments, key products, competitors, and competitive advantages. I will assess whether ADM holds a sustainable edge over its peers.
Strategic Positioning
Archer-Daniels-Midland Company maintains a diversified portfolio across three main segments: Ag Services and Oilseeds (61.6B in 2025), Carbohydrate Solutions (10.7B), and Nutrition (7.5B). Its geographic exposure spans the US (31.2B), Switzerland (17.8B), Cayman Islands (6.1B), and multiple other countries, reflecting broad international reach.
Revenue by Segment
This pie chart illustrates Archer-Daniels-Midland Company’s revenue breakdown by segment for the fiscal year 2025.
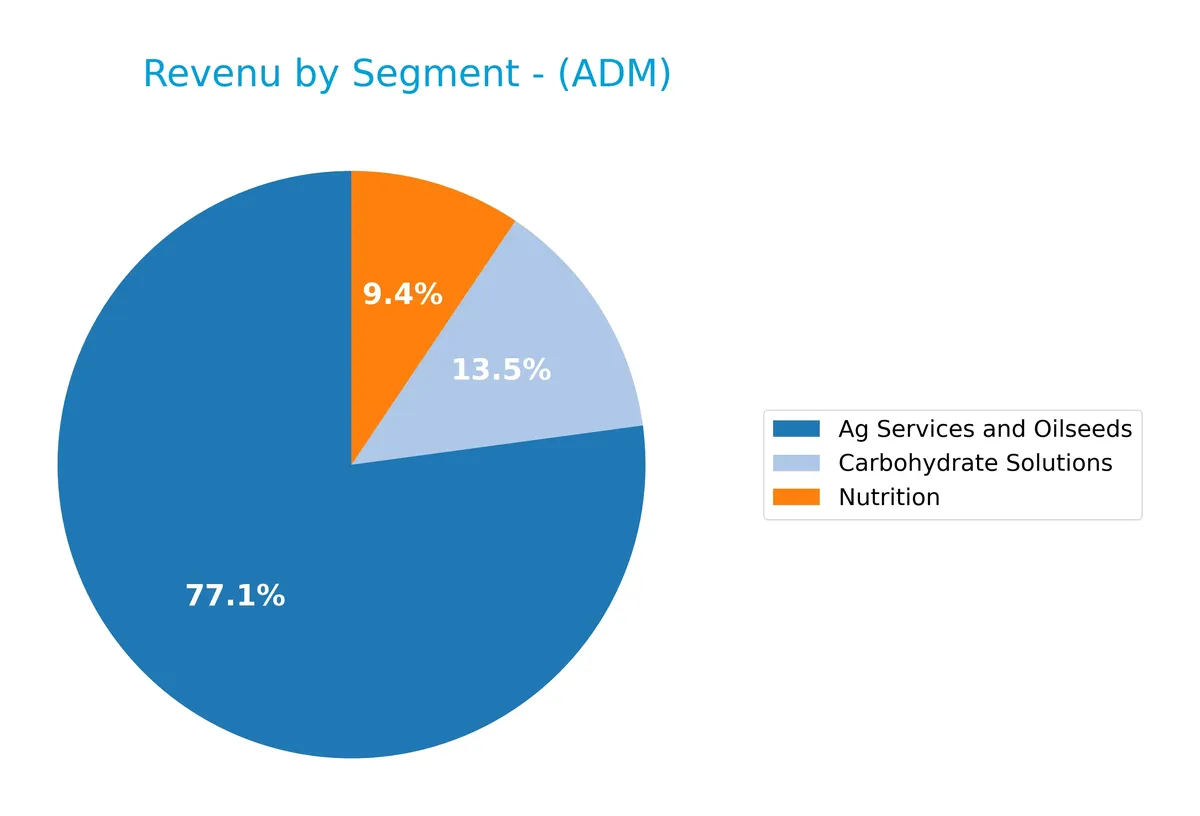
Ag Services and Oilseeds dominate ADM’s revenue with $61.6B in 2025, down from $66.5B in 2024. Carbohydrate Solutions and Nutrition follow with $10.7B and $7.5B, respectively. The recent year shows a slight slowdown in the core segment, indicating possible market pressures or strategic shifts, while diversification remains steady without excessive concentration risk.
Key Products & Brands
Below is a summary of Archer-Daniels-Midland Company’s key products and brands across its major business segments:
| Product | Description |
|---|---|
| Ag Services and Oilseeds | Procurement, storage, cleaning, and transportation of oilseeds, corn, wheat, milo, oats, and barley globally. |
| Carbohydrate Solutions | Production of sweeteners, starches, syrups, glucose, wheat flour, dextrose, alcohol, and related food and feed ingredients. |
| Nutrition | Natural flavors, proteins, emulsifiers, fibers, probiotics, enzymes, botanical extracts, and specialty food and feed ingredients. |
| Other Segments | Includes futures commission merchant services, commodity brokerage, structured trade finance, and contract pet food products. |
ADM’s product portfolio spans agricultural commodities and ingredients, emphasizing global sourcing and processing. Its diversified segments deliver inputs to food, feed, energy, and industrial markets.
Main Competitors
There are 4 competitors in total, with the table below listing the top 10 leaders by market capitalization:
| Competitor | Market Cap. |
|---|---|
| Archer-Daniels-Midland Company | 28.4B |
| Tyson Foods, Inc. | 20.7B |
| Bunge Global S.A. | 17.9B |
| SMITHFIELD FOODS INC | 8.8B |
Archer-Daniels-Midland Company ranks 1st among its competitors. Its market cap is 16% larger than the next closest rival, Tyson Foods. ADM stands well above both the average market cap of the top 10 competitors (19B) and the sector median (19.3B). The company maintains a significant 59% gap below its market cap to the next competitor, underscoring its leadership in the sector.
Comparisons with competitors
Check out how we compare the company to its competitors:
Does ADM have a competitive advantage?
ADM currently lacks a competitive advantage, as it is destroying value with an ROIC below its WACC and a declining profitability trend over 2021-2025. The company’s income statement shows predominantly unfavorable growth metrics, reflecting operational challenges in maintaining margins.
Looking ahead, ADM’s diversified agricultural commodity segments and international footprint offer opportunities in evolving food and nutrition ingredients markets. However, recent negative revenue and profit growth signal risks that may affect its ability to capitalize on new products and geographic expansion.
SWOT Analysis
This SWOT analysis highlights Archer-Daniels-Midland Company’s key internal and external factors affecting its strategic position.
Strengths
- diversified global footprint
- strong dividend yield (3.55%)
- favorable debt metrics (D/E 0.37)
Weaknesses
- declining revenue and profit growth
- ROIC below WACC, destroying value
- weak net margin (1.34%) and ROE (4.74%)
Opportunities
- expanding nutrition and specialty ingredients
- growing demand for sustainable agricultural products
- potential cost efficiencies via asset turnover (7.18)
Threats
- volatile commodity prices
- regulatory risks in multiple jurisdictions
- margin pressure from global supply chain issues
ADM’s strengths in global scale and balance sheet stability contrast with ongoing profitability declines. The company must focus on innovation and cost control to offset external headwinds and restore value creation.
Stock Price Action Analysis
The weekly stock chart below illustrates Archer-Daniels-Midland Company’s price movements and key levels over the past 12 months:
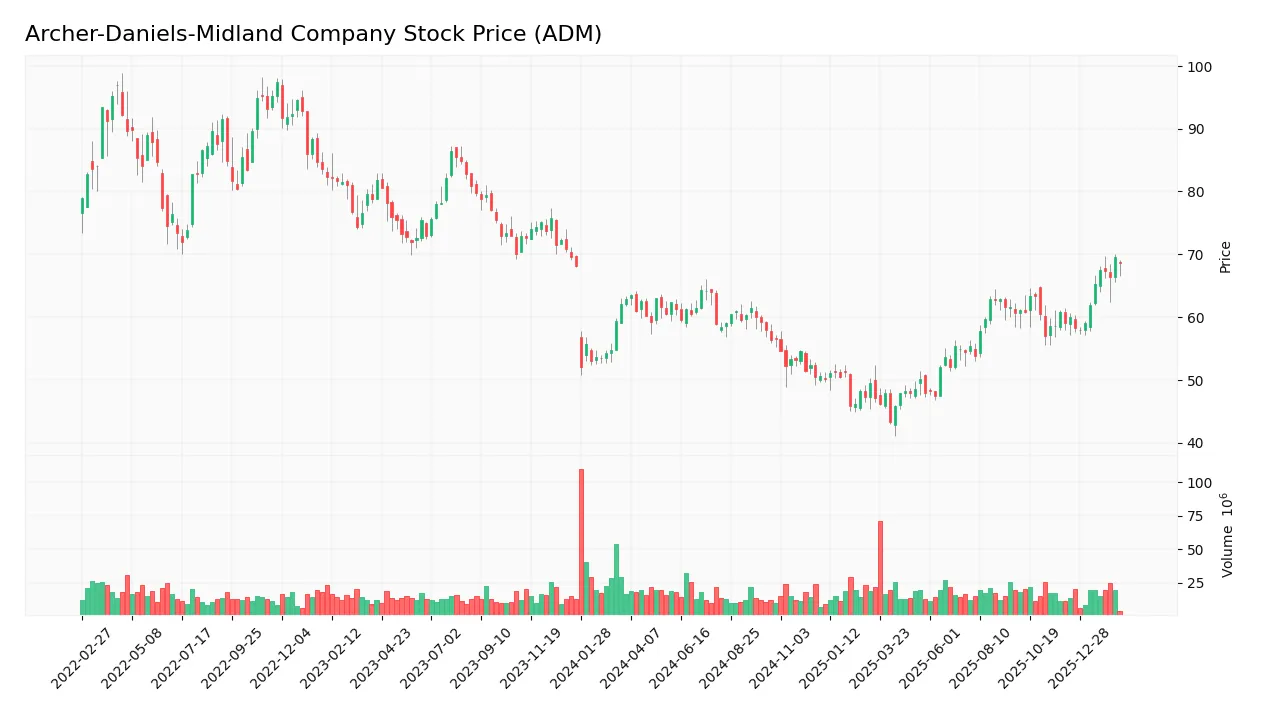
Trend Analysis
Over the past 12 months, ADM’s stock price increased by 9.17%, indicating a bullish trend with price acceleration. The price ranged between 43.32 and 69.51, with volatility measured by a 6.12 standard deviation. Recent months show an even stronger rise of 16.2%, confirming upward momentum.
Volume Analysis
Trading volumes over the last three months show a slight decrease overall. Buyer activity slightly leads sellers with 52.4% dominance but buyer behavior remains neutral. This suggests balanced market participation with cautious optimism among investors.
Target Prices
Analysts present a clear consensus on Archer-Daniels-Midland Company’s target price range.
| Target Low | Target High | Consensus |
|---|---|---|
| 50 | 63 | 57.33 |
The consensus target price of 57.33 indicates moderate upside potential from current levels, reflecting cautious optimism among analysts.

Don’t Let Luck Decide Your Entry Point
Optimize your entry points with our advanced ProRealTime indicators. You’ll get efficient buy signals with precise price targets for maximum performance. Start outperforming now!
Analyst & Consumer Opinions
This section reviews Archer-Daniels-Midland Company’s analyst ratings and consumer feedback to gauge market sentiment and brand perception.
Stock Grades
Here are the latest verified stock grades from leading financial institutions for Archer-Daniels-Midland Company:
| Grading Company | Action | New Grade | Date |
|---|---|---|---|
| JP Morgan | Maintain | Underweight | 2026-02-04 |
| JP Morgan | Maintain | Underweight | 2026-01-21 |
| Morgan Stanley | Downgrade | Underweight | 2025-12-16 |
| JP Morgan | Downgrade | Underweight | 2025-11-05 |
| Morgan Stanley | Maintain | Equal Weight | 2025-08-12 |
| UBS | Maintain | Buy | 2025-08-11 |
| Barclays | Upgrade | Equal Weight | 2025-08-06 |
| Barclays | Maintain | Underweight | 2025-07-02 |
| UBS | Upgrade | Buy | 2025-05-19 |
| B of A Securities | Downgrade | Underperform | 2025-05-08 |
The grades reveal a cautious stance, with multiple downgrades to Underweight in late 2025 and early 2026. However, some firms maintain Buy ratings, indicating mixed sentiment within the analyst community.
Consumer Opinions
Archer-Daniels-Midland Company (ADM) earns mixed reactions from consumers, reflecting both its operational strengths and areas needing improvement.
| Positive Reviews | Negative Reviews |
|---|---|
| Reliable supply chain; products consistently arrive on time. | Customer service can be slow to respond during peak seasons. |
| High product quality with consistent taste and freshness. | Limited local availability in some regions frustrates buyers. |
| Competitive pricing compared to industry peers. | Packaging improvements needed for better sustainability. |
Overall, consumers praise ADM’s reliable delivery and product quality. However, repeated concerns about customer service responsiveness and regional availability signal room for operational enhancements.
Risk Analysis
Below is a summary table outlining key risks facing Archer-Daniels-Midland Company by category, probability, and impact:
| Category | Description | Probability | Impact |
|---|---|---|---|
| Market Volatility | Commodity price fluctuations can affect margins | High | High |
| Regulatory | Changes in agricultural and environmental policies | Medium | Medium |
| Operational | Supply chain disruptions impacting procurement and logistics | Medium | High |
| Financial | Low returns on equity and capital relative to cost of capital | High | Medium |
| Competitive | Intense competition from global agribusinesses | Medium | Medium |
The most pressing risks are market volatility and financial performance. ADM’s net margin (1.34%) and ROE (4.74%) remain below industry averages, signaling margin pressure amid cyclical commodity markets. Recent global supply chain strains add operational risk. However, ADM’s strong Altman Z-Score (4.47) confirms financial stability despite these headwinds.
Should You Buy Archer-Daniels-Midland Company?
Archer-Daniels-Midland Company appears to be navigating a very unfavorable competitive moat, shedding value with declining ROIC. Despite this, its profitability suggests moderate operational efficiency, and the leverage profile seems manageable. The overall rating stands at a cautious B, indicating a mixed but stable financial health profile.
Strength & Efficiency Pillars
Archer-Daniels-Midland Company shows operational resilience with a gross margin of 6.27% and an EBIT margin of 2.33%. Its interest expense is favorably low at 0.76%, supporting cost efficiency. The Altman Z-Score of 4.47 places ADM securely in the safe zone, indicating strong solvency. However, the company’s ROIC of 3.51% falls below its WACC of 6.68%, signaling value erosion rather than creation. This gap reveals challenges in generating returns above capital costs despite stable margins.
Weaknesses and Drawbacks
ADM faces headwinds with an unfavorable net margin of 1.34% and a low return on equity of 4.74%. Its price-to-earnings ratio is high at 25.81, reflecting premium valuation that may pressure downside risk if earnings disappoint. The current ratio of 11.2 flags potential inefficiency in asset utilization or liquidity management. Revenue growth has declined by 6.15% over the past year, with net income shrinking by 60.21% over the last five years, underscoring ongoing profitability challenges.
Our Final Verdict about Archer-Daniels-Midland Company
Despite a strong solvency profile and a bullish stock trend with recent price acceleration, ADM’s fundamental picture remains mixed. The company’s inability to generate returns above its cost of capital and shrinking earnings growth suggest caution. The profile might appear suitable for investors seeking exposure to a stable balance sheet but could warrant a wait-and-see approach given valuation and profitability headwinds.
Disclaimer: This content is for informational purposes only and does not constitute financial, investment, or other professional advice. Investing in financial markets involves a significant risk of loss, and past performance is not indicative of future results.
Additional Resources
- Decoding Archer-Daniels-Midland Co (ADM): A Strategic SWOT Insig – GuruFocus (Feb 18, 2026)
- Archer-Daniels-Midland Co SEC 10-K Report – TradingView (Feb 17, 2026)
- Archer Daniels Midland Company (NYSE:ADM) Given Average Recommendation of “Reduce” by Brokerages – MarketBeat (Feb 17, 2026)
- BMO Lifts Archer-Daniels-Midland (ADM) Target After Q4, Says EPS Still Needs to Catch Up – Yahoo Finance (Feb 13, 2026)
- Grain trader ADM’s 2026 profit forecast lags expectations amid US biofuel policy uncertainty – Reuters (Feb 03, 2026)
For more information about Archer-Daniels-Midland Company, please visit the official website: adm.com