Home > Analyses > Financial Services > Arch Capital Group Ltd.
Arch Capital Group Ltd. underwrites risks that shape global commerce and personal security every day. As a diversified insurance powerhouse, it delivers tailored casualty, property, reinsurance, and mortgage insurance solutions worldwide. Arch’s reputation for innovation and disciplined risk management fuels its strong market presence. Yet, as the insurance landscape evolves rapidly, I ask: do Arch’s fundamentals still justify its current valuation and growth prospects in 2026?

Table of contents
Business Model & Company Overview
Arch Capital Group Ltd., founded in 1995 and headquartered in Pembroke, Bermuda, stands as a formidable player in the diversified insurance industry. With 7,200 employees worldwide, it delivers a comprehensive ecosystem of insurance, reinsurance, and mortgage insurance products. The group’s core mission unites casualty, property, and specialty coverages under one roof, serving a broad client base through retail and wholesale brokers.
The company’s revenue engine balances primary insurance, reinsurance, and mortgage insurance, leveraging recurring premiums across global markets in the Americas, Europe, and Asia. This multi-segment approach fosters steady cash flow and risk diversification. Arch Capital’s economic moat lies in its broad product portfolio and deep broker relationships, positioning it to shape the future landscape of global insurance.
Financial Performance & Fundamental Metrics
I analyze Arch Capital Group Ltd.’s income statement, key financial ratios, and dividend payout policy to reveal its underlying economic strength and shareholder value approach.
Income Statement
Below is Arch Capital Group Ltd.’s income statement summary for fiscal years 2021 through 2025, showing key profitability and expense metrics.

| 2021 | 2022 | 2023 | 2024 | 2025 | |
|---|---|---|---|---|---|
| Revenue | 8.92B | 9.66B | 13.29B | 16.93B | 19.43B |
| Cost of Revenue | 5.89B | 6.77B | 8.56B | 10.99B | 9.37B |
| Operating Expenses | 1.30B | 1.52B | 1.63B | 1.46B | 4.90B |
| Gross Profit | 3.04B | 2.89B | 4.74B | 5.94B | 10.06B |
| EBITDA | 2.32B | 1.72B | 3.61B | 4.85B | 5.50B |
| EBIT | 2.24B | 1.62B | 3.52B | 4.62B | 5.31B |
| Interest Expense | 0.14B | 0.13B | 0.13B | 0.14B | 0.15B |
| Net Income | 2.16B | 1.48B | 4.44B | 4.31B | 4.40B |
| EPS | 5.34 | 3.90 | 11.94 | 11.47 | 11.84 |
| Filing Date | 2022-02-25 | 2023-02-24 | 2024-02-23 | 2025-02-27 | 2026-02-26 |
Income Statement Evolution
Arch Capital Group Ltd. (ACGL) shows robust revenue growth from 8.9B in 2021 to 19.4B in 2025, more than doubling over five years. Net income also rose strongly, doubling from 2.1B to 4.4B. Gross margins improved significantly, reaching 51.8% in 2025, while EBIT margin stabilized at a favorable 27.3%. Net margin declined slightly but remains above 22%.
Is the Income Statement Favorable?
The 2025 income statement reflects solid fundamentals with revenue up 14.7% year-over-year and gross profit surging 69.4%. Despite operating expenses growing at the same pace as revenue, EBIT increased 15%, sustaining operational efficiency. However, net margin fell 11%, signaling some pressure on profitability. Overall, the financials indicate a generally favorable income profile with prudent cost and interest expense control.
Financial Ratios
The following table presents key financial ratios for Arch Capital Group Ltd. (ACGL) over the past five fiscal years, providing insight into profitability, efficiency, liquidity, leverage, and shareholder returns:
| Ratios | 2021 | 2022 | 2023 | 2024 | 2025 |
|---|---|---|---|---|---|
| Net Margin | 24% | 15% | 33% | 25% | 23% |
| ROE | 16% | 11% | 24% | 21% | 18% |
| ROIC | 9% | 8% | 13% | 16% | 7% |
| P/E | 8.1 | 15.7 | 6.2 | 8.0 | 8.0 |
| P/B | 1.29 | 1.79 | 1.49 | 1.65 | 1.46 |
| Current Ratio | 0.70 | 0.66 | 0.67 | 0.63 | 1.21 |
| Quick Ratio | 0.70 | 0.66 | 0.67 | 0.63 | 1.21 |
| D/E | 0.20 | 0.21 | 0.15 | 0.13 | 0.11 |
| Debt-to-Assets | 6.0% | 5.7% | 4.6% | 3.8% | 4.1% |
| Interest Coverage | 12.5x | 10.5x | 23.4x | 31.7x | 34.9x |
| Asset Turnover | 0.20 | 0.20 | 0.23 | 0.24 | 0.29 |
| Fixed Asset Turnover | 0 | 0 | 0 | 0 | 0 |
| Dividend Yield | 0.27% | 0.17% | 0.15% | 5.54% | 0.13% |
Evolution of Financial Ratios
Arch Capital Group Ltd. (ACGL) shows a rising trend in Return on Equity (ROE), improving from 11.43% in 2022 to 18.17% in 2025. The Current Ratio increased from below 1 in earlier years to 1.21 in 2025, indicating better liquidity. The Debt-to-Equity Ratio steadily declined to 0.11, reflecting lower leverage and enhanced financial stability.
Are the Financial Ratios Favorable?
In 2025, ACGL’s profitability ratios are strong, with a net margin of 22.65% and ROE at 18.17%, both favorable versus industry averages. Liquidity is neutral to favorable; the Current Ratio is 1.21 (neutral), but the Quick Ratio is favorable at the same level. Leverage is low, with a Debt-to-Equity of 0.11 and a high interest coverage ratio of 35.86, indicating solid debt servicing capability. Asset turnover is low and marked unfavorable, while dividend yield is weak at 0.13%, highlighting limited income return. Overall, 64% of key ratios are favorable, underpinning a generally positive financial profile.
Shareholder Return Policy
Arch Capital Group Ltd. maintains a low dividend payout ratio of about 1%, with a modest dividend yield near 0.13%. Dividends are comfortably covered by free cash flow, and the company also executes share buybacks, supporting capital return.
This conservative distribution approach aligns with sustainable long-term value creation. Low payout ratios and steady buybacks suggest prudent capital allocation, balancing shareholder returns and reinvestment potential amid stable profitability.
Score analysis
The radar chart below displays Arch Capital Group Ltd.’s key financial scores, highlighting valuation, profitability, and leverage metrics:
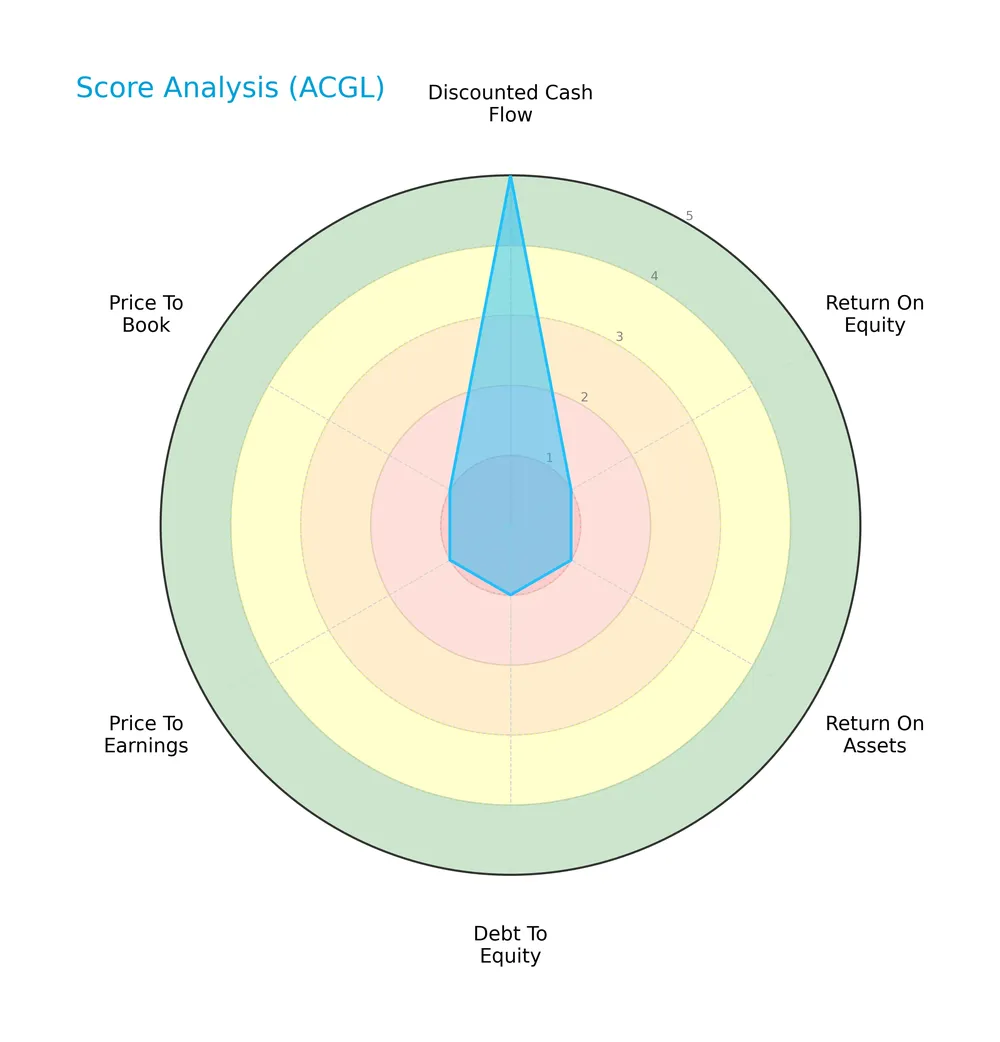
Arch Capital scores very favorably on discounted cash flow, ROE, and ROA, each rated 5. Debt-to-equity and P/E ratios are favorable at 4, while the price-to-book ratio is an outlier with an unfavorable score of 2.
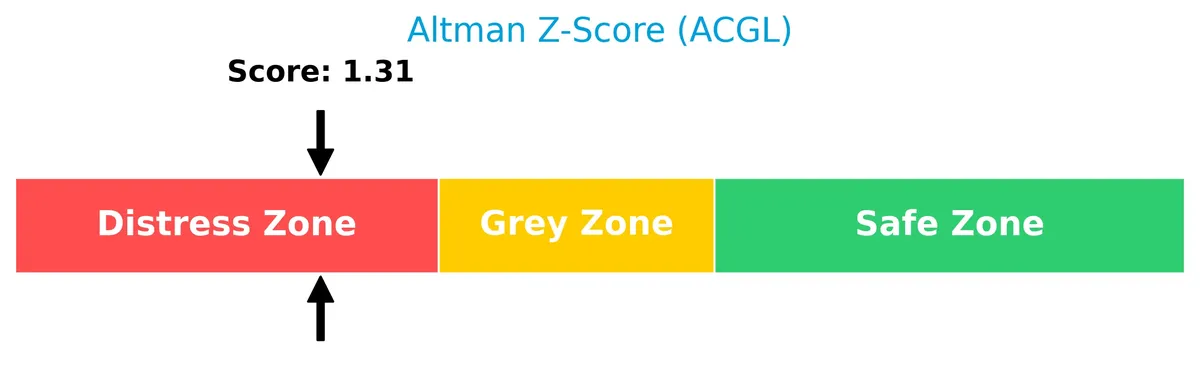
Analysis of the company’s bankruptcy risk
Arch Capital currently resides in the distress zone according to its Altman Z-Score, indicating a heightened risk of financial distress:
Is the company in good financial health?
The Piotroski diagram illustrates Arch Capital’s very strong financial health based on its score of 8:

A Piotroski score of 8 signals robust profitability, liquidity, and operational efficiency, underscoring the company’s solid financial foundation despite some risk flags.
Competitive Landscape & Sector Positioning
This analysis explores Arch Capital Group Ltd.’s strategic positioning within the diversified insurance sector. It examines revenue by segment, key products, and main competitors to understand market dynamics. I will assess whether Arch Capital Group Ltd. maintains a competitive advantage over its peers.
Strategic Positioning
Arch Capital Group Ltd. maintains a diversified product portfolio across insurance, reinsurance, and mortgage segments, each generating multi-billion-dollar revenues. Its global footprint spans various insurance lines, reflecting a broad risk exposure and marketing through independent brokers, reinforcing its multi-segment, worldwide strategic stance.
Revenue by Segment
This pie chart presents Arch Capital Group Ltd.’s revenue breakdown by segment for the full fiscal year 2025, highlighting key business drivers within insurance, mortgage, and reinsurance.
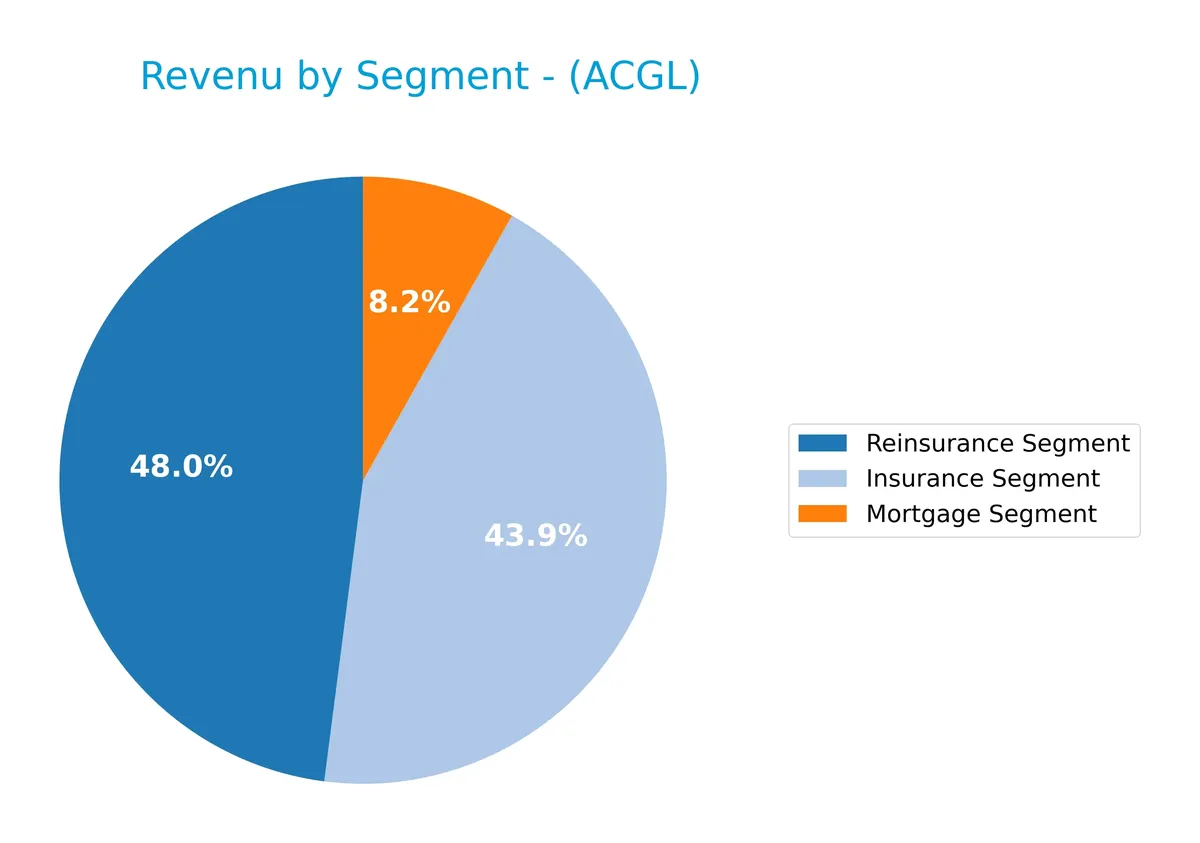
In 2025, Arch Capital’s revenue centers on Reinsurance at $8.1B and Insurance at $7.7B, both showing robust growth from prior years. Mortgage revenue, while smaller at $1.2B, remains stable. The trend reveals accelerating expansion in core risk underwriting segments, emphasizing the company’s strategic focus on diversifying insurance risk. This concentration in insurance and reinsurance segments reflects a mature, capital-intensive business with rising scale and complexity.
Key Products & Brands
Arch Capital Group Ltd. offers a diverse range of insurance, reinsurance, and mortgage insurance products globally:
| Product | Description |
|---|---|
| Insurance Segment | Provides primary and excess casualty coverages, liability, workers’ compensation, property, energy, marine, aviation, travel, accident, disability, medical plans, and commercial products. |
| Reinsurance Segment | Offers casualty reinsurance, marine, aviation, surety, accident and health, catastrophe, agriculture, trade credit, political risk, life reinsurance, and risk management solutions. |
| Mortgage Segment | Delivers direct mortgage insurance and mortgage reinsurance products. |
Arch Capital’s product mix spans primary insurance, reinsurance, and mortgage insurance, reflecting a broad footprint in diversified risk coverage. The company markets mainly through brokers worldwide.
Main Competitors
The sector includes 5 competitors, with the table below listing the top 5 leaders by market capitalization:
| Competitor | Market Cap. |
|---|---|
| Berkshire Hathaway Inc. | 1.07T |
| American International Group, Inc. | 45.5B |
| The Hartford Financial Services Group, Inc. | 38.2B |
| Arch Capital Group Ltd. | 34.9B |
| Principal Financial Group, Inc. | 20.1B |
Arch Capital Group Ltd. ranks 4th among its competitors. It holds 3.37% of the market cap of the sector leader, Berkshire Hathaway. The company is below both the average market cap of the top 10 competitors (242B) and the median of its sector (38.2B). Arch Capital has a 5.73% market cap gap to the next competitor above, The Hartford Financial Services Group.
Comparisons with competitors
Check out how we compare the company to its competitors:
Does ACGL have a competitive advantage?
Arch Capital Group Ltd. presents a competitive advantage with a ROIC exceeding its WACC by 2.04%, indicating value creation despite a declining profitability trend. This favorable moat suggests efficient capital use but signals caution as returns diminish.
Looking ahead, ACGL’s diversified insurance, reinsurance, and mortgage segments show strong revenue growth, offering opportunities to expand market share. Continued innovation and geographic reach support potential gains in a competitive financial services sector.
SWOT Analysis
This SWOT analysis highlights Arch Capital Group Ltd.’s key internal and external factors shaping its strategic position.
Strengths
- strong net margin at 22.65%
- favorable revenue growth of 14.74% in 2025
- low debt-to-equity at 0.11
Weaknesses
- declining ROIC trend by 20.9%
- asset turnover below industry norms
- low dividend yield at 0.13%
Opportunities
- expanding reinsurance and insurance segments
- growing global demand for diversified insurance products
- potential margin improvement via operational efficiency
Threats
- high regulatory scrutiny in financial services
- exposure to catastrophic loss events
- Altman Z-Score in distress zone signals financial risk
Arch Capital demonstrates solid profitability and growth with prudent leverage. However, declining asset efficiency and a weak Altman Z-Score warrant caution. Strategic focus should prioritize operational improvements and risk mitigation to sustain value creation.
Stock Price Action Analysis
The weekly stock chart for Arch Capital Group Ltd. (ACGL) highlights price movements and volatility over the past 12 months:
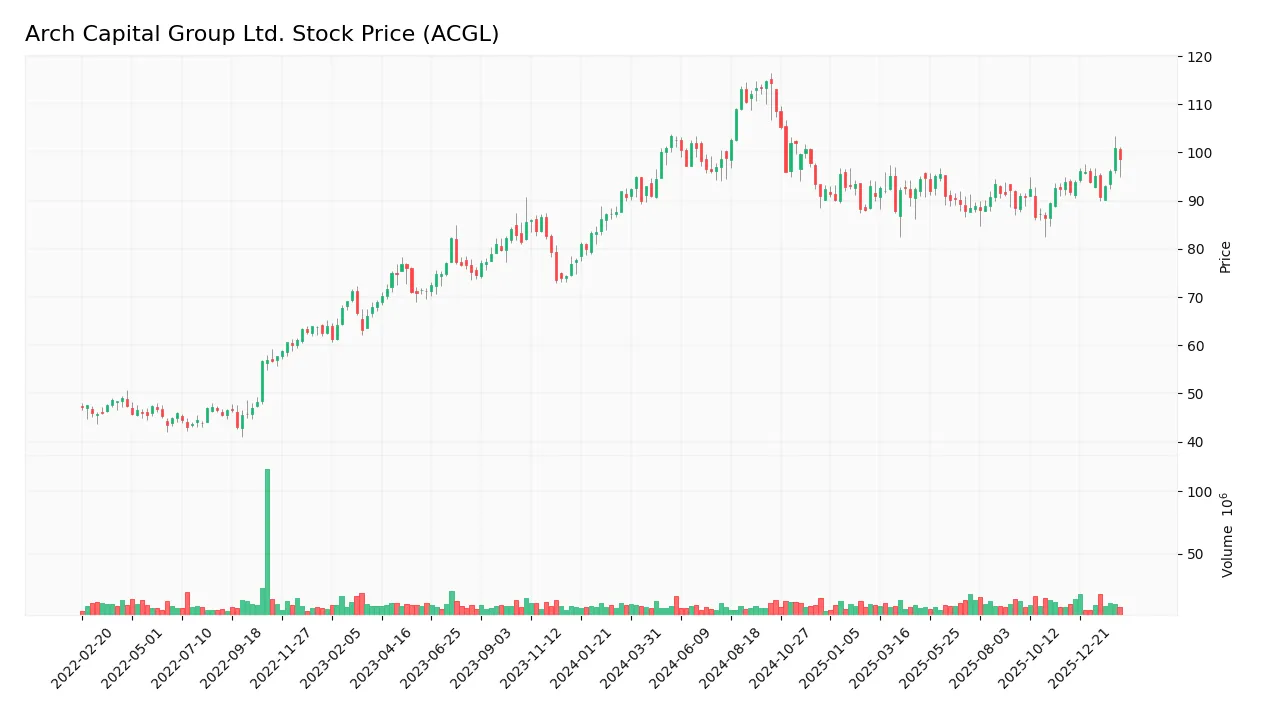
Trend Analysis
Over the past 12 months, ACGL’s stock price increased by 5.01%, signaling a bullish trend. The trend shows acceleration, supported by a high of 114.86 and a low of 86.31. The standard deviation of 6.69 indicates notable volatility during this period.
Volume Analysis
Trading volume for ACGL is increasing, with buyer volume at 81890K surpassing seller volume at 39923K in the recent period. Buyer dominance at 67.23% suggests strong buying interest and positive investor sentiment over the last three months.
Target Prices
Analysts set a clear consensus target price for Arch Capital Group Ltd., reflecting moderate upside potential.
| Target Low | Target High | Consensus |
|---|---|---|
| 93 | 125 | 106.22 |
The target range suggests analysts expect Arch Capital to trade between 93 and 125, with a consensus near 106, indicating steady confidence in its valuation.

Don’t Let Luck Decide Your Entry Point
Optimize your entry points with our advanced ProRealTime indicators. You’ll get efficient buy signals with precise price targets for maximum performance. Start outperforming now!
Analyst & Consumer Opinions
This section examines recent analyst ratings and consumer feedback related to Arch Capital Group Ltd. (ACGL).
Stock Grades
Here is a summary of recent analyst grades from recognized firms for Arch Capital Group Ltd.:
| Grading Company | Action | New Grade | Date |
|---|---|---|---|
| Cantor Fitzgerald | Maintain | Neutral | 2026-02-17 |
| UBS | Maintain | Buy | 2026-02-17 |
| Keefe, Bruyette & Woods | Maintain | Market Perform | 2026-02-13 |
| Citigroup | Maintain | Buy | 2026-02-13 |
| Mizuho | Maintain | Neutral | 2026-02-12 |
| Wells Fargo | Maintain | Overweight | 2026-02-11 |
| RBC Capital | Maintain | Outperform | 2026-02-11 |
| Cantor Fitzgerald | Maintain | Neutral | 2026-01-14 |
| Barclays | Maintain | Equal Weight | 2026-01-08 |
| Goldman Sachs | Maintain | Sell | 2026-01-08 |
The grades show a balanced view, with a mix of Buy and Neutral ratings predominating. Few sell opinions are present, reflecting generally stable analyst confidence.
Consumer Opinions
Arch Capital Group Ltd. garners mixed sentiments from its customer base, reflecting its varied service experiences.
| Positive Reviews | Negative Reviews |
|---|---|
| Efficient claims processing speeds up resolutions. | Customer service wait times can be frustratingly long. |
| Competitive pricing attracts a loyal clientele. | Some policy terms lack clarity, causing confusion. |
| Strong financial stability reassures clients. | Digital platform occasionally experiences usability issues. |
Overall, consumers praise Arch Capital’s financial strength and competitive pricing. However, they frequently cite customer service delays and unclear policy details as areas needing improvement.
Risk Analysis
Below is a summary of key risks facing Arch Capital Group Ltd., including their likelihood and potential impact:
| Category | Description | Probability | Impact |
|---|---|---|---|
| Bankruptcy Risk | Altman Z-Score at 1.64 signals financial distress, implying moderate risk of insolvency. | Medium | High |
| Low Asset Turnover | Asset turnover at 0.29 is weak, indicating less efficient use of assets to generate revenue. | High | Medium |
| Dividend Yield | Dividend yield is low at 0.13%, which may deter income-focused investors. | High | Low |
| Price-to-Book | Price-to-book ratio is unfavorable at 1.46, suggesting valuation concerns relative to net assets. | Medium | Medium |
| Industry Exposure | Exposure to catastrophe losses in insurance and reinsurance segments raises operational risk. | Medium | High |
The most concerning risk is the distressed Altman Z-Score, hinting at potential financial strain despite strong profitability and equity returns. Asset turnover remains a weak point, limiting growth efficiency. Recent natural catastrophe trends heighten underwriting risks in reinsurance. Investors should weigh these factors carefully.
Should You Buy Arch Capital Group Ltd.?
Arch Capital Group Ltd. appears to be generating robust value creation with a durable competitive moat, despite a declining ROIC trend. The company maintains a manageable leverage profile. Its overall A+ rating suggests a very favorable financial health, though caution is warranted given its Altman Z-Score in the distress zone.
Strength & Efficiency Pillars
Arch Capital Group Ltd. posts a robust net margin of 22.65% and return on equity of 18.17%, underscoring operational efficiency. The company’s ROIC at 7.38% exceeds its WACC of 5.34%, establishing it as a value creator. While ROIC shows a declining trend, Arch maintains strong interest coverage at 35.86, reflecting manageable financing costs. These metrics convey solid profitability with disciplined capital allocation despite some erosion in return on invested capital.
Weaknesses and Drawbacks
Arch Capital Group Ltd. is in financial distress, evidenced by an Altman Z-Score of 1.64, signaling heightened bankruptcy risk. This solvency concern eclipses its favorable margins. Additionally, the asset turnover ratio at 0.29 is weak, indicating inefficient asset use. The dividend yield is minimal at 0.13%, limiting income appeal. Although valuation metrics like P/E of 8.05 and P/B of 1.46 appear reasonable, the distress zone status overshadows these positives and demands caution.
Our Final Verdict about Arch Capital Group Ltd.
Despite strong operational profitability and value creation, Arch Capital Group Ltd. remains highly speculative due to its Altman Z-Score of 1.64 in the distress zone. This solvency risk makes the stock too risky for conservative capital. Investors may find potential in its improving market trends and buyer dominance but should weigh these against looming financial stability concerns.
Disclaimer: This content is for informational purposes only and does not constitute financial, investment, or other professional advice. Investing in financial markets involves a significant risk of loss, and past performance is not indicative of future results.
Additional Resources
- Artisan Partners Limited Partnership Sells 195,184 Shares of Arch Capital Group Ltd. $ACGL – MarketBeat (Feb 27, 2026)
- Decoding Arch Capital Group Ltd (ACGL): A Strategic SWOT Insight – GuruFocus (Feb 27, 2026)
- ARCH CAPITAL GROUP LTD. SEC 10-K Report – TradingView (Feb 26, 2026)
- Management’s Confidence Boosted Arch Capital Group Ltd. (ACGL) – Yahoo Finance (Feb 10, 2026)
- Analysts’ Top Financial Picks: Nasdaq (NDAQ), Arch Capital Group (ACGL) – The Globe and Mail (Feb 24, 2026)
For more information about Arch Capital Group Ltd., please visit the official website: archgroup.com