Home > Analyses > Consumer Cyclical > Aptiv PLC
Aptiv PLC electrifies the future of driving by shaping vehicle connectivity and safety worldwide. Its cutting-edge electrical architectures and advanced safety systems set industry standards. Known for innovation, Aptiv’s products power everything from wiring harnesses to autonomous driving technologies. As the automotive sector accelerates toward electrification and automation, I question whether Aptiv’s fundamentals can sustain its premium valuation and growth in this fast-evolving landscape.

Table of contents
Business Model & Company Overview
Aptiv PLC, founded in 2011 and headquartered in Dublin, Ireland, stands as a global leader in the automotive parts industry. The company engineers a cohesive ecosystem of vehicle components, focusing on electrical, electronic, and safety technologies. Aptiv’s two segments—Signal and Power Solutions and Advanced Safety and User Experience—work in tandem to enhance vehicle architecture and integrate cutting-edge safety and connectivity features.
Aptiv’s revenue engine balances the production of hardware like connectors and wiring harnesses with software-driven solutions such as autonomous driving technologies. Its footprint spans the Americas, Europe, and Asia, enabling broad market access and diversified demand. This combination of integrated systems and global reach forms a robust competitive advantage, securing Aptiv’s role as an innovator shaping the future of automotive safety and connectivity.
Financial Performance & Fundamental Metrics
I analyze Aptiv PLC’s income statement, key financial ratios, and dividend payout policy to assess its profitability, efficiency, and shareholder returns.
Income Statement
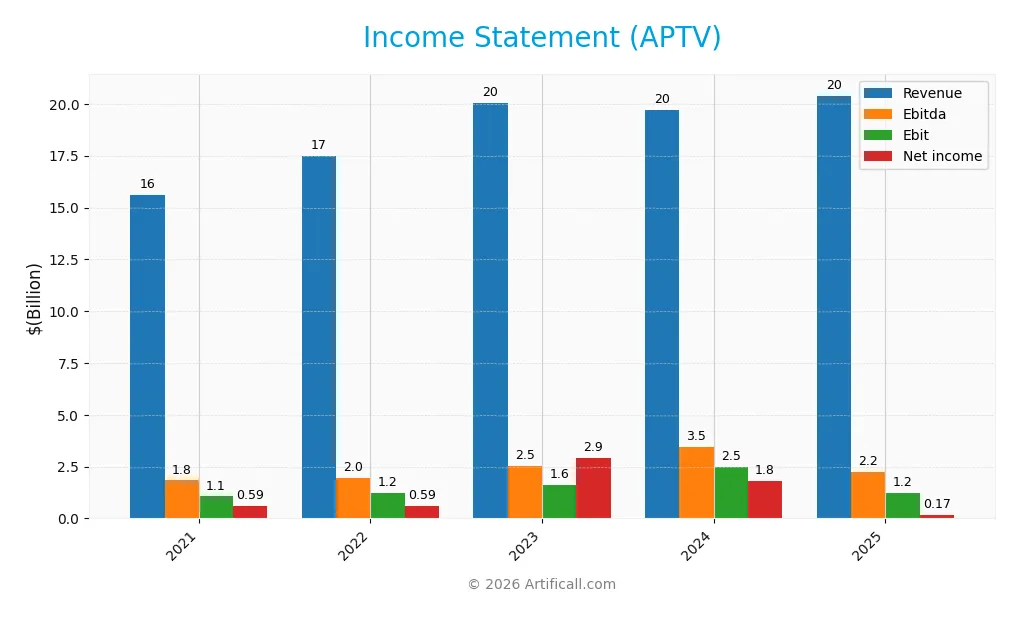
The table below summarizes Aptiv PLC’s key income statement metrics over the past five fiscal years, reflecting revenue growth and profitability trends.
| 2021 | 2022 | 2023 | 2024 | 2025 | |
|---|---|---|---|---|---|
| Revenue | 15.6B | 17.5B | 20.1B | 19.7B | 20.4B |
| Cost of Revenue | 13.3B | 15.0B | 17.0B | 16.2B | 16.5B |
| Operating Expenses | 1.1B | 1.1B | 1.4B | 1.5B | 2.7B |
| Gross Profit | 2.3B | 2.5B | 3.1B | 3.5B | 3.9B |
| EBITDA | 1.8B | 2.0B | 2.5B | 3.5B | 2.2B |
| EBIT | 1.1B | 1.2B | 1.6B | 2.5B | 1.2B |
| Interest Expense | 150M | 219M | 285M | 337M | 361M |
| Net Income | 590M | 594M | 2.9B | 1.8B | 165M |
| EPS | 1.95 | 1.96 | 10.5 | 6.97 | 0.75 |
| Filing Date | 2022-02-07 | 2023-02-08 | 2024-02-06 | 2025-02-07 | 2026-02-06 |
Income Statement Evolution
From 2021 to 2025, Aptiv PLC’s revenue rose 31% to 20.4B, signaling steady top-line growth. However, net income declined sharply by 72%, reflecting significant margin compression. Gross margin stabilized near 19%, but EBIT and net margins suffered steep declines, indicating rising costs and weakening profitability despite revenue gains.
Is the Income Statement Favorable?
In 2025, Aptiv reported a modest 0.8% net margin and 6.1% EBIT margin, both neutral by industry standards but down sharply year-over-year. Interest expenses were favorable at 1.77% of revenue, yet operating income and EPS dropped over 50% and 89%, respectively. Overall, fundamentals appear unfavorable due to declining profitability and earnings despite revenue stability.
Financial Ratios
The table below summarizes key financial ratios for Aptiv PLC over the last five fiscal years to provide a clear view of its performance trends:
| Ratios | 2021 | 2022 | 2023 | 2024 | 2025 |
|---|---|---|---|---|---|
| Net Margin | 3.8% | 3.4% | 14.7% | 9.1% | 0.8% |
| ROE | 7.1% | 6.7% | 25.4% | 20.3% | 1.8% |
| ROIC | 7.9% | 6.6% | 8.4% | 9.7% | 1.3% |
| P/E | 75.6 | 42.5 | 8.5 | 8.7 | 101.8 |
| P/B | 5.3 | 2.9 | 2.2 | 1.8 | 1.8 |
| Current Ratio | 2.0 | 1.6 | 1.7 | 1.5 | 1.7 |
| Quick Ratio | 1.5 | 1.1 | 1.2 | 1.1 | 1.2 |
| D/E | 0.53 | 0.79 | 0.59 | 1.01 | 0.86 |
| Debt-to-Assets | 24.8% | 31.8% | 27.8% | 37.9% | 33.9% |
| Interest Coverage | 8.5 | 6.2 | 5.8 | 6.1 | 3.3 |
| Asset Turnover | 0.87 | 0.80 | 0.82 | 0.84 | 0.87 |
| Fixed Asset Turnover | 4.2 | 4.4 | 4.6 | 4.7 | 4.8 |
| Dividend Yield | 0.14% | 0.25% | 0.13% | 0.00% | 0.04% |
Evolution of Financial Ratios
Aptiv’s Return on Equity (ROE) declined sharply from 25.4% in 2023 to 1.8% in 2025, reflecting weakening profitability. The Current Ratio improved moderately to 1.74 in 2025, indicating better short-term liquidity. Debt-to-Equity ratio fluctuated but settled near 0.86 in 2025, showing moderate leverage stability.
Are the Financial Ratios Favorable?
The 2025 ratios show mixed signals. Profitability metrics, including ROE (1.8%) and net margin (0.8%), appear unfavorable against sector norms. Liquidity ratios (Current 1.74, Quick 1.23) are favorable, indicating solid short-term financial health. Leverage and efficiency ratios, such as Debt-to-Equity (0.86) and Asset Turnover (0.87), are neutral. High P/E ratio (101.8) and low dividend yield (0.04%) raise valuation concerns. Overall, ratios lean slightly unfavorable.
Shareholder Return Policy
Aptiv PLC pays a modest dividend with a payout ratio of 3.6% in 2025 and a very low dividend yield of 0.04%. Dividend payments appear well covered by free cash flow, supporting sustainability. The company also engages in share buybacks, though detailed buyback data is not provided.
The low payout ratio and dividend yield suggest Aptiv prioritizes reinvestment or debt management over high distributions. This conservative approach aligns with maintaining financial flexibility and supports sustainable long-term shareholder value creation without risking excessive payouts or leverage.
Score analysis
The radar chart below illustrates Aptiv PLC’s valuation and financial health scores across key metrics:
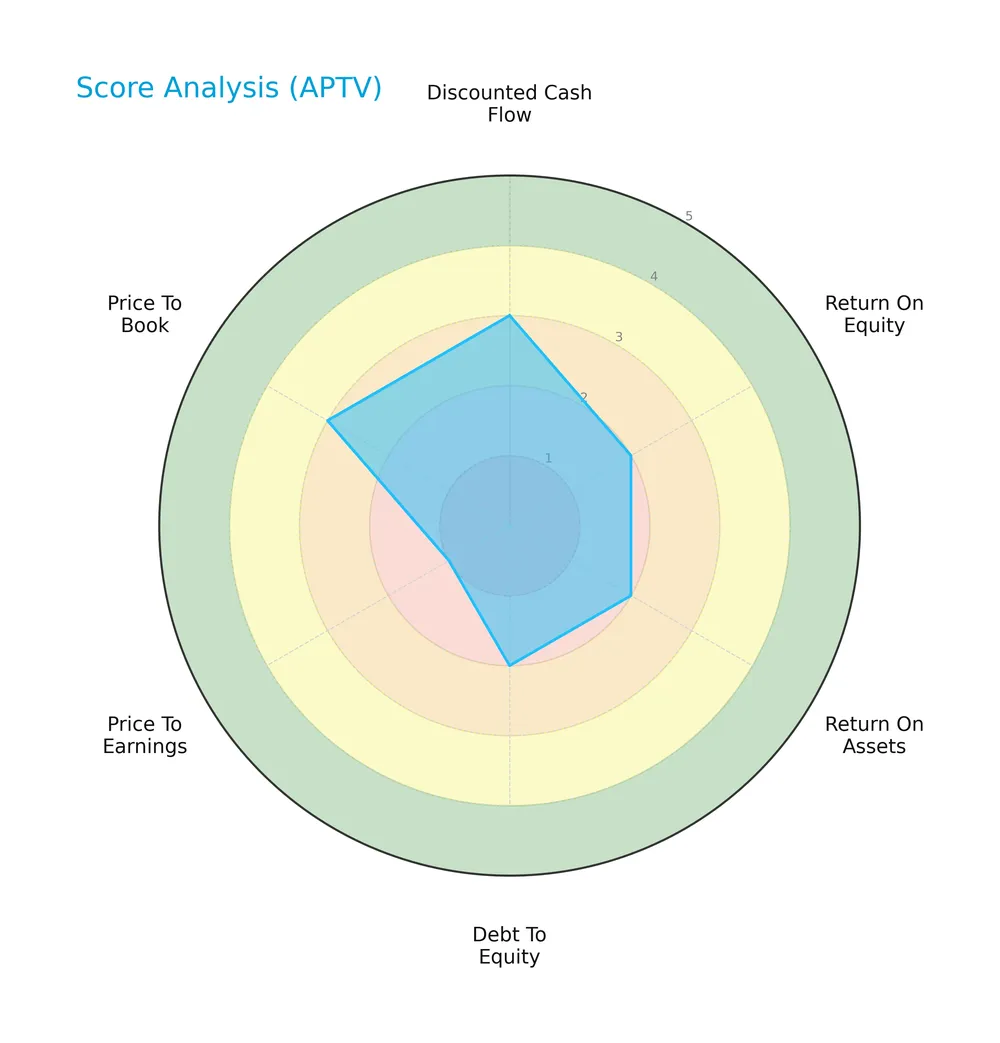
Aptiv scores moderately on discounted cash flow and price-to-book ratios. However, return on equity, assets, and debt-to-equity ratios are unfavorable. The price-to-earnings score is very unfavorable, signaling valuation concerns.
Analysis of the company’s bankruptcy risk
Aptiv’s Altman Z-Score places it in the grey zone, indicating a moderate risk of financial distress and potential bankruptcy:

Is the company in good financial health?
The Piotroski diagram displays Aptiv’s financial strength based on nine accounting criteria:

With a strong Piotroski score of 7, Aptiv demonstrates solid financial health, reflecting effective profitability and efficient use of resources.
Competitive Landscape & Sector Positioning
This analysis examines Aptiv PLC’s strategic position within the auto parts sector, focusing on its revenue segments and key products. I will assess whether Aptiv holds a competitive advantage over its main competitors based on its business model and product offerings.
Strategic Positioning
Aptiv PLC maintains a diversified product portfolio split between Signal and Power Solutions (14B in 2024) and Advanced Safety and User Experience (5.8B). Geographically, it balances exposure across the U.S. (6.9B), Europe/Middle East/Africa (6.5B), and Asia Pacific (5.7B), reflecting broad global reach.
Revenue by Segment
This pie chart illustrates Aptiv PLC’s revenue distribution by segment for the fiscal year 2024, highlighting the key business drivers within the company’s portfolio.
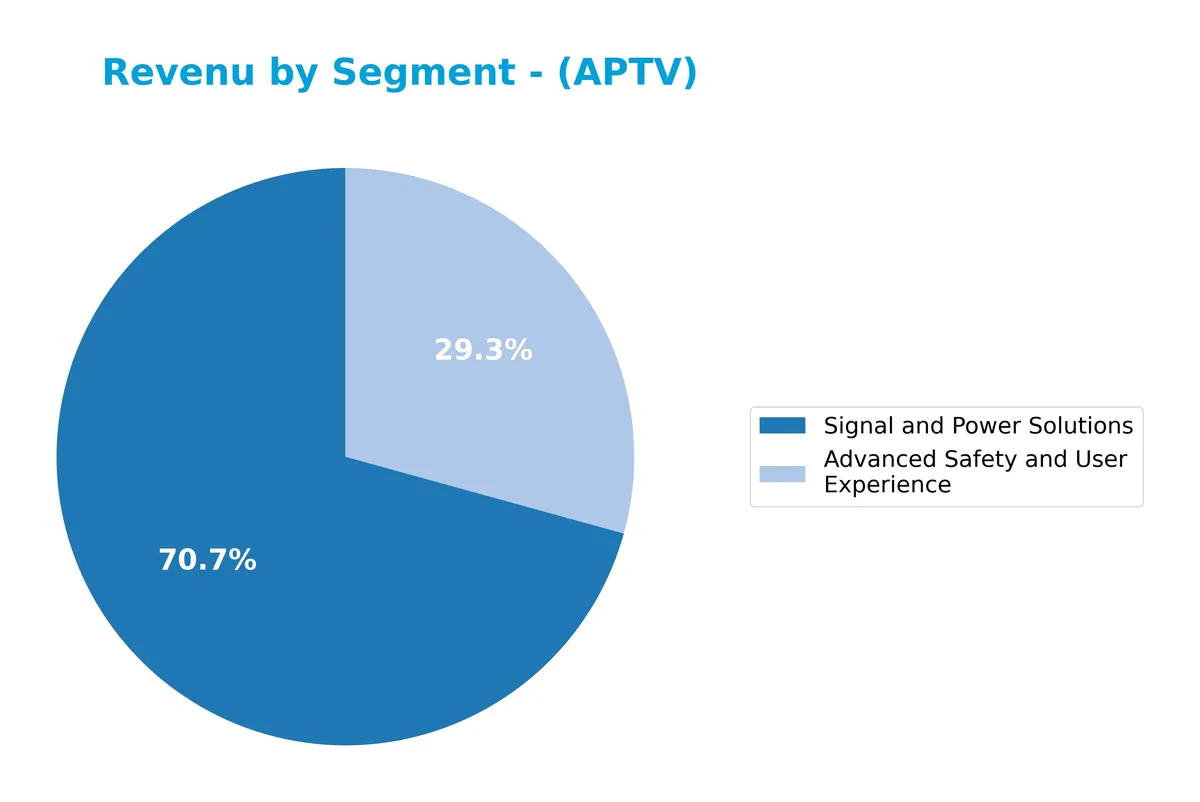
In 2024, Signal and Power Solutions remains Aptiv’s dominant segment with $13.98B, showing resilience despite a slight dip from 2023. Advanced Safety and User Experience grew to $5.79B, reflecting sustained momentum in innovation-driven offerings. The business shows a clear shift towards safety and user experience technologies, but Signal and Power Solutions still underpins the majority of revenue, indicating some concentration risk.
Key Products & Brands
The table below outlines Aptiv PLC’s main product segments and their descriptions:
| Product | Description |
|---|---|
| Signal and Power Solutions | Designs and manufactures vehicle electrical architecture, including connectors, wiring, harnesses, and high-voltage systems. |
| Advanced Safety and User Experience | Provides safety, security, comfort, and convenience systems, such as sensing, control units, connectivity, and autonomous driving tech. |
Aptiv PLC’s portfolio centers on electrical vehicle components and advanced safety systems. The Signal and Power Solutions segment dominates revenue, reflecting sustained demand for complex electrical architectures. Meanwhile, Advanced Safety shows steady growth, driven by rising safety and automation needs in automotive markets.
Main Competitors
There are 4 competitors in total, with the table listing the top 4 leaders by market capitalization:
| Competitor | Market Cap. |
|---|---|
| O’Reilly Automotive, Inc. | 76.3B |
| AutoZone, Inc. | 55.3B |
| Aptiv PLC | 16.9B |
| Mobileye Global Inc. | 8.5B |
Aptiv PLC ranks 3rd among its competitors, with a market cap 23.3% the size of the sector leader, O’Reilly Automotive. The company sits below both the average market cap of the top 10 (39.3B) and the median in the sector (36.1B). Aptiv maintains a substantial 210.4% gap below its nearest competitor above, indicating a notable scale difference within the group.
Comparisons with competitors
Check out how we compare the company to its competitors:
Does Aptiv have a competitive advantage?
Aptiv does not currently present a competitive advantage, as it is destroying value with a declining ROIC well below its WACC. This signals inefficient capital use and deteriorating profitability over the 2021-2025 period.
Looking ahead, Aptiv’s focus on advanced safety, user experience, and electrical architecture solutions positions it to capitalize on growing automotive technology trends. Expanding markets in Asia Pacific and continued product innovation offer potential growth opportunities despite current challenges.
SWOT Analysis
This SWOT analysis highlights Aptiv PLC’s key internal and external factors shaping its strategic position in 2026.
Strengths
- global footprint across Asia Pacific and EMEA
- advanced safety and autonomous driving tech
- strong presence in US automotive market
Weaknesses
- declining ROIC indicates value destruction
- negative net margin growth over period
- high P/E ratio signals overvaluation risk
Opportunities
- growth in electric and autonomous vehicle markets
- expanding connectivity and software integration
- increasing safety regulations worldwide
Threats
- intense competition in auto parts
- macroeconomic uncertainties impacting vehicle demand
- supply chain disruptions and raw material cost inflation
Aptiv leverages its technological edge and global reach but faces profitability pressures and valuation concerns. Strategic focus must prioritize margin recovery and innovation to capitalize on EV and autonomous vehicle growth while managing external volatility.
Stock Price Action Analysis
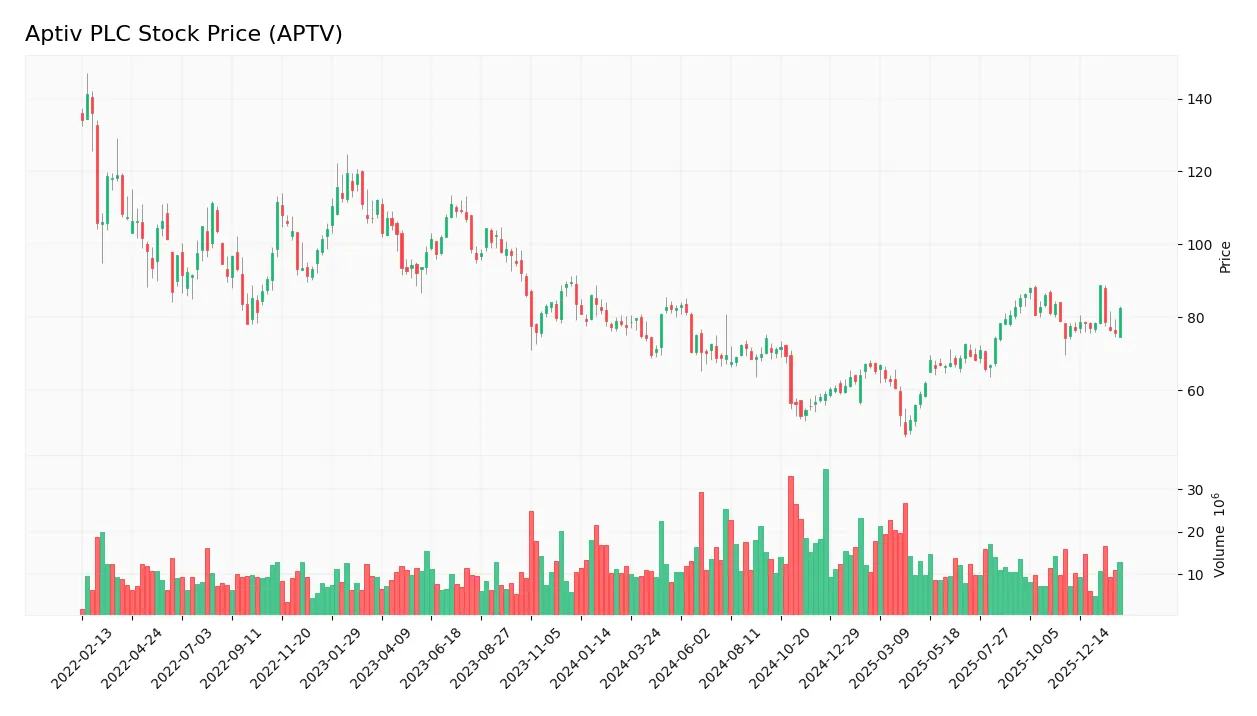
The weekly chart for Aptiv PLC (APTV) shows the stock’s price evolution and key support and resistance levels over the past 12 months:
Trend Analysis
Over the past 12 months, APTV’s stock price rose 6.65%, indicating a bullish trend with acceleration. The price ranged between 47.92 and 88.67, reflecting significant volatility (9.13% std deviation). Recent three-month data show an 11.13% gain with a steady upward slope (0.37), confirming strengthened momentum.
Volume Analysis
Trading volume over the last three months shows seller dominance, with buyers accounting for only 35.05% of activity. Volume is decreasing, suggesting waning market participation. This decline, combined with seller control, hints at cautious or defensive investor sentiment despite recent price gains.
Target Prices
Analysts show a moderately bullish outlook for Aptiv PLC with a clear target price consensus.
| Target Low | Target High | Consensus |
|---|---|---|
| 84 | 110 | 98.89 |
The target range suggests upside potential near 10% from current levels, reflecting confidence in Aptiv’s growth and market positioning.

Don’t Let Luck Decide Your Entry Point
Optimize your entry points with our advanced ProRealTime indicators. You’ll get efficient buy signals with precise price targets for maximum performance. Start outperforming now!
Analyst & Consumer Opinions
This section examines Aptiv PLC’s recent analyst ratings and consumer feedback to provide a balanced overview.
Stock Grades
The following table shows recent verified stock grades from leading financial institutions for Aptiv PLC:
| Grading Company | Action | New Grade | Date |
|---|---|---|---|
| Wells Fargo | Maintain | Overweight | 2026-02-03 |
| RBC Capital | Maintain | Outperform | 2026-02-03 |
| Oppenheimer | Maintain | Outperform | 2026-02-03 |
| Oppenheimer | Maintain | Outperform | 2026-01-21 |
| UBS | Maintain | Neutral | 2026-01-14 |
| Piper Sandler | Upgrade | Overweight | 2026-01-08 |
| Wells Fargo | Maintain | Overweight | 2025-12-09 |
| Morgan Stanley | Upgrade | Equal Weight | 2025-12-08 |
| RBC Capital | Maintain | Outperform | 2025-11-19 |
| Wells Fargo | Maintain | Overweight | 2025-10-31 |
Grades consistently favor Aptiv with several “Outperform” and “Overweight” ratings. Upgrades from Piper Sandler and Morgan Stanley indicate improving sentiment, while UBS remains neutral, reflecting some caution.
Consumer Opinions
Consumers express a mix of admiration and frustration toward Aptiv PLC, revealing key insights into customer experience.
| Positive Reviews | Negative Reviews |
|---|---|
| “Aptiv’s innovative automotive tech impresses with reliability and smart design.” | “Customer service response times are often slow and unhelpful.” |
| “Products enhance vehicle safety and connectivity seamlessly.” | “Pricing feels steep compared to competitors.” |
| “Strong focus on sustainability appeals to eco-conscious buyers.” | “Occasional delays in product delivery disrupt project timelines.” |
Overall, consumers praise Aptiv’s cutting-edge technology and sustainability efforts. However, concerns about customer support and pricing persist, signaling areas needing strategic improvement.
Risk Analysis
Below is a summary table highlighting key risks Aptiv PLC faces, categorized by type, likelihood, and potential impact:
| Category | Description | Probability | Impact |
|---|---|---|---|
| Market Volatility | Aptiv’s beta of 1.5 signals above-average sensitivity to market swings. | High | Moderate |
| Profitability | Low net margin (0.81%) and ROIC (1.32%) well below WACC (8.57%) indicate weak profitability. | High | High |
| Valuation Risk | Extremely high P/E ratio (101.8) suggests stock may be overvalued, increasing correction risk. | High | High |
| Financial Health | Altman Z-Score in the grey zone (2.38) shows moderate bankruptcy risk under stress scenarios. | Moderate | High |
| Debt Levels | Debt-to-equity of 0.86 and interest coverage of 3.44 are neutral but warrant monitoring. | Moderate | Moderate |
| Dividend Policy | Near-zero dividend yield (0.04%) may deter income-focused investors. | Low | Low |
Profitability and valuation stand as the most pressing risks. Aptiv’s inability to generate returns above its cost of capital threatens long-term value. The high P/E ratio could expose the stock to sharp corrections if growth disappoints. The grey-zone Altman Z-Score adds caution amid cyclical auto industry pressures. I advise careful risk management given these vulnerabilities.
Should You Buy Aptiv PLC?
Aptiv PLC appears to be a company with declining profitability and a very unfavorable moat, suggesting value destruction. Despite a manageable leverage profile, overall financial health rates a cautious C+, indicating risk amid operational challenges.
Strength & Efficiency Pillars
Aptiv PLC posts modest operational margins with a gross margin of 19.11% and an EBIT margin of 6.09%. Interest expense remains low at 1.77%, reflecting manageable financing costs. However, profitability metrics are weak; net margin (0.81%), ROE (1.79%), and ROIC (1.32%) all underperform, failing to exceed the WACC of 8.57%. This signals the company is not generating sufficient returns over its cost of capital, indicating value erosion rather than creation.
Weaknesses and Drawbacks
Aptiv faces elevated financial risk as its Altman Z-Score stands at 2.38, placing it in the “Grey Zone”—a warning of moderate bankruptcy risk. The valuation appears stretched, with a P/E ratio of 101.8 signaling a high premium that may not be justified by earnings. Leverage metrics are mediocre; debt-to-equity at 0.86 and a current ratio of 1.74 suggest average balance sheet flexibility. Recent market action shows seller dominance at 35.05% buyers, potentially pressuring near-term price momentum.
Our Final Verdict about Aptiv PLC
Despite some operational stability, Aptiv’s financial profile remains cautious due to its moderate solvency risk flagged by the Altman Z-Score. The bullish long-term price trend contrasts with recent seller dominance, suggesting investors might adopt a wait-and-see stance. The company’s value destruction and stretched valuation imply that Aptiv could be too risky for conservative capital, although it may appear intriguing for selective long-term exposure.
Disclaimer: This content is for informational purposes only and does not constitute financial, investment, or other professional advice. Investing in financial markets involves a significant risk of loss, and past performance is not indicative of future results.
Additional Resources
- Aptiv PLC (APTV): A Bull Case Theory – Yahoo Finance (Feb 04, 2026)
- Aptiv PLC SEC 10-K Report – TradingView (Feb 06, 2026)
- Aptiv PLC (NYSE:APTV) Q4 2025 earnings call transcript – MSN (Feb 02, 2026)
- Aptiv PLC (NYSE:APTV) Reports Mixed Q4 2025 Results, Misses Revenue Estimates – Chartmill (Feb 02, 2026)
- Wells Fargo Maintains Aptiv PLC(APTV.US) With Buy Rating, Raises Target Price to $102 – 富途牛牛 (Feb 03, 2026)
For more information about Aptiv PLC, please visit the official website: aptiv.com