Home > Analyses > Healthcare > AptarGroup, Inc.
AptarGroup, Inc. shapes daily life through its innovative dispensing and sealing solutions across healthcare, beauty, and food industries. Its pumps and valves play a crucial role in delivering medicines and consumer products with precision and safety. As a market leader known for quality and cutting-edge material science, AptarGroup drives efficiency and sustainability in packaging. The key question now is whether its strong fundamentals can sustain growth amid evolving market demands and valuation pressures.

Table of contents
Business Model & Company Overview
AptarGroup, Inc. stands as a global leader in dispensing and sealing solutions across medical, beauty, and food sectors. Founded in 1992 and headquartered in Crystal Lake, Illinois, the company weaves a cohesive ecosystem of pumps, valves, and closures tailored for pharmaceutical, personal care, and consumer markets. Its integrated approach drives innovation in respiratory care and sustainable packaging, reinforcing its prominence in the medical instruments industry.
The company generates revenue through a balanced mix of proprietary hardware components and material science innovations, supported by recurring demand from global markets including the Americas, Europe, and Asia. AptarGroup’s Pharma, Beauty + Home, and Food + Beverage segments leverage strategic partnerships to enhance product sustainability and digital health services. This multi-segment diversification builds a durable economic moat, positioning AptarGroup as a key architect of its industry’s future.
Financial Performance & Fundamental Metrics
I analyze AptarGroup, Inc.’s income statement, key financial ratios, and dividend payout policy to assess its core financial health and shareholder value.
Income Statement
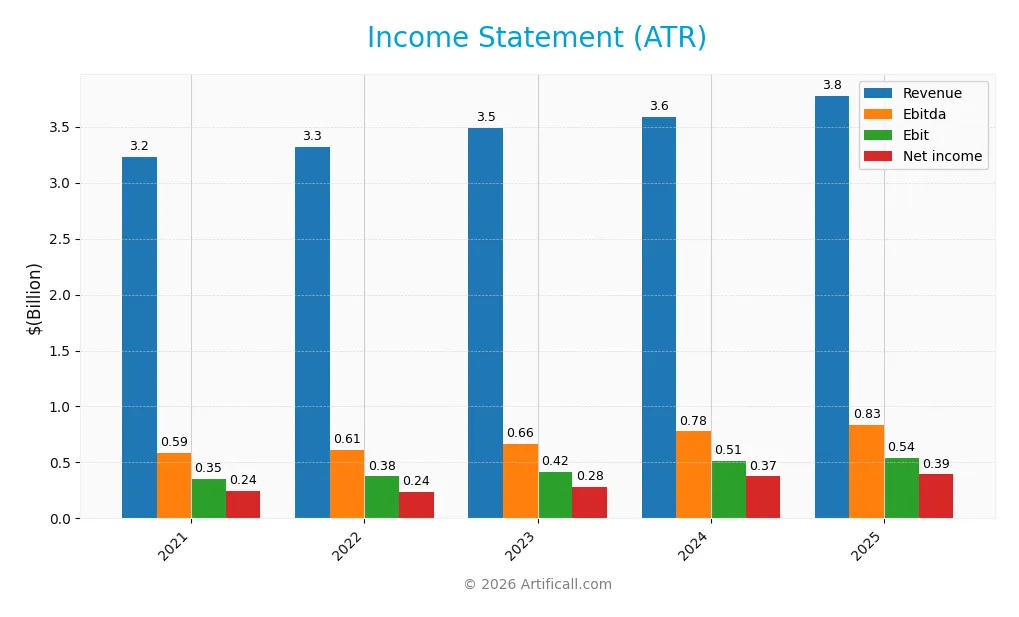
The table below summarizes AptarGroup, Inc.’s key income statement figures for the fiscal years 2021 through 2025, reported in USD.
| 2021 | 2022 | 2023 | 2024 | 2025 | |
|---|---|---|---|---|---|
| Revenue | 3.23B | 3.32B | 3.49B | 3.58B | 3.78B |
| Cost of Revenue | 2.07B | 2.16B | 2.22B | 2.23B | 2.66B |
| Operating Expenses | 809M | 785M | 859M | 859M | 606M |
| Gross Profit | 1.16B | 1.16B | 1.26B | 1.36B | 1.12B |
| EBITDA | 587M | 609M | 664M | 777M | 831M |
| EBIT | 352M | 376M | 415M | 514M | 544M |
| Interest Expense | 30M | 41M | 40M | 44M | 53M |
| Net Income | 244M | 239M | 284M | 375M | 393M |
| EPS | 3.72 | 3.66 | 4.34 | 5.65 | 5.97 |
| Filing Date | 2022-02-18 | 2023-02-17 | 2024-02-09 | 2025-02-07 | 2026-02-05 |
Income Statement Evolution
AptarGroup’s revenue rose steadily from $3.23B in 2021 to $3.78B in 2025, marking a 17% growth over five years. Net income surged 61% to $393M, with net margins improving by 37%. Despite a 17.6% decline in gross profit in 2025, EBIT and EPS both grew around 6%, reflecting stable operational efficiency and margin resilience.
Is the Income Statement Favorable?
In 2025, AptarGroup posted a gross margin of 29.6% and an EBIT margin of 14.4%, both favorable versus sector norms. Interest expenses remained low at 1.4% of revenue, supporting net margins of 10.4%. While revenue growth slowed to 5.4%, EPS increased 6.5%, indicating effective capital allocation. Overall, the income statement fundamentals appear favorable with manageable risks.
Financial Ratios
The following table presents key financial ratios for AptarGroup, Inc. over the past five fiscal years, illustrating its profitability, liquidity, leverage, and market valuation metrics:
| Ratios | 2021 | 2022 | 2023 | 2024 | 2025 |
|---|---|---|---|---|---|
| Net Margin | 7.6% | 7.2% | 8.2% | 10.5% | 10.4% |
| ROE | 12.4% | 11.7% | 12.3% | 15.2% | N/A |
| ROIC | 7.6% | 8.0% | 8.4% | 10.7% | N/A |
| P/E | 32.9 | 30.1 | 28.5 | 27.8 | 20.4 |
| P/B | 4.08 | 3.50 | 3.52 | 4.22 | 0 |
| Current Ratio | 1.38 | 1.56 | 1.24 | 1.38 | 0 |
| Quick Ratio | 0.93 | 1.03 | 0.83 | 0.95 | 0 |
| D/E | 0.63 | 0.59 | 0.51 | 0.44 | 0 |
| Debt-to-Assets | 30.1% | 29.1% | 26.6% | 24.3% | 0 |
| Interest Coverage | 11.5 | 9.3 | 10.0 | 11.3 | -9.5 |
| Asset Turnover | 0.78 | 0.79 | 0.78 | 0.81 | 0 |
| Fixed Asset Turnover | 2.41 | 2.37 | 2.27 | 2.37 | 0 |
| Dividend Yield | 1.22% | 1.38% | 1.28% | 1.09% | 1.50% |
Evolution of Financial Ratios
From 2021 to 2025, AptarGroup, Inc.’s Return on Equity (ROE) showed a decline, reaching zero in 2025. The Current Ratio fluctuated but was notably absent in 2025 data, suggesting liquidity reporting gaps. Debt-to-Equity Ratios improved steadily, falling to zero by 2025. Profitability margins remained relatively stable, with net margins around 10.4% in the latest year.
Are the Financial Ratios Fovorable?
In 2025, AptarGroup’s profitability, indicated by a favorable net margin of 10.4%, contrasts with an unfavorable ROE and ROIC of zero. Liquidity ratios are unfavorable due to missing values in Current and Quick Ratios. Leverage metrics, including Debt-to-Equity and Debt-to-Assets, are favorable, supported by solid interest coverage of 10.32. Market valuation ratios, such as P/E at 20.41 and dividend yield at 1.5%, are neutral. Overall, the financial ratios present a balanced but cautious profile.
Shareholder Return Policy
AptarGroup, Inc. pays regular dividends with a payout ratio around 30%, yielding approximately 1.5% annually. Dividend per share has steadily increased, supported by consistent net profits and moderate payout coverage. The company also engages in share buybacks, enhancing shareholder value.
This balanced distribution approach reflects prudent capital allocation, maintaining sustainable dividends without risking cash flow strain. The combination of dividends and buybacks supports long-term shareholder value, aligning with AptarGroup’s stable profitability and financial discipline.
Score analysis
The following radar chart illustrates AptarGroup, Inc.’s key financial scores across valuation, profitability, and leverage metrics:
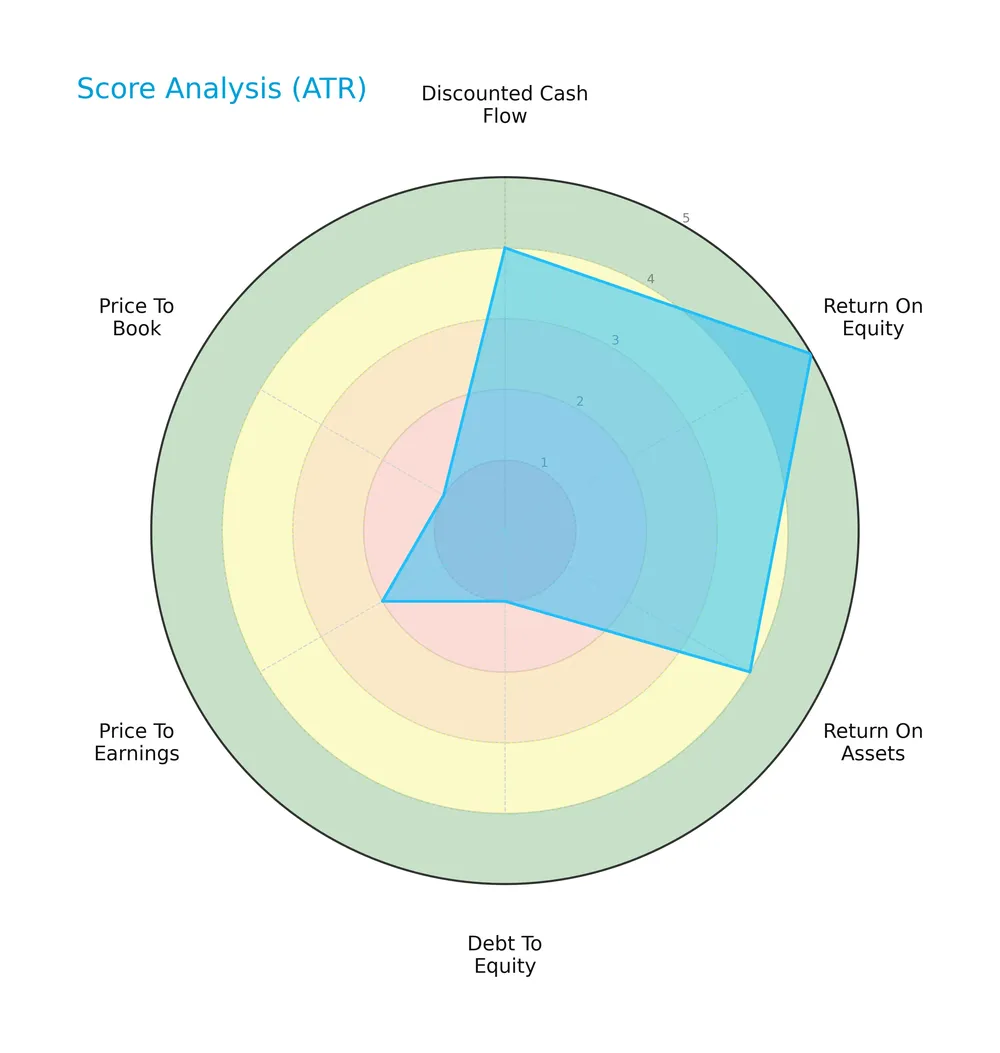
The company shows strong profitability with a very favorable ROE score of 5 and a favorable ROA score of 4. However, its capital structure raises concerns, evidenced by a very unfavorable debt-to-equity score of 1. Valuation metrics like PE and PB scores also remain weak.
Analysis of the company’s bankruptcy risk
AptarGroup’s Altman Z-Score places it firmly in the safe zone, indicating a low bankruptcy risk and stable financial health:

Is the company in good financial health?
The Piotroski F-Score diagram provides insight into the company’s overall financial strength based on nine key criteria:

With a Piotroski score of 6, AptarGroup shows average financial health, suggesting moderate strength but room for improvement in profitability and efficiency factors.
Competitive Landscape & Sector Positioning
This sector analysis examines AptarGroup, Inc.’s strategic positioning, revenue segments, and key products within healthcare. I will assess its competitive advantages relative to main industry players.
Strategic Positioning
AptarGroup maintains a diversified product portfolio across Pharma, Beauty + Home, and Food + Beverage segments, with 2022 revenues of $1.37B, $1.46B, and $524M respectively. Geographically, it operates globally, generating over $1B in the US and substantial sales across Europe and Asia.
Revenue by Segment
The pie chart illustrates AptarGroup’s revenue distribution by product segment for fiscal year 2022, highlighting key contributors to its overall sales.
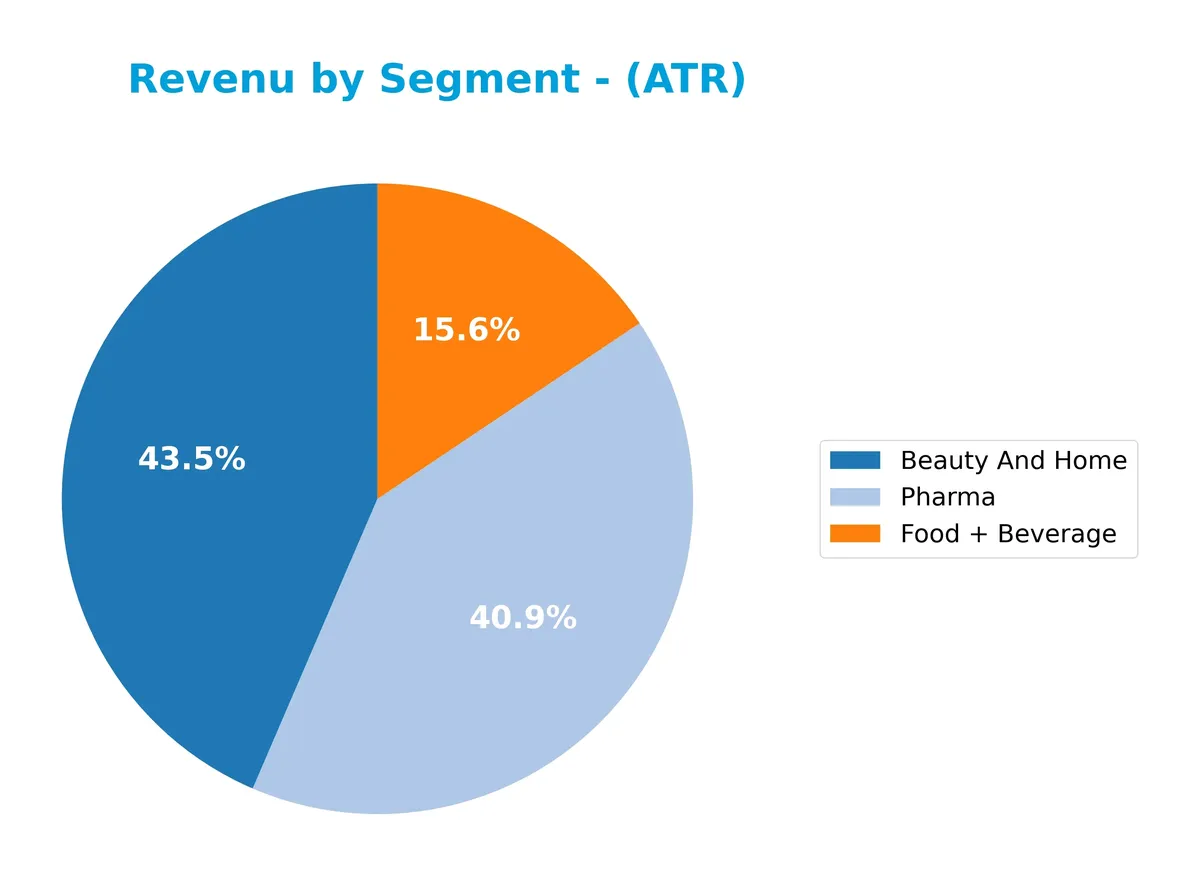
In 2022, Beauty And Home leads with $1.46B, closely followed by Pharma at $1.37B, while Food + Beverage contributes $524M. Historically, Beauty And Home and Pharma consistently drive revenue growth. The slight acceleration in Pharma suggests rising demand, but reliance on these two segments implies some concentration risk if market conditions shift. Food + Beverage remains a smaller, stable contributor without major volatility.
Key Products & Brands
AptarGroup’s key products and brands span three primary market segments, as detailed below:
| Product | Description |
|---|---|
| Pharma | Pumps for nasal allergy treatments, metered dose inhaler valves, elastomer for injectable packaging, and active material science solutions for respiratory and pharmaceutical uses. |
| Beauty + Home | Pumps, closures, aerosol valves, accessories, sealing solutions for personal care and home care, plus decorative components for the beauty market. |
| Food + Beverage | Dispensing and non-dispensing closures, elastomeric flow control components, spray pumps, and aerosol valves for food and beverage applications. |
AptarGroup’s portfolio covers critical dispensing and sealing technologies tailored to healthcare, beauty, and food sectors. This diversified product mix supports stable revenue streams across different end markets.
Main Competitors
There are 8 competitors in the Healthcare Medical – Instruments & Supplies sector. The table below lists the top 8 leaders by market capitalization:
| Competitor | Market Cap. |
|---|---|
| Intuitive Surgical, Inc. | 201B |
| Becton, Dickinson and Company | 56B |
| ResMed Inc. | 36B |
| West Pharmaceutical Services, Inc. | 20B |
| Hologic, Inc. | 16.6B |
| The Cooper Companies, Inc. | 16.1B |
| Baxter International Inc. | 10B |
| AptarGroup, Inc. | 8.1B |
AptarGroup, Inc. ranks 8th among its peers, with a market cap just 4.41% of the sector leader Intuitive Surgical, Inc. It sits below both the average market cap of the top 10 competitors (45.4B) and the sector median (18.3B). AptarGroup maintains a 13.27% gap to the next competitor above, Baxter International Inc., highlighting a notable scale difference.
Comparisons with competitors
Check out how we compare the company to its competitors:
Does AptarGroup have a competitive advantage?
AptarGroup currently lacks a competitive advantage, evidenced by a negative ROIC compared to WACC and a sharply declining ROIC trend between 2021 and 2025. This indicates the company destroys value and has no excess capital to reinvest in growth.
Looking ahead, AptarGroup explores opportunities through partnerships in recycled polypropylene and digital therapies, targeting respiratory and other diseases. These initiatives could open new markets and enhance product offerings in Pharma, Beauty + Home, and Food + Beverage segments.
SWOT Analysis
This SWOT analysis highlights AptarGroup’s key strategic factors to guide investors in evaluating its growth and risks.
Strengths
- diversified product portfolio across Pharma, Beauty, Food
- strong market presence in US and Europe
- favorable profit margins and stable dividend
Weaknesses
- declining ROIC signaling value destruction
- weak liquidity ratios
- high dependence on mature markets
Opportunities
- innovation in digital therapies and recycled materials
- expanding demand in emerging markets
- strategic partnerships enhancing product pipeline
Threats
- global supply chain disruptions
- regulatory pressures in pharma
- intensifying competition in personal care
AptarGroup’s strengths in diversified markets and stable profits underpin its resilience. However, declining capital efficiency demands strategic focus on innovation and emerging markets to sustain growth and mitigate liquidity and competitive risks.
Stock Price Action Analysis
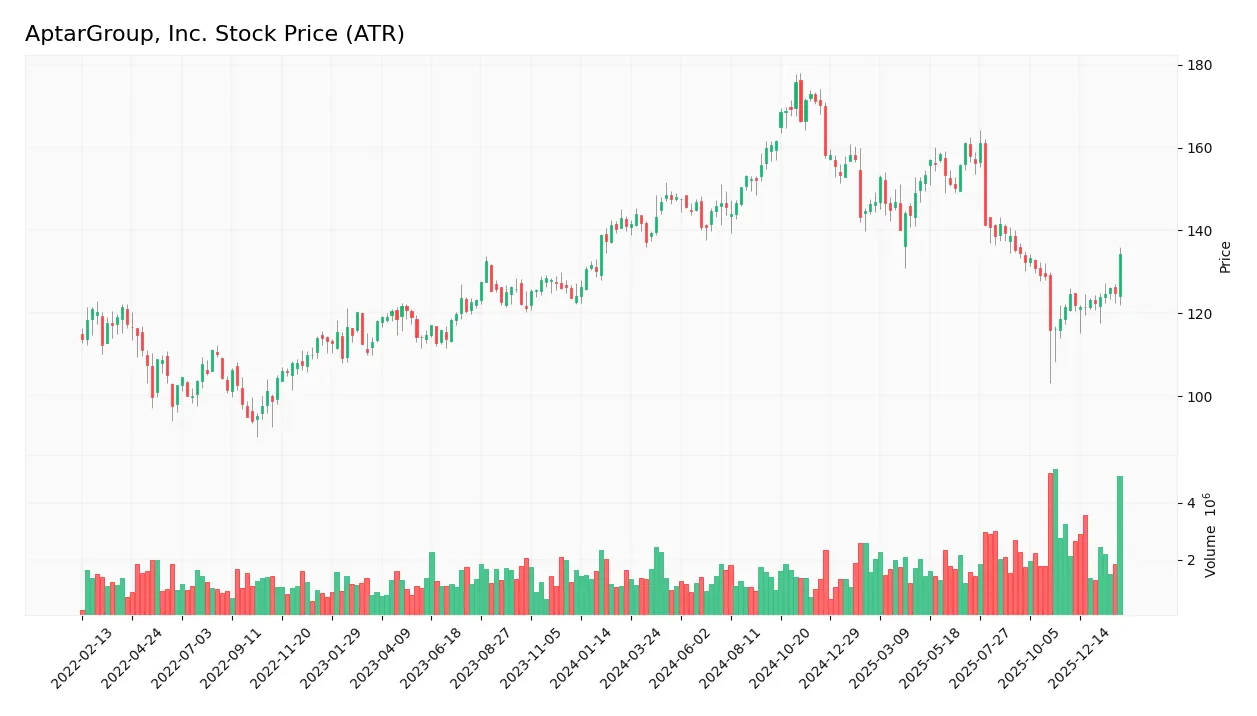
The weekly stock chart for AptarGroup, Inc. (ATR) displays price movements and key levels over the past 100 weeks:
Trend Analysis
Over the past 12 months, ATR’s stock price declined by 4.74%, indicating a bearish trend with accelerating downward momentum. The price fluctuated between a high of 175.76 and a low of 116.01, reflecting significant volatility with a standard deviation of 13.76.
Volume Analysis
Trading volume has increased recently, totaling 210M shares, with buyers accounting for 52.38%. Over the last three months, volume remains slightly buyer-dominant at 59.14%, suggesting cautious optimism and growing market participation.
Target Prices
Analysts set a clear target consensus for AptarGroup, Inc. that reflects moderate growth expectations.
| Target Low | Target High | Consensus |
|---|---|---|
| 133 | 220 | 166 |
The target range from 133 to 220 indicates varied optimism, with a 166 consensus suggesting steady upside potential.

Don’t Let Luck Decide Your Entry Point
Optimize your entry points with our advanced ProRealTime indicators. You’ll get efficient buy signals with precise price targets for maximum performance. Start outperforming now!
Analyst & Consumer Opinions
This section examines AptarGroup, Inc.’s analyst grades and consumer feedback to provide balanced market perspectives.
Stock Grades
Here are the latest verified stock grades from established analysts for AptarGroup, Inc.:
| Grading Company | Action | New Grade | Date |
|---|---|---|---|
| Wells Fargo | Downgrade | Equal Weight | 2026-01-06 |
| Wells Fargo | Maintain | Overweight | 2025-11-03 |
| Baird | Maintain | Outperform | 2025-11-03 |
| Wells Fargo | Maintain | Overweight | 2025-09-10 |
| Raymond James | Maintain | Outperform | 2025-08-04 |
| Wells Fargo | Maintain | Overweight | 2025-08-04 |
| Wells Fargo | Maintain | Overweight | 2025-07-18 |
| Raymond James | Maintain | Outperform | 2025-07-15 |
| Wells Fargo | Maintain | Overweight | 2025-05-06 |
| Raymond James | Maintain | Outperform | 2025-04-22 |
The overall trend shows a predominantly positive stance with multiple Outperform and Overweight ratings. However, the recent downgrade by Wells Fargo to Equal Weight signals some caution among analysts.
Consumer Opinions
Consumer sentiment around AptarGroup, Inc. (ATR) reflects a mix of strong product reliability and concerns about pricing.
| Positive Reviews | Negative Reviews |
|---|---|
| Consistently high-quality packaging | Higher prices compared to competitors |
| Innovative designs improve usability | Occasional delays in order fulfillment |
| Excellent customer service support | Limited customization options |
Overall, customers praise AptarGroup’s product innovation and service but express frustration with cost and supply chain delays. These points highlight the company’s strengths in quality and customer care, alongside areas needing operational improvements.
Risk Analysis
Below is a summary table of AptarGroup, Inc.’s key risks and their assessed likelihood and potential impact:
| Category | Description | Probability | Impact |
|---|---|---|---|
| Liquidity Risk | Current and quick ratios are zero, indicating potential short-term liquidity issues. | High | High |
| Profitability Risk | ROE and ROIC at 0%, signaling weak returns on equity and capital invested. | Medium | High |
| Valuation Risk | P/E ratio at 20.41 with unfavorable P/B metrics points to valuation concerns. | Medium | Medium |
| Leverage Risk | Debt-to-equity score is very unfavorable, raising concerns about financial leverage. | Medium | Medium |
| Market Risk | Beta of 0.485 suggests lower volatility, but sector cyclicality remains a factor. | Low | Medium |
Liquidity and profitability risks are the most pressing. Despite a safe Altman Z-Score of 3.24, the zero current and quick ratios highlight potential cash flow constraints. Meanwhile, zero ROE and ROIC indicate that capital is not generating expected returns, which could pressure valuation and investor confidence.
Should You Buy AptarGroup, Inc.?
AptarGroup, Inc. appears to be a company with moderate profitability and a deteriorating competitive moat, suggesting value destruction. Despite significant leverage risks, its overall rating could be seen as moderately favorable, reflecting a cautious investment profile.
Strength & Efficiency Pillars
AptarGroup, Inc. reports a solid net margin of 10.4%, supported by a favorable gross margin of 29.58% and an EBIT margin of 14.41%. The company maintains a strong interest coverage ratio of 10.32, reflecting efficient debt servicing. However, its return on equity and return on invested capital are unfavorable, with ROIC failing to exceed the WACC of 5.77%, indicating it is not currently a value creator. Operational profitability remains a bright spot amid these challenges.
Weaknesses and Drawbacks
AptarGroup faces valuation and leverage pressures, with a debt-to-equity ratio rated very unfavorable, signaling elevated financial risk. The price-to-earnings ratio of 20.41 is neutral but requires scrutiny given other weaknesses. Liquidity metrics, including current and quick ratios, are unfavorable, suggesting potential short-term funding challenges. These factors, coupled with mixed market sentiment despite increasing volume, introduce headwinds that investors should weigh carefully.
Our Final Verdict about AptarGroup, Inc.
AptarGroup’s financial profile might appear stable due to its safe Altman Z-Score of 3.24, yet operational and capital efficiency concerns moderate enthusiasm. Despite recent slight buyer dominance and improving price trends, the bearish overall stock trend advises caution. This profile suggests a wait-and-see approach for a better entry point rather than immediate commitment.
Disclaimer: This content is for informational purposes only and does not constitute financial, investment, or other professional advice. Investing in financial markets involves a significant risk of loss, and past performance is not indicative of future results.
Additional Resources
- AptarGroup Inc (ATR) Q4 2025 Earnings Call Highlights: Strong Re – GuruFocus (Feb 06, 2026)
- AptarGroup (ATR) Reports Q4 Earnings: What Key Metrics Have to Say – Yahoo Finance (Feb 06, 2026)
- AptarGroup declares $0.48 dividend – MSN (Feb 06, 2026)
- APTARGROUP, INC. SEC 10-K Report – TradingView (Feb 06, 2026)
- AptarGroup (ATR) Releases Q4 2025 Earnings: Revenue Growth but EPS Miss – Quiver Quantitative (Feb 05, 2026)
For more information about AptarGroup, Inc., please visit the official website: aptar.com