Home > Analyses > Technology > AppLovin Corporation
AppLovin transforms how mobile apps reach users and generate revenue worldwide. Its software platform empowers developers with cutting-edge marketing, analytics, and in-app bidding tools. Known for innovation, AppLovin dominates application software by optimizing ad monetization and user engagement. As the mobile ecosystem evolves rapidly, I ask: does AppLovin’s blend of technology and scale still justify its premium valuation and growth expectations in 2026?
Table of contents
Business Model & Company Overview
AppLovin Corporation, founded in 2011 and headquartered in Palo Alto, California, commands a leading position in the software application industry. Its ecosystem integrates marketing and monetization tools tailored for mobile app developers, uniting advertiser demand with publisher supply through advanced auction technology. This cohesive platform streamlines app growth and revenue optimization, making it a vital partner for advertisers and publishers worldwide.
The company’s revenue engine balances cutting-edge software solutions like AppDiscovery, Adjust, and MAX to drive value across Americas, Europe, and Asia. These platforms blend real-time bidding, analytics, and user data protection to maximize ad inventory efficiency and campaign performance. AppLovin’s robust technological moat positions it as a key architect of the mobile app marketing landscape’s future.
Financial Performance & Fundamental Metrics
I analyze AppLovin Corporation’s income statement, key financial ratios, and dividend payout policy to assess its core profitability and capital allocation discipline.
Income Statement
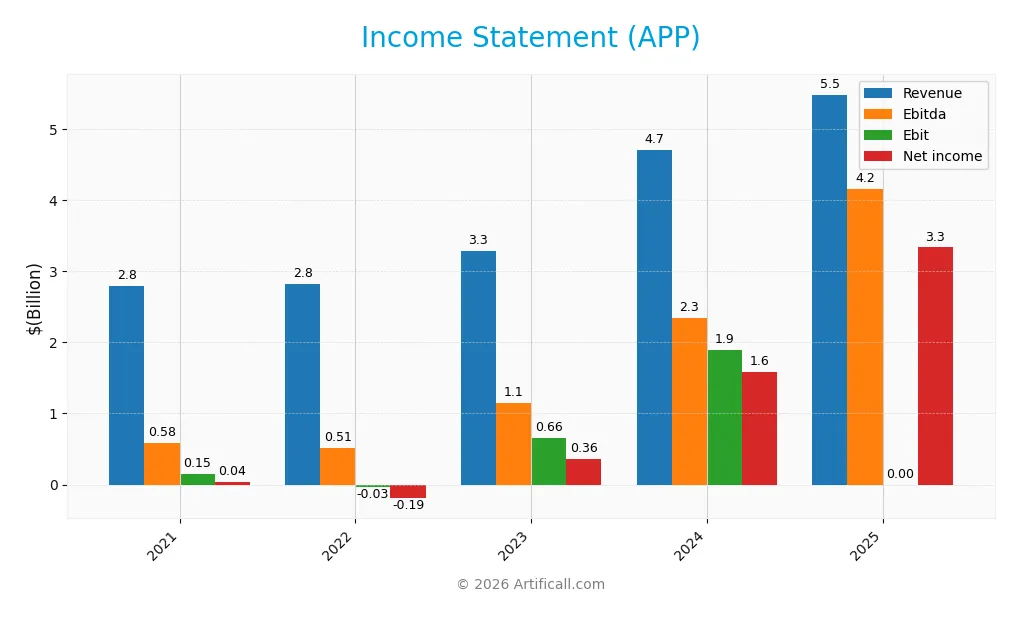
Below is AppLovin Corporation’s Income Statement for fiscal years 2021 through 2025, showing key profitability and expense metrics in USD.
| 2021 | 2022 | 2023 | 2024 | 2025 | |
|---|---|---|---|---|---|
| Revenue | 2.79B | 2.82B | 3.28B | 4.71B | 5.48B |
| Cost of Revenue | 988M | 1.26B | 1.06B | 1.17B | 665M |
| Operating Expenses | 1.65B | 1.61B | 1.58B | 1.67B | 664M |
| Gross Profit | 1.81B | 1.56B | 2.22B | 3.54B | 4.82B |
| EBITDA | 581M | 514M | 1.15B | 2.34B | 4.35B |
| EBIT | 149M | (33M) | 656M | 1.89B | 4.15B |
| Interest Expense | 103M | 172M | 276M | 318M | 207M |
| Net Income | 35M | (193M) | 357M | 1.58B | 3.33B |
| EPS | 0.10 | (0.52) | 1.01 | 4.68 | 9.84 |
| Filing Date | 2022-03-11 | 2023-02-28 | 2024-02-26 | 2025-02-27 | 2026-02-19 |
Income Statement Evolution
From 2021 to 2025, AppLovin’s revenue nearly doubled, rising 96% to $5.48B. Net income surged from $32M to $3.33B, reflecting an extraordinary 9305% increase. Margins expanded significantly, with gross margin reaching 87.9% and net margin climbing above 60%. Operating efficiency improved, evidenced by a 75.8% EBIT margin.
Is the Income Statement Favorable?
In 2025, AppLovin posted $5.48B revenue and $3.33B net income, marking strong growth and robust profitability. Operating expenses remained well-controlled at 24% of revenue, supporting a high 75.8% EBIT margin. Interest expenses were modest at 3.8% of revenue. Overall, the income statement fundamentals appear solid and highly favorable.
Financial Ratios
Below is a summary table of key financial ratios for AppLovin Corporation (APP) over the past five fiscal years, illustrating profitability, valuation, liquidity, leverage, and efficiency metrics:
| Ratios | 2021 | 2022 | 2023 | 2024 | 2025 |
|---|---|---|---|---|---|
| Net Margin | 1.3% | -6.8% | 10.9% | 33.5% | 60.8% |
| ROE | 1.7% | -10.1% | 28.4% | 144.9% | 156.2% |
| ROIC | 2.0% | -0.8% | 13.1% | 38.8% | 60.7% |
| P/E | 864 | -20.3 | 39.3 | 69.1 | 68.5 |
| P/B | 14.3 | 2.1 | 11.2 | 100.1 | 106.9 |
| Current Ratio | 5.1 | 3.3 | 1.7 | 2.2 | 3.3 |
| Quick Ratio | 5.1 | 3.3 | 1.7 | 2.2 | 3.3 |
| D/E | 1.56 | 1.72 | 2.53 | 3.26 | 1.66 |
| Debt-to-Assets | 54.0% | 56.1% | 59.3% | 60.6% | 48.8% |
| Interest Coverage | 1.5 | -0.3 | 2.4 | 5.9 | 20.1 |
| Asset Turnover | 0.45 | 0.48 | 0.61 | 0.80 | 0.75 |
| Fixed Asset Turnover | 20.8 | 20.3 | 14.8 | 23.7 | 37.1 |
| Dividend Yield | 0% | 0% | 0% | 0% | 0% |
Evolution of Financial Ratios
AppLovin’s Return on Equity surged from 1.7% in 2021 to 156.2% in 2025, showing a dramatic profitability improvement. The Current Ratio declined from 5.05 to 3.32, indicating reduced liquidity but still above 1. Debt-to-Equity fluctuated, peaking near 3.26 in 2024 before falling to 1.66 in 2025, reflecting leverage normalization. Profit margins expanded significantly in this period.
Are the Financial Ratios Fovorable?
In 2025, profitability ratios like ROE (156%) and net margin (60.8%) are strong, supported by a favorable interest coverage of 20.1. Liquidity shows mixed signals: a high quick ratio is positive, but the current ratio flags caution. Leverage remains relatively elevated with a debt-to-equity of 1.66. Market valuation ratios, including P/E (68.5) and P/B (107), appear stretched. Overall, the ratio profile is neutral.
Shareholder Return Policy
AppLovin Corporation (APP) does not pay dividends, reflecting its focus on reinvestment and growth. The company does not engage in share buybacks either, prioritizing capital allocation towards operations and expansion.
This policy aligns with its high profit margins and strong free cash flow, supporting sustainable long-term value creation. However, absence of direct shareholder returns requires monitoring for consistent operational performance and capital discipline.
Score analysis
The radar chart below visualizes AppLovin Corporation’s key financial scores across valuation, profitability, and leverage metrics:
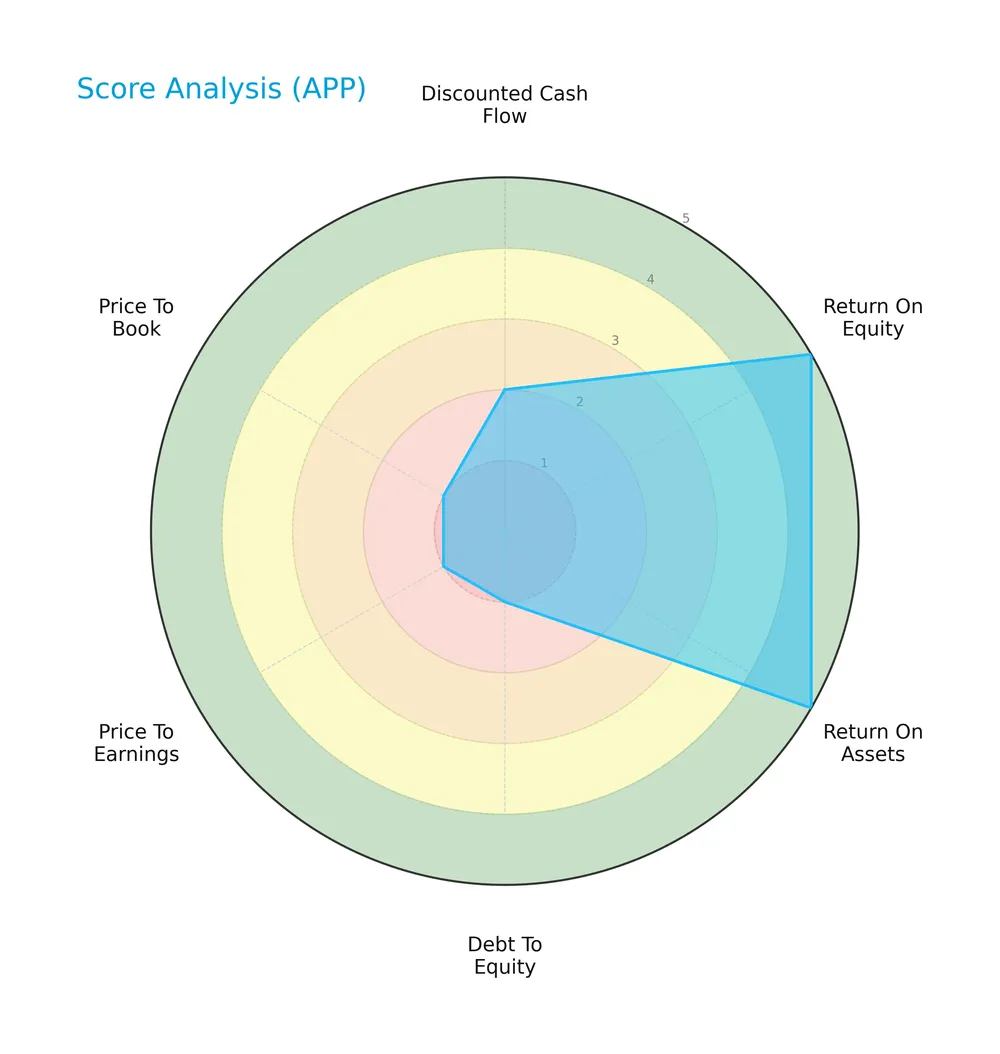
AppLovin shows strong profitability with top scores in return on equity and assets. However, valuation metrics like price-to-earnings and price-to-book scores are very unfavorable. The debt-to-equity score also signals high leverage risk.
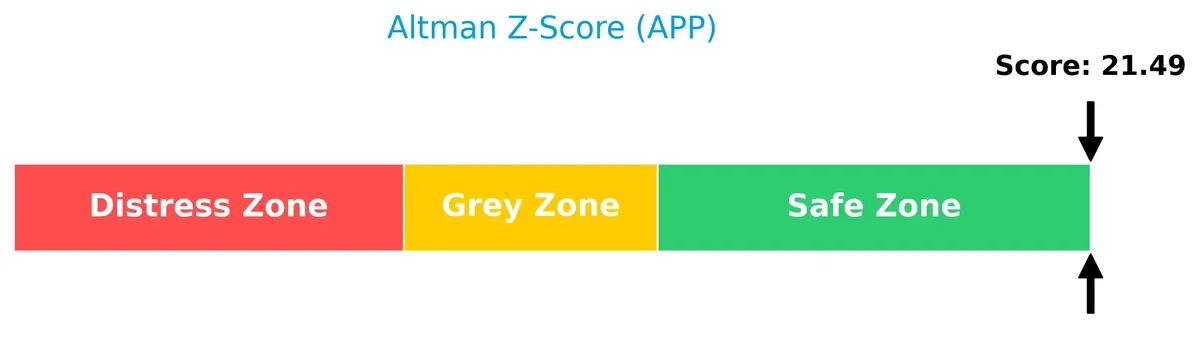
Analysis of the company’s bankruptcy risk
AppLovin’s Altman Z-Score indicates it resides well within the safe zone, suggesting a very low bankruptcy risk:
Is the company in good financial health?
The Piotroski Score diagram highlights AppLovin’s financial strength and robustness:
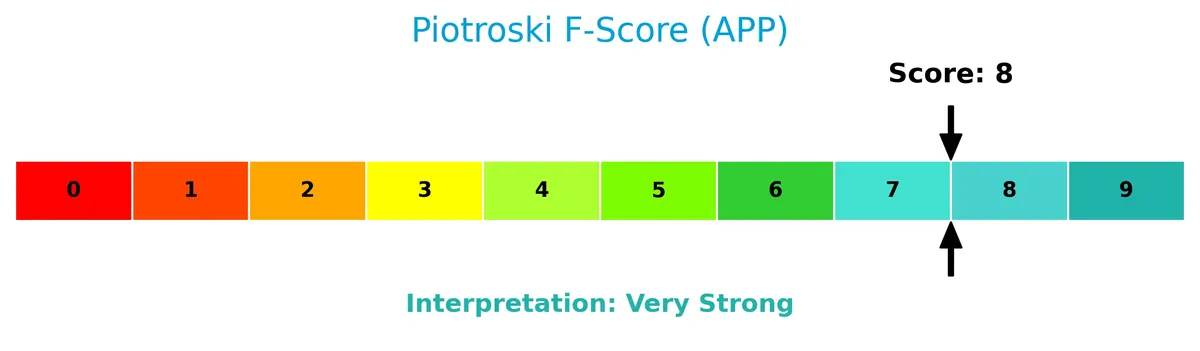
A high Piotroski score of 8 signals very strong financial health, reflecting solid profitability, liquidity, and operational efficiency. This score supports confidence in the company’s fundamentals.
Competitive Landscape & Sector Positioning
This section examines AppLovin Corporation’s strategic positioning, revenue streams, and key products in the software application sector. I will assess whether AppLovin holds a competitive advantage over its main industry peers.
Strategic Positioning
AppLovin maintains a diversified product portfolio spanning advertising software and apps, with advertising revenue reaching $3.2B in 2024. Geographically, the company balances exposure between the U.S. and international markets, generating nearly equal revenue around $2.7B each in 2024.
Revenue by Segment
This pie chart illustrates AppLovin Corporation’s revenue distribution by segment across fiscal years 2021 to 2024, highlighting shifts in business focus and segment contributions.
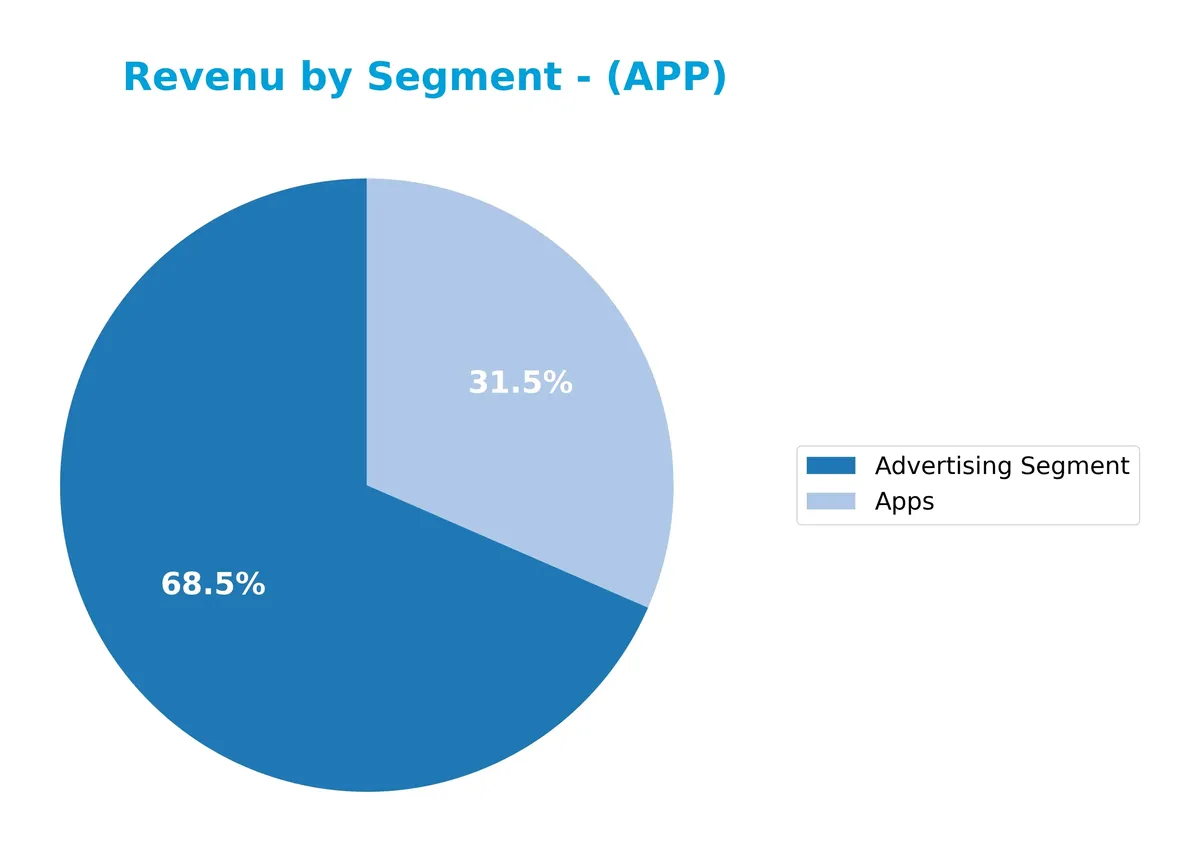
AppLovin’s revenue mix shows a clear evolution. The Advertising Segment emerged strongly in 2024 with $3.22B, becoming the dominant driver. Apps revenue declined from $2.12B in 2021 to $1.49B in 2024, signaling a slowdown. The Software Platform segment showed steady growth until 2023 but disappeared from the latest data, indicating strategic shifts. This concentration in advertising revenue raises concentration risk but also reflects the company’s pivot to higher-margin digital ad sales.
Key Products & Brands
The following table outlines AppLovin Corporation’s primary products and brands along with their core functionalities:
| Product | Description |
|---|---|
| AppDiscovery | Marketing software that connects advertiser demand with publisher supply through auction-based matching. |
| Adjust | Analytics platform providing measurement, campaign optimization, and user data protection for mobile app marketers. |
| MAX | In-app bidding software optimizing advertising inventory value via real-time competitive auctions. |
| Advertising Segment | Revenue-generating segment focused on marketing solutions and ad services, reaching $3.2B in 2024. |
| Apps | Mobile applications segment responsible for $1.5B revenue in 2024, encompassing various consumer-facing app products. |
AppLovin’s product suite combines marketing, analytics, and monetization tools tailored for mobile app developers. The Advertising Segment leads revenue, supported by robust app offerings and software platforms.
Main Competitors
There are 33 competitors in the Technology Software – Application sector; the table lists the top 10 leaders by market capitalization:
| Competitor | Market Cap. |
|---|---|
| Salesforce, Inc. | 242B |
| Shopify Inc. | 210B |
| AppLovin Corporation | 209B |
| Intuit Inc. | 175B |
| Uber Technologies, Inc. | 172B |
| ServiceNow, Inc. | 153B |
| Cadence Design Systems, Inc. | 84B |
| Snowflake Inc. | 73B |
| Autodesk, Inc. | 61B |
| Workday, Inc. | 55B |
AppLovin Corporation ranks 3rd among 33 competitors with a market cap about 58% of the leader, Salesforce. It stands below the top 10 average of 144B but above the sector median of 19B. AppLovin leads its nearest competitor, Shopify, by nearly 48%, showing a solid position within the industry.
Comparisons with competitors
Check out how we compare the company to its competitors:
Does APP have a competitive advantage?
AppLovin Corporation demonstrates a very favorable competitive advantage, evidenced by a ROIC 45.55% above its WACC and a rapidly growing ROIC trend. This indicates efficient capital use and sustained value creation.
Looking ahead, AppLovin’s diversified software platform serving mobile app marketing and monetization positions it well for growth. Expanding international revenues and innovative products like AppDiscovery and MAX support strong future opportunities.
SWOT Analysis
This analysis highlights AppLovin Corporation’s key strategic factors shaping its competitive stance and growth potential.
Strengths
- exceptional profitability with 60.8% net margin
- very high ROE at 156%
- strong global moat with rising ROIC
- diversified revenue across US and international markets
Weaknesses
- high valuation multiples with P/E of 68.5
- elevated debt-to-equity ratio at 1.66
- no dividend yield to attract income investors
Opportunities
- expanding mobile app market globally
- growth in in-app advertising demand
- potential for strategic acquisitions in ad tech
Threats
- intense competition in app marketing software
- regulatory risks on data privacy
- market volatility impacting high-beta stock (beta 2.49)
AppLovin’s strengths in profitability and competitive advantage position it well for growth. However, elevated valuation and leverage require cautious monitoring. Strategic focus should balance aggressive expansion with disciplined capital management.
Stock Price Action Analysis
The weekly stock chart of AppLovin Corporation (APP) reveals significant price movement patterns and volatility over the analyzed period:
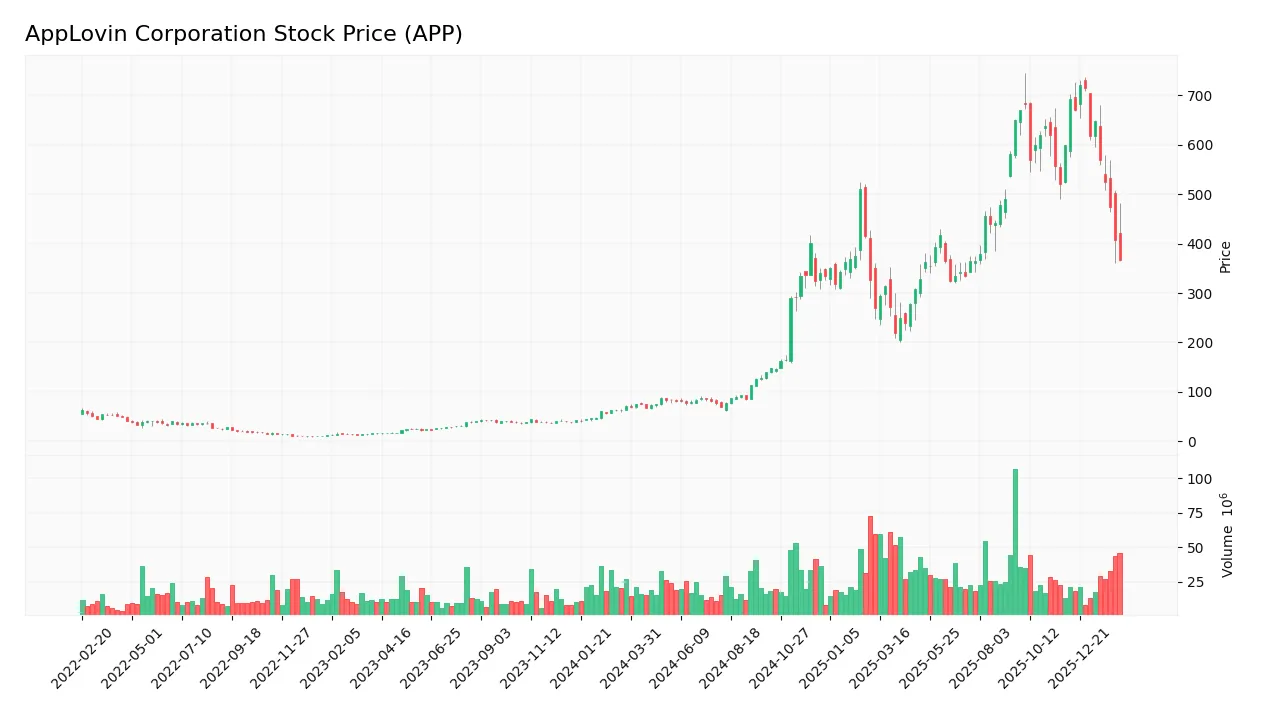
Trend Analysis
Over the past twelve months, APP’s stock price surged by 505%, indicating a strong bullish trend despite recent deceleration. The price ranged from a low of 66.8 to a high of 721.37. Volatility remains high, with a standard deviation of 195.26, reflecting substantial price swings during this period.
Volume Analysis
Trading volume increased overall, with buyers accounting for 62% of total activity, signaling strong demand. However, in the recent three months, seller volume dominated at 72%, reflecting a shift towards selling pressure and reduced buyer participation, which suggests cautious investor sentiment and potential profit-taking.
Target Prices
Analysts set a clear target consensus for AppLovin Corporation, reflecting cautious optimism.
| Target Low | Target High | Consensus |
|---|---|---|
| 543 | 835 | 690.93 |
The target range suggests moderate upside potential, with a consensus near 691 indicating steady confidence in the stock’s performance.

Don’t Let Luck Decide Your Entry Point
Optimize your entry points with our advanced ProRealTime indicators. You’ll get efficient buy signals with precise price targets for maximum performance. Start outperforming now!
Analyst & Consumer Opinions
This section examines recent analyst grades and consumer feedback on AppLovin Corporation (APP) to gauge market sentiment.
Stock Grades
Here is the latest set of verified analyst grades for AppLovin Corporation as of February 12, 2026:
| Grading Company | Action | New Grade | Date |
|---|---|---|---|
| Goldman Sachs | Maintain | Neutral | 2026-02-12 |
| Needham | Maintain | Buy | 2026-02-12 |
| Wedbush | Maintain | Outperform | 2026-02-12 |
| Citigroup | Maintain | Buy | 2026-02-12 |
| Piper Sandler | Maintain | Overweight | 2026-02-12 |
| Jefferies | Maintain | Buy | 2026-02-12 |
| Scotiabank | Maintain | Sector Outperform | 2026-02-12 |
| Wells Fargo | Maintain | Overweight | 2026-02-12 |
| RBC Capital | Maintain | Outperform | 2026-02-12 |
| BTIG | Maintain | Buy | 2026-02-12 |
The consensus among these established firms remains positive, with a strong bias toward “Buy” and “Outperform” ratings. No analysts downgraded; all maintained their prior views, indicating steady confidence in the stock.
Consumer Opinions
AppLovin Corporation sparks lively consumer debate, reflecting its dynamic position in mobile marketing technology.
| Positive Reviews | Negative Reviews |
|---|---|
| “Innovative ad solutions that boost app revenue.” | “Customer support response times need improvement.” |
| “Platform integration is seamless and user-friendly.” | “Pricing feels steep for smaller developers.” |
| “Data analytics provide valuable insights for campaigns.” | “Occasional glitches in the dashboard analytics.” |
Overall, users praise AppLovin’s innovation and robust analytics as key strengths. However, customer service delays and cost concerns emerge repeatedly as areas needing attention.
Risk Analysis
Below is a detailed table outlining key risks AppLovin Corporation faces in 2026:
| Category | Description | Probability | Impact |
|---|---|---|---|
| Valuation Risk | Elevated PE (68.5) and PB (107) ratios suggest the stock is priced richly. | High | High |
| Leverage Risk | Debt-to-equity ratio of 1.66 signals high financial leverage. | Medium | Medium |
| Market Volatility | Beta of 2.49 indicates stock price swings much greater than the market. | High | Medium |
| Dividend Risk | Zero dividend yield may deter income-focused investors. | High | Low |
| Liquidity Risk | Current ratio of 3.32 flagged as unfavorable; potential working capital issues. | Low | Medium |
| Competitive Risk | Intense competition in mobile app marketing software sector. | Medium | High |
AppLovin’s biggest risks stem from high valuation multiples and significant market volatility. Its beta of 2.49 shows sensitivity to market swings, raising potential price risk. The company’s debt level demands caution despite strong profitability and a robust Altman Z-Score of 20, which signals financial safety. Investors should weigh these risks carefully against the firm’s rapid growth and very strong Piotroski score of 8.
Should You Buy AppLovin Corporation?
AppLovin appears to be a highly profitable company with strong value creation supported by a durable competitive moat and growing ROIC. While its leverage profile shows substantial risk, its overall rating of B suggests a very favorable financial health profile worth careful consideration.
Strength & Efficiency Pillars
AppLovin Corporation demonstrates exceptional operational efficiency with a robust net margin of 60.83% and an impressive return on equity (ROE) of 156.17%. Its return on invested capital (ROIC) stands at 60.71%, significantly exceeding the weighted average cost of capital (WACC) of 15.16%, confirming the company as a clear value creator. This strong profitability is supported by a favorable EBIT margin of 75.75% and a gross margin of 87.86%, highlighting disciplined cost management and scalable revenue generation. The firm’s growing ROIC trend further signals an expanding competitive moat.
Weaknesses and Drawbacks
Despite operational strengths, AppLovin faces valuation and leverage concerns. The Altman Z-Score of 20.03 places it safely outside distress, but its price-to-earnings ratio (P/E) of 68.47 and price-to-book ratio (P/B) of 106.94 suggest a highly premium valuation that could pressure future returns. The debt-to-equity ratio of 1.66 is elevated, raising leverage risks that might magnify volatility during market downturns. Additionally, recent seller dominance with only 27.57% buyer volume signals short-term market pressure, warranting caution in timing new entries.
Our Final Verdict about AppLovin Corporation
AppLovin’s long-term fundamentals appear robust, anchored by strong profitability and a sustainable competitive advantage. However, despite its bullish overall trend, recent seller dominance suggests a cautious approach. Investors might consider waiting for a clearer market entry point as the current premium valuation and leverage profile could expose the stock to increased volatility. The profile may appeal to those comfortable with elevated risk in exchange for potential growth.
Disclaimer: This content is for informational purposes only and does not constitute financial, investment, or other professional advice. Investing in financial markets involves a significant risk of loss, and past performance is not indicative of future results.
Additional Resources
- Scotiabank Keeps an Outperform Rating on AppLovin Corporation (APP) – Yahoo Finance (Feb 21, 2026)
- AppLovin (APP) stock swings after-hours as SEC probe stays “active” and social-platform hiring pops up – TechStock² (Feb 21, 2026)
- AppLovin Corp SEC 10-K Report – TradingView (Feb 19, 2026)
- AppLovin moves higher as social media platform job posting gains attention (APP:NASDAQ) – Seeking Alpha (Feb 19, 2026)
- SEC Says Probe Involving AppLovin Is ‘Still Active and Ongoing’ – Bloomberg.com (Feb 20, 2026)
For more information about AppLovin Corporation, please visit the official website: applovin.com