Home > Analyses > Technology > Applied Materials, Inc.
Applied Materials, Inc. powers the semiconductor revolution that underpins modern technology, enabling the devices we rely on daily—from smartphones to advanced computing systems. As a global leader in semiconductor manufacturing equipment and services, Applied Materials stands out for its cutting-edge innovations and comprehensive solutions across semiconductor fabrication, display technologies, and factory automation. With its strong market influence and ongoing technological advancements, the key question for investors is whether Applied Materials’ robust fundamentals continue to support its premium valuation and growth prospects.

Table of contents
Business Model & Company Overview
Applied Materials, Inc., founded in 1967 and headquartered in Santa Clara, California, stands as a dominant player in the semiconductor industry. Its ecosystem integrates advanced manufacturing equipment, software, and services tailored to fabricate semiconductor chips, displays, and related technologies. The company’s offering spans from epitaxy and ion implantation to display manufacturing for consumer electronics, forming a comprehensive platform that supports innovation across multiple tech sectors.
The company’s revenue engine balances cutting-edge hardware with recurring services and software, delivered through three main segments: Semiconductor Systems, Applied Global Services, and Display and Adjacent Markets. Operating globally across the Americas, Europe, and Asia, Applied Materials leverages its broad geographic footprint to drive growth and resilience. Its competitive advantage lies in a diversified portfolio and integrated solutions that underpin the future of semiconductor manufacturing worldwide.
Financial Performance & Fundamental Metrics
In this section, I analyze Applied Materials, Inc.’s income statement, key financial ratios, and dividend payout policy to assess its overall financial health.
Income Statement
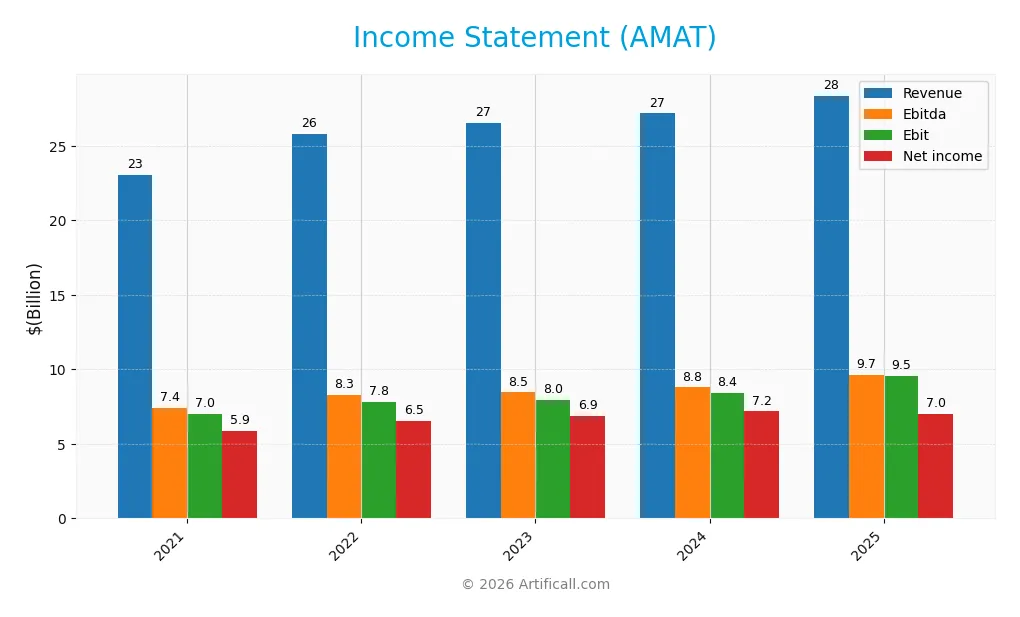
The table below presents Applied Materials, Inc.’s key income statement figures for the fiscal years 2021 through 2025, reflecting its financial performance in USD.
| 2021 | 2022 | 2023 | 2024 | 2025 | |
|---|---|---|---|---|---|
| Revenue | 23.1B | 25.8B | 26.5B | 27.2B | 28.4B |
| Cost of Revenue | 12.1B | 13.8B | 14.1B | 14.3B | 14.6B |
| Operating Expenses | 4.03B | 4.21B | 4.73B | 5.03B | 5.52B |
| Gross Profit | 10.9B | 12.0B | 12.4B | 12.9B | 13.8B |
| EBITDA | 7.39B | 8.26B | 8.46B | 8.79B | 9.65B |
| EBIT | 7.01B | 7.83B | 7.95B | 8.40B | 9.54B |
| Interest Expense | 236M | 228M | 238M | 247M | 269M |
| Net Income | 5.89B | 6.53B | 6.86B | 7.18B | 7.00B |
| EPS | 6.47 | 7.49 | 8.16 | 8.68 | 8.71 |
| Filing Date | 2021-12-17 | 2022-12-16 | 2023-12-15 | 2024-12-13 | 2025-12-12 |
Income Statement Evolution
Applied Materials, Inc. showed a 23% revenue growth from 2021 to 2025, with a 4.39% increase in the last year, marking a slowing pace. Net income rose 18.85% over the period but declined 6.59% in the last year. Gross margin remained favorable at 48.67%, while net margin slightly contracted by 3.37%, reflecting stable but pressured profitability.
Is the Income Statement Favorable?
In 2025, AMAT reported a 28.4B revenue and 7B net income, maintaining a strong 24.67% net margin. EBIT margin was also favorable at 33.63%, supported by controlled interest expense near 1%. Despite a modest decline in net margin growth and unfavorable operating expense growth, the overall fundamentals are rated favorable, driven by solid profitability and earnings per share growth.
Financial Ratios
The following table presents key financial ratios for Applied Materials, Inc. (AMAT) over the fiscal years 2021 to 2025, providing insight into profitability, liquidity, leverage, and efficiency metrics:
| Ratios | 2021 | 2022 | 2023 | 2024 | 2025 |
|---|---|---|---|---|---|
| Net Margin | 25.5% | 25.3% | 25.9% | 26.4% | 24.7% |
| ROE | 48.1% | 53.5% | 41.9% | 37.8% | 34.3% |
| ROIC | 30.6% | 34.4% | 28.8% | 25.8% | 22.0% |
| P/E | 21.6 | 11.8 | 16.1 | 21.4 | 26.6 |
| P/B | 10.4 | 6.3 | 6.7 | 8.1 | 9.1 |
| Current Ratio | 2.54 | 2.16 | 2.60 | 2.51 | 2.61 |
| Quick Ratio | 1.86 | 1.35 | 1.82 | 1.87 | 1.87 |
| D/E | 0.47 | 0.48 | 0.37 | 0.35 | 0.35 |
| Debt-to-Assets | 22.3% | 21.8% | 19.5% | 19.2% | 19.4% |
| Interest Coverage | 29.2 | 34.2 | 32.2 | 31.9 | 30.8 |
| Asset Turnover | 0.89 | 0.96 | 0.86 | 0.79 | 0.78 |
| Fixed Asset Turnover | 10.4 | 9.6 | 8.3 | 7.3 | 5.5 |
| Dividend Yield | 0.66% | 1.14% | 0.89% | 0.78% | 0.74% |
Evolution of Financial Ratios
From 2021 to 2025, Applied Materials’ Return on Equity (ROE) showed a downward trend from 48.08% in 2021 to 34.28% in 2025, indicating a moderation in profitability. The Current Ratio improved from 2.54 to 2.61, reflecting strengthening liquidity. The Debt-to-Equity Ratio declined from 0.47 to 0.35, suggesting reduced leverage and a more conservative capital structure.
Are the Financial Ratios Fovorable?
In 2025, Applied Materials exhibited favorable profitability ratios including a 24.67% net margin and 34.28% ROE, supported by strong interest coverage at 35.46. Liquidity ratios were solid, with a current ratio of 2.61 and quick ratio of 1.87. Leverage ratios were favorable, with debt-to-equity at 0.35 and debt-to-assets at 19.42%. However, market valuation ratios such as P/E at 26.58 and P/B at 9.11 appeared unfavorable, while asset turnover was neutral at 0.78. Overall, the global ratio assessment was favorable.
Shareholder Return Policy
Applied Materials, Inc. maintains a consistent dividend policy with a payout ratio near 20%, a rising dividend per share from $0.92 in 2021 to $1.72 in 2025, and a modest yield around 0.7%. Share buybacks also complement dividends, supported by strong free cash flow coverage exceeding 70%.
This balanced approach, combining dividends and buybacks, appears sustainable given the company’s robust profitability and cash flow metrics. The stable payout ratio and coverage suggest prudent capital returns, aligning with long-term shareholder value creation without overextending distributions or repurchases.
Score analysis
The following radar chart displays Applied Materials, Inc.’s key financial scores across valuation and profitability metrics:
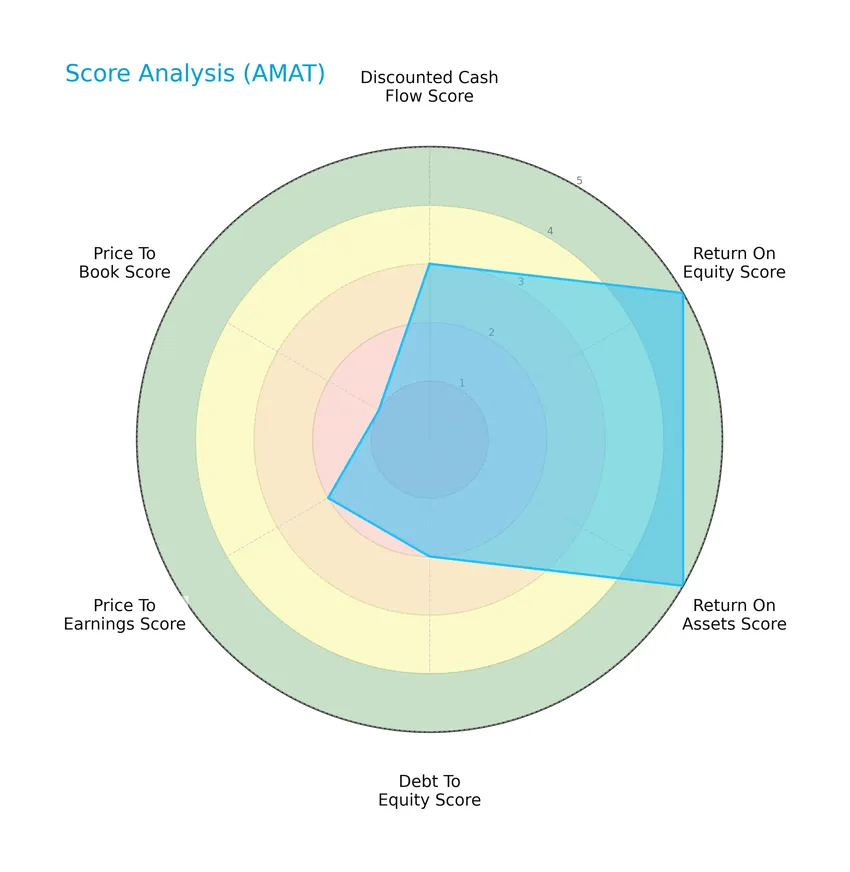
Applied Materials shows very favorable returns on equity and assets, scoring 5 in both categories. However, valuation metrics such as price-to-book are very unfavorable at 1, with other scores like debt-to-equity and price-to-earnings rated moderate, indicating mixed signals across financial dimensions.
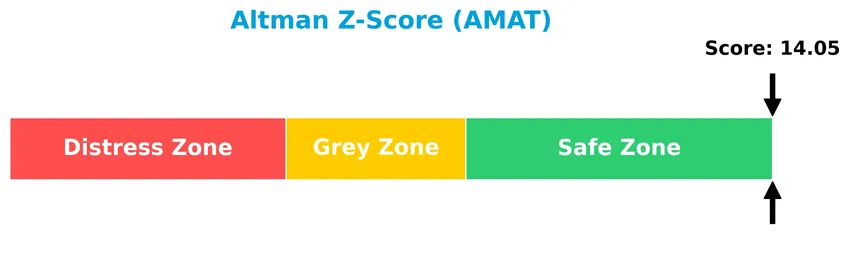
Analysis of the company’s bankruptcy risk
Applied Materials’ Altman Z-Score places it well within the safe zone, indicating a very low risk of bankruptcy:
Is the company in good financial health?
The Piotroski Score diagram below highlights the company’s financial strength and robustness based on nine key criteria:
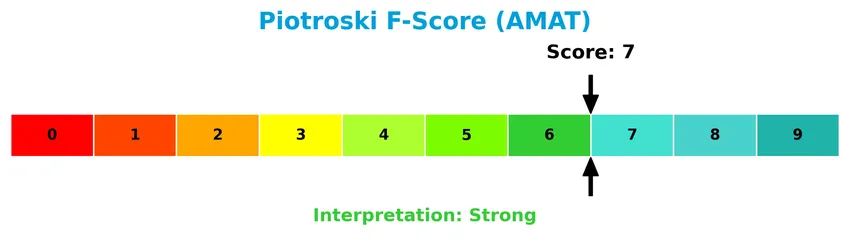
With a Piotroski Score of 7, Applied Materials demonstrates strong financial health, suggesting solid profitability, efficient operations, and manageable leverage, positioning it favorably among its peers.
Competitive Landscape & Sector Positioning
This sector analysis will examine Applied Materials, Inc.’s strategic positioning, revenue by segment, key products, main competitors, and competitive advantages. I will also assess whether Applied Materials holds a competitive edge within the semiconductor industry and related markets.
Strategic Positioning
Applied Materials, Inc. maintains a diversified product portfolio across three segments—Semiconductor Systems (19.9B in 2024), Applied Global Services (6.2B), and Display and Adjacent Markets (885M). Its geographic exposure spans major semiconductor hubs including China (10.1B), Korea (4.5B), Taiwan (4B), Japan (2.2B), the US (3.8B), Europe, and Southeast Asia, reflecting broad international market penetration.
Revenue by Segment
This pie chart illustrates Applied Materials, Inc.’s revenue distribution across its main business segments for the fiscal year 2024.
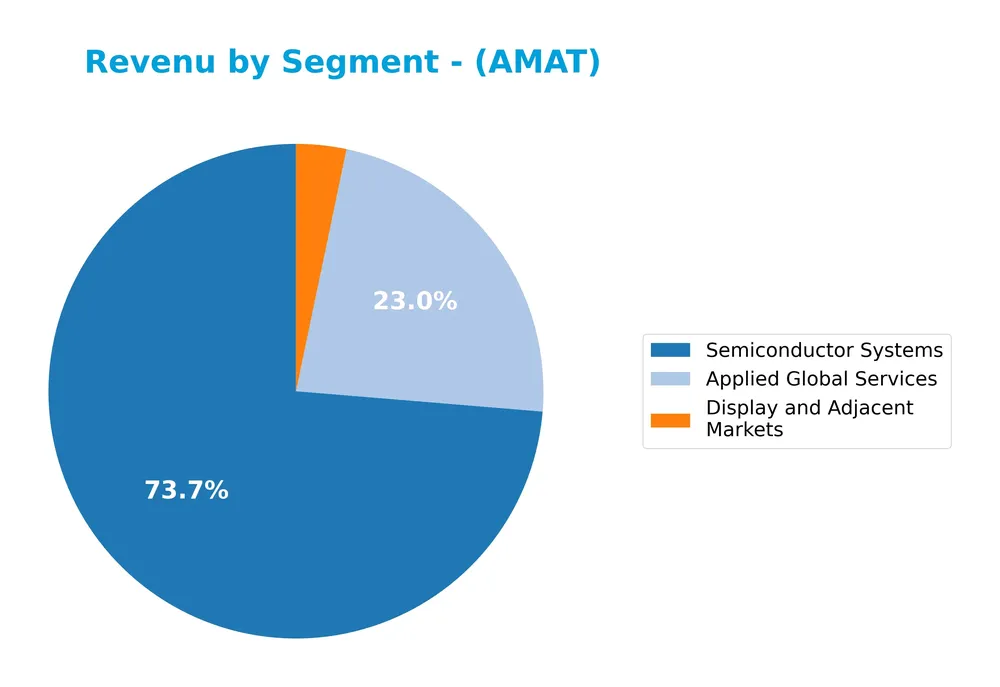
In 2024, Semiconductor Systems remained the dominant revenue driver at $19.9B, showing steady growth over recent years. Applied Global Services also contributed significantly with $6.2B, reflecting consistent expansion since 2020. Display and Adjacent Markets, although smaller at $885M, showed a decline compared to prior years, indicating a possible shift in focus or market conditions. The overall trend highlights a concentration in semiconductor-related technologies, emphasizing the company’s core strength but also implying some exposure to the cyclicality of this market.
Key Products & Brands
The following table provides an overview of Applied Materials, Inc.’s main products and brands along with their descriptions:
| Product | Description |
|---|---|
| Semiconductor Systems | Manufacturing equipment used to fabricate semiconductor chips and integrated circuits, including technologies like epitaxy, ion implantation, deposition, etching, and metrology tools. |
| Applied Global Services | Integrated solutions to optimize equipment and fab performance, including spares, upgrades, remanufactured equipment, and factory automation software for semiconductor and display products. |
| Display and Adjacent Markets | Products for manufacturing liquid crystal displays, OLEDs, and other display technologies for TVs, monitors, laptops, tablets, and smartphones. |
Applied Materials operates through three core segments focused on semiconductor fabrication equipment, global services to enhance manufacturing efficiency, and display technology production, serving key markets worldwide.
Main Competitors
Applied Materials, Inc. faces competition from 38 companies in its sector. Below is a table listing the top 10 leaders by market capitalization:
| Competitor | Market Cap. |
|---|---|
| NVIDIA Corporation | 4.6T |
| Broadcom Inc. | 1.6T |
| Taiwan Semiconductor Manufacturing Company Limited | 1.6T |
| ASML Holding N.V. | 415B |
| Advanced Micro Devices, Inc. | 363B |
| Micron Technology, Inc. | 353B |
| Lam Research Corporation | 232B |
| Applied Materials, Inc. | 214B |
| QUALCOMM Incorporated | 185B |
| Intel Corporation | 173B |
Applied Materials ranks 8th among its 38 competitors, with a market cap approximately 5.6% that of the sector leader, NVIDIA. The company is below the average market cap of the top 10 competitors (974B) but remains above the sector median (31B). It has a competitive gap of roughly +9.5% compared to the next larger competitor, Lam Research.
Comparisons with competitors
Check out how we compare the company to its competitors:
Does AMAT have a competitive advantage?
Applied Materials, Inc. presents a competitive advantage as it consistently creates value, with its return on invested capital (ROIC) exceeding its weighted average cost of capital (WACC) by over 10%. However, its ROIC has shown a declining trend, indicating a potential weakening in profitability.
Looking ahead, AMAT’s diverse portfolio across semiconductor manufacturing equipment, services, and display technologies provides opportunities for growth in multiple geographic markets, including China, Taiwan, and the U.S. Continued innovation in advanced fabrication technologies and factory automation software may help sustain its competitive position.
SWOT Analysis
This SWOT analysis highlights Applied Materials, Inc.’s key internal and external factors to guide strategic investment decisions.
Strengths
- strong market position in semiconductor equipment
- favorable profitability with 24.67% net margin
- diverse global revenue base with strong presence in China and Korea
Weaknesses
- high P/E and P/B ratios indicating possible overvaluation
- declining ROIC trend despite value creation
- modest dividend yield of 0.74%
Opportunities
- growing semiconductor demand driven by AI and 5G
- expansion in emerging display technologies
- increasing fab automation and service integration
Threats
- geopolitical risks impacting China and Taiwan sales
- intense competition in semiconductor equipment industry
- global supply chain disruptions affecting production
Overall, Applied Materials shows robust profitability and market leadership with moderate valuation concerns. Strategic focus on innovation and geographic risk mitigation will be essential to sustain growth and shareholder value.
Stock Price Action Analysis
The weekly stock chart for Applied Materials, Inc. (AMAT) over the past 100 weeks highlights key price fluctuations and trend movements:
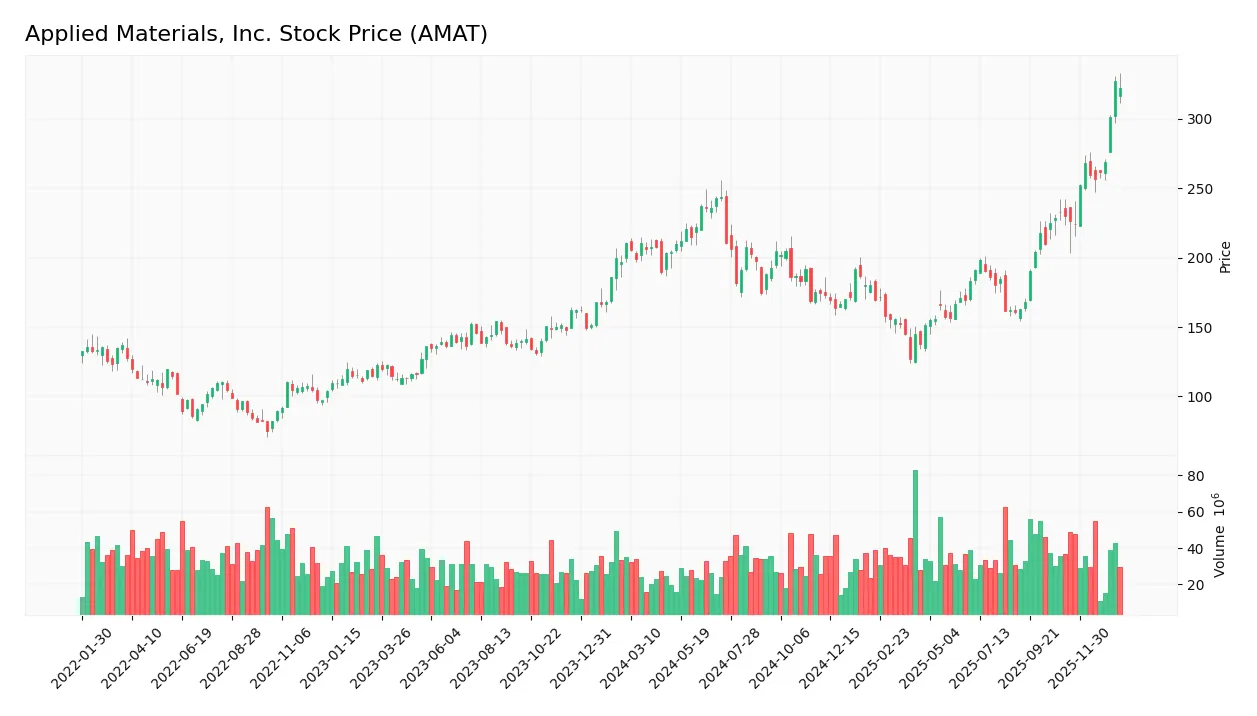
Trend Analysis
Over the past 12 months, AMAT’s stock price increased by 53.33%, indicating a bullish trend with price acceleration. The stock exhibited notable volatility with a standard deviation of 36.93, reaching a high of 327.01 and a low of 126.95. Recent data from November 2025 to January 2026 shows a continued upward slope of 8.83 and a 40.12% price gain.
Volume Analysis
In total, trading volume for AMAT shows a slight buyer dominance at 51.53%, with increasing activity overall. However, in the recent period from November 2025 to January 2026, volume shifted to a slightly seller-dominant profile at 41.24% buyer presence, suggesting cautious investor sentiment and heightened selling pressure despite rising prices.
Target Prices
The consensus target prices for Applied Materials, Inc. reflect a bullish outlook among analysts.
| Target High | Target Low | Consensus |
|---|---|---|
| 400 | 273 | 341.44 |
Analysts expect the stock to trade between 273 and 400, with an average consensus target of approximately 341. This suggests moderate upside potential from current levels.

Don’t Let Luck Decide Your Entry Point
Optimize your entry points with our advanced ProRealTime indicators. You’ll get efficient buy signals with precise price targets for maximum performance. Start outperforming now!
Analyst & Consumer Opinions
This section examines the latest analyst ratings and consumer feedback regarding Applied Materials, Inc. (AMAT).
Stock Grades
Here are the latest verified stock grades for Applied Materials, Inc. from recognized financial institutions:
| Grading Company | Action | New Grade | Date |
|---|---|---|---|
| Needham | Maintain | Buy | 2026-01-20 |
| Keybanc | Maintain | Overweight | 2026-01-16 |
| Barclays | Upgrade | Overweight | 2026-01-15 |
| Wells Fargo | Maintain | Overweight | 2026-01-15 |
| Stifel | Maintain | Buy | 2026-01-14 |
| B of A Securities | Maintain | Buy | 2026-01-13 |
| Susquehanna | Upgrade | Positive | 2026-01-12 |
| Cantor Fitzgerald | Maintain | Overweight | 2026-01-08 |
| B. Riley Securities | Maintain | Buy | 2025-12-18 |
| Mizuho | Maintain | Neutral | 2025-12-17 |
The overall grading trend for AMAT shows a strong inclination towards Buy and Overweight ratings, with multiple upgrades recently, indicating positive sentiment from several reputable analysts. The consensus remains firmly in the Buy category, reflecting broad confidence in the stock’s outlook.
Consumer Opinions
Applied Materials, Inc. enjoys a generally favorable reputation among its consumers, reflecting trust in its technology and product quality.
| Positive Reviews | Negative Reviews |
|---|---|
| “AMAT’s equipment reliability significantly improved our manufacturing efficiency.” | “Customer support response times can be slow during peak periods.” |
| “Innovative solutions that keep us ahead in semiconductor production.” | “Pricing is high compared to some competitors, impacting smaller businesses.” |
| “Strong commitment to sustainability and environmental standards.” | “Occasional software glitches disrupt production schedules.” |
Overall, consumers praise AMAT for its innovation and product reliability, while concerns focus mainly on customer service delays and premium pricing, suggesting areas for potential improvement.
Risk Analysis
Below is a concise overview of the main risks associated with investing in Applied Materials, Inc. (AMAT), highlighting their probability and potential impact:
| Category | Description | Probability | Impact |
|---|---|---|---|
| Market Volatility | High beta (1.671) indicates sensitivity to market swings, impacting share price stability. | High | High |
| Valuation Risk | Elevated Price-to-Book ratio (9.11) suggests the stock may be overvalued, limiting upside. | Moderate | Moderate |
| Competitive Pressure | Intense semiconductor industry competition may affect market share and margins. | Moderate | High |
| Geopolitical Risk | Exposure to China, Korea, Taiwan risks supply chain disruptions and trade tensions. | Moderate | High |
| Interest Rate Risk | Unfavorable WACC (11.5%) reflects higher capital costs, potentially squeezing profits. | Moderate | Moderate |
| Dividend Yield Risk | Low dividend yield (0.74%) might deter income-focused investors. | Low | Low |
Applied Materials’ most significant risks stem from its high market volatility and geopolitical exposure in Asia, where semiconductor manufacturing is concentrated. Despite strong financial health and a safe Altman Z-score, valuation concerns and competitive dynamics warrant caution.
Should You Buy Applied Materials, Inc.?
Applied Materials, Inc. appears to be delivering robust profitability with strong operational efficiency, supported by a slightly favorable yet declining competitive moat. Its leverage profile seems manageable, while the overall B+ rating suggests a very favorable financial health, indicating potential value creation.
Strength & Efficiency Pillars
Applied Materials, Inc. demonstrates robust profitability with a net margin of 24.67%, a return on equity of 34.28%, and a return on invested capital (ROIC) of 21.96%. Importantly, its ROIC surpasses its weighted average cost of capital (WACC) by a significant margin (21.96% vs. 11.5%), confirming the company as a clear value creator. Financial health is equally solid, reflected in an Altman Z-Score of 14.05, placing it firmly in the safe zone, and a Piotroski Score of 7, indicating strong fundamental strength. These metrics collectively underscore Applied Materials’ operational efficiency and value generation capacity.
Weaknesses and Drawbacks
Despite its strengths, Applied Materials faces valuation headwinds. Its price-to-earnings (P/E) ratio stands at 26.58, suggesting a moderately premium valuation that could limit upside potential. The price-to-book (P/B) ratio at 9.11 is notably high, rated very unfavorable, indicating the stock may be overvalued relative to book value. Recent market behavior is slightly seller dominated, with buyers comprising only 41.24% in the latest period, potentially signaling short-term pressure. While leverage ratios remain favorable (debt-to-equity at 0.35), the dividend yield of 0.74% is considered low, which may deter income-focused investors.
Our Verdict about Applied Materials, Inc.
Applied Materials, Inc. presents a fundamentally favorable long-term profile, supported by strong profitability and financial stability. However, despite a bullish overall stock trend and accelerating momentum, recent seller dominance suggests caution. Thus, while the company’s financials and market position suggest it could be attractive for long-term exposure, the current market pressure might imply a wait-and-see approach for investors seeking a more advantageous entry point.
Disclaimer: This content is for informational purposes only and does not constitute financial, investment, or other professional advice. Investing in financial markets involves a significant risk of loss, and past performance is not indicative of future results.
Additional Resources
- Applied Materials: When Chip Complexity Becomes The Real Alpha (NASDAQ:AMAT) – Seeking Alpha (Jan 23, 2026)
- Assessing Applied Materials (AMAT) Valuation After Analyst Upgrades And Earnings Beat – simplywall.st (Jan 23, 2026)
- Deutsche Bank Upgrades Applied Materials (AMAT) – Nasdaq (Jan 23, 2026)
- Applied Materials Stock (AMAT) Opinions on Recent Price Surge and AI Demand – Quiver Quantitative (Jan 23, 2026)
- KeyBanc Raises Applied Materials (AMAT) Target to $380, Keeps Overweight Rating – Yahoo Finance (Jan 21, 2026)
For more information about Applied Materials, Inc., please visit the official website: appliedmaterials.com