Apple Inc. is a global leader in technology, renowned for its innovative products and services that have transformed the consumer electronics landscape. With a market capitalization exceeding $3.7 trillion, Apple continues to dominate the industry through its flagship products like the iPhone, iPad, and Mac, alongside a robust ecosystem of services. This article will help you determine if investing in Apple is a sound opportunity for your portfolio.
 Table of Contents
Company Description
Apple Inc. designs, manufactures, and markets a wide range of consumer electronics, software, and services. Founded in 1976 and headquartered in Cupertino, California, Apple has established itself as a pioneer in the technology sector. The company operates in various markets, including smartphones, personal computers, tablets, wearables, and accessories. Its primary geographic markets include North America, Europe, and Asia, where it has a significant presence through both retail and online channels. Apple’s commitment to innovation and quality has made it a household name and a leader in the consumer electronics industry.
Key Products of Apple
Apple’s product lineup includes a variety of devices and services that cater to different consumer needs. Below is a table summarizing some of the key products offered by Apple.
| Product |
Description |
| iPhone |
A line of smartphones known for their sleek design and advanced features. |
| Mac |
A series of personal computers that combine performance with a user-friendly interface. |
| iPad |
A versatile tablet that serves both entertainment and productivity needs. |
| Apple Watch |
A smartwatch that integrates health tracking and connectivity features. |
| AirPods |
Wireless earbuds that offer high-quality audio and seamless integration with Apple devices. |
| Apple TV |
A digital media player and streaming device that allows access to various content services. |
Revenue Evolution
Apple’s revenue has shown a consistent upward trend over the past few years, reflecting its strong market position and product demand. Below is a table summarizing the revenue, EBITDA, EBIT, net income, and EPS from 2021 to 2025.
| Year |
Revenue (in millions) |
EBITDA (in millions) |
EBIT (in millions) |
Net Income (in millions) |
EPS |
| 2021 |
365,817 |
123,136 |
108,949 |
94,680 |
5.67 |
| 2022 |
394,328 |
133,138 |
119,437 |
99,803 |
6.15 |
| 2023 |
383,285 |
125,820 |
114,301 |
96,995 |
6.16 |
| 2024 |
391,035 |
134,661 |
123,216 |
93,736 |
6.11 |
| 2025 |
Estimate |
Estimate |
Estimate |
Estimate |
Estimate |
Over the period from 2021 to 2024, Apple has experienced fluctuations in revenue and net income, with a peak in 2022. The EPS has remained relatively stable, indicating consistent profitability.
Financial Ratios Analysis
The financial ratios provide insight into Apple’s operational efficiency and profitability. Below is a table summarizing key financial ratios from 2021 to 2024.
| Year |
Net Margin |
ROE |
ROIC |
P/E |
P/B |
Current Ratio |
D/E |
| 2021 |
0.2588 |
1.5007 |
0.4831 |
25.92 |
38.89 |
1.0746 |
2.1639 |
| 2022 |
0.2531 |
1.9696 |
0.6009 |
24.44 |
48.14 |
0.8794 |
2.6145 |
| 2023 |
0.2531 |
1.5608 |
0.5514 |
27.79 |
43.37 |
0.9880 |
1.9942 |
| 2024 |
0.2397 |
1.6459 |
0.6534 |
37.29 |
61.37 |
0.8673 |
2.0906 |
Interpretation of Financial Ratios
In 2024, Apple’s net margin stands at 23.97%, indicating a healthy profitability level. The return on equity (ROE) is 164.59%, showcasing effective management of shareholder equity. The return on invested capital (ROIC) is 65.34%, reflecting strong returns on capital investments. The price-to-earnings (P/E) ratio of 37.29 suggests that the stock is relatively expensive compared to its earnings, while the price-to-book (P/B) ratio of 61.37 indicates a high valuation relative to its book value. The current ratio of 0.8673 suggests that Apple may face liquidity challenges, while the debt-to-equity (D/E) ratio of 2.0906 indicates a high level of debt compared to equity.
Evolution of Financial Ratios
The financial ratios have shown some fluctuations over the years. The net margin has slightly decreased from 25.88% in 2021 to 23.97% in 2024, indicating a potential decline in profitability. However, the ROE has remained strong, suggesting effective management. The P/E ratio has increased, indicating that investors are willing to pay more for each dollar of earnings, reflecting confidence in future growth. Overall, the latest year’s ratios are generally favorable, but the high P/B ratio suggests caution.
Distribution Policy
Apple has a consistent distribution policy that includes regular dividend payments and share buybacks. The payout ratio is approximately 16.25%, indicating that a small portion of earnings is returned to shareholders. The annual dividend yield is around 0.44%, which is modest but reflects Apple’s commitment to returning value to shareholders. The company has also engaged in significant share repurchase programs, which can enhance shareholder value. However, there are concerns about dividends not being fully covered by cash flow, which could pose risks in the future.
Sector Analysis
Apple operates in the highly competitive consumer electronics sector, where it holds a significant market share. The company faces competitive pressure from various players, including Samsung, Google, and Microsoft. Technological disruption is a constant threat, as new innovations can quickly change consumer preferences and market dynamics. However, Apple’s strong brand loyalty and ecosystem of products and services provide a competitive advantage.
Main Competitors
The following table summarizes Apple’s main competitors and their respective market shares.
| Company |
Market Share |
| Apple |
27% |
| Samsung |
20% |
| Google |
15% |
| Microsoft |
10% |
| Others |
28% |
Apple’s market share of 27% positions it as a leader in the consumer electronics sector, particularly in the smartphone market. Samsung follows closely with 20%, while Google and Microsoft hold 15% and 10%, respectively. The remaining 28% is shared among various other competitors.
Competitive Advantages
Apple’s competitive advantages include its strong brand recognition, loyal customer base, and a well-integrated ecosystem of products and services. The company continues to innovate with new products and services, such as advancements in artificial intelligence and augmented reality. Additionally, Apple’s focus on privacy and security enhances its appeal to consumers. The future outlook remains positive, with opportunities for growth in emerging markets and new product categories.
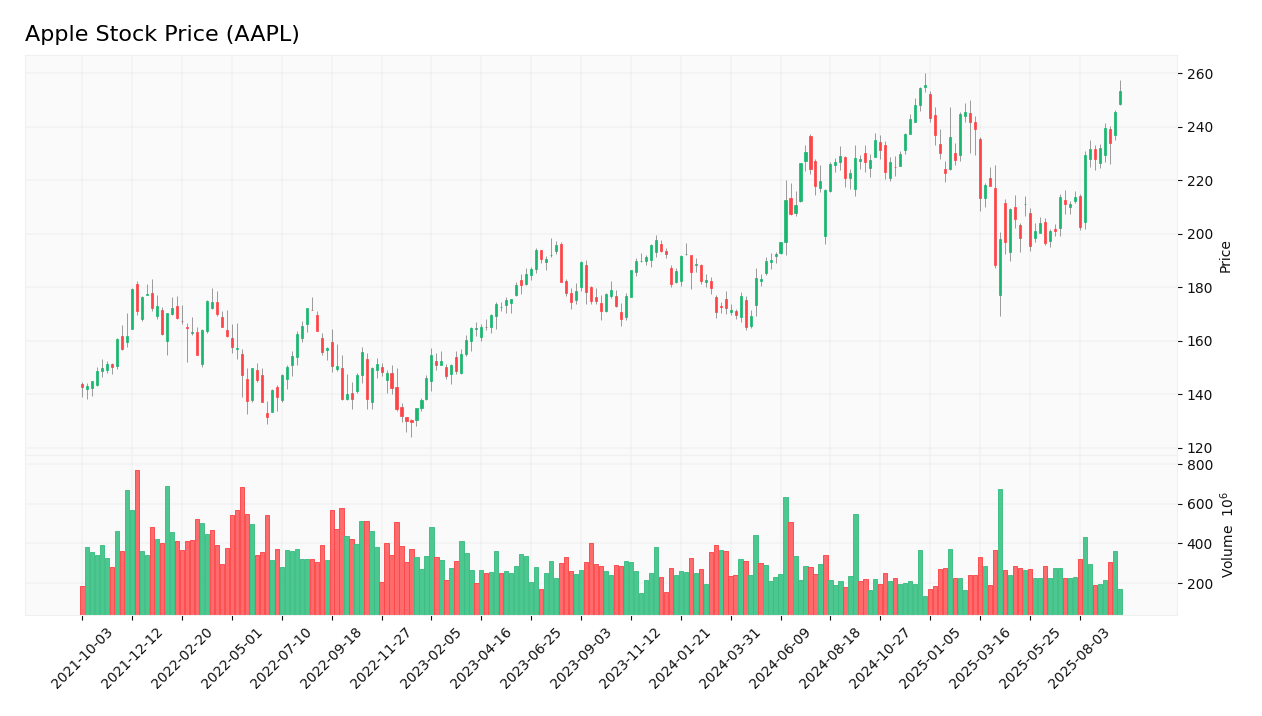
Stock Analysis
The following chart illustrates Apple’s stock price trend over the past year.
Trend Analysis
Apple’s stock price has shown a bullish trend over the past year, with a significant increase from $141.50 in September 2021 to $252.31 in September 2025. This represents a percentage increase of approximately 78.5% over four years. The stock has experienced some volatility, particularly in response to market conditions and product launches. The current price is within the 52-week range of $169.21 to $260.10, indicating a healthy trading range.
Volume Analysis
Over the last three months, Apple’s average trading volume has been approximately 57,147,661 shares. This indicates a strong interest from investors, with volumes trending upwards, suggesting a buyer-driven market. The increasing volume reflects confidence in Apple’s stock, particularly as new product launches and innovations are anticipated.
Analyst Opinions
Recent analyst recommendations for Apple have been predominantly positive, with a consensus leaning towards “buy.” Analysts cite Apple’s strong brand loyalty, innovative product pipeline, and robust financial performance as key reasons for their recommendations. The overall sentiment in 2025 is that Apple remains a strong investment opportunity.
Consumer Opinions
Consumer feedback on Apple products is generally positive, with many praising the quality, design, and user experience. However, some criticisms focus on pricing and the lack of customization options. Below is a table comparing three positive reviews against three negative reviews.
| Positive Reviews |
Negative Reviews |
| High-quality build and design. |
Expensive compared to competitors. |
| Seamless integration with other Apple products. |
Limited customization options. |
| Excellent customer service and support. |
Frequent software updates can be disruptive. |
Risk Analysis
The following table outlines the main risks faced by Apple, categorized by type and potential impact.
| Risk Category |
Description |
Probability |
Potential Impact |
Recent Example / Fact |
| Financial |
High debt levels may affect financial stability. |
Medium |
High |
N/A |
| Operational |
Supply chain disruptions can impact product availability. |
High |
Moderate |
COVID-19 pandemic effects. |
| Sector |
Intense competition may erode market share. |
High |
High |
Emerging competitors in the smartphone market. |
| Regulatory |
Changes in regulations can affect operations. |
Medium |
Moderate |
New EU regulations on tech companies. |
| Geopolitical |
Trade tensions may impact international sales. |
Medium |
High |
US-China trade relations. |
| Technological |
Rapid technological changes can render products obsolete. |
High |
High |
N/A |
The most critical risks for investors include high debt levels and intense competition, which could significantly impact Apple’s market position and financial stability.
Summary
In summary, Apple Inc. continues to be a formidable player in the consumer electronics market, with strong flagship products and a loyal customer base. The company’s financial ratios indicate solid profitability, although there are concerns regarding high debt levels and competition.
The following table summarizes Apple’s strengths and weaknesses.
| Strengths |
Weaknesses |
| Strong brand loyalty |
High product prices |
| Innovative product pipeline |
Limited customization options |
| Robust ecosystem of services |
Dependence on iPhone sales |
Should You Buy Apple?
Based on the net margin of 23.97% for 2024, a positive long-term trend, and increasing buyer volumes, Apple presents a favorable signal for long-term investment. However, investors should remain cautious of the high debt levels and competitive pressures. It may be prudent to monitor the market conditions and Apple’s performance closely before making significant investment decisions.
Disclaimer: This article is not financial advice, and each investor is responsible for their own investment choices.
Additional Resources
For more information, visit Apple’s official website:
Apple Inc.

 Table of Contents