Home > Analyses > Financial Services > Apollo Global Management, Inc.
Apollo Global Management shapes the asset management landscape by mastering complex investments across credit, private equity, and real estate. Known for its contrarian and value-driven strategies, Apollo commands industry respect through innovative deal sourcing and rigorous portfolio management. Its diverse investment focus—from distressed debt to growth capital—fuels steady market influence. As 2026 unfolds, the critical question remains: Does Apollo’s strategic depth and asset mix continue to justify its premium valuation and growth ambitions?

Table of contents
Business Model & Company Overview
Apollo Global Management, Inc., founded in 1990 and headquartered in New York City, stands as a leader in global asset management. It builds a cohesive investment ecosystem across credit, private equity, and real estate markets. The firm combines contrarian and distressed strategies to manage diverse portfolios, serving institutional and individual investors with a focus on long-term value creation.
Apollo’s revenue engine balances fees from private equity, hedge funds, and real estate management. It operates with a strategic presence in North America, Europe, and Asia, investing across industries from energy to technology. Its robust economic moat derives from deep market expertise and a disciplined capital allocation framework, shaping the future of alternative investing.
Financial Performance & Fundamental Metrics
I analyze Apollo Global Management’s income statement, key financial ratios, and dividend payout policy to reveal its core profitability and capital allocation efficiency.
Income Statement
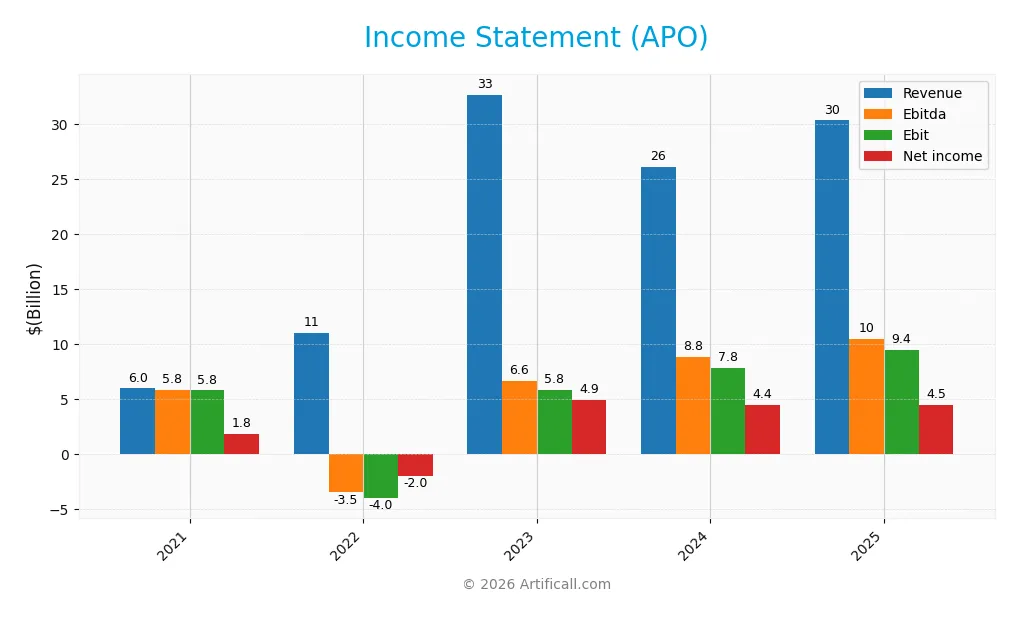
The table below summarizes Apollo Global Management’s key income statement figures for fiscal years 2021 through 2025.
| 2021 | 2022 | 2023 | 2024 | 2025 | |
|---|---|---|---|---|---|
| Revenue | 5.95B | 10.97B | 32.64B | 26.11B | 30.30B |
| Cost of Revenue | 778M | 927M | 1.03B | 1.14B | 3.49B |
| Operating Expenses | 3.20B | 14.42B | 25.47B | 16.68B | 16.38B |
| Gross Profit | 5.17B | 10.04B | 31.62B | 24.97B | 26.81B |
| EBITDA | 5.80B | -3.50B | 6.65B | 8.85B | 10.49B |
| EBIT | 5.77B | -4.03B | 5.84B | 7.77B | 9.45B |
| Interest Expense | 907M | 124M | 258M | 226M | 326M |
| Net Income | 1.84B | -1.96B | 4.88B | 4.43B | 4.48B |
| EPS | 7.32 | -3.43 | 8.32 | 7.39 | 7.31 |
| Filing Date | 2021-12-31 | 2023-03-01 | 2024-02-27 | 2025-02-24 | 2026-02-25 |
Income Statement Evolution
Apollo Global Management’s revenue rose sharply by 16% from 2024 to 2025, continuing a strong five-year growth trend of 409%. Gross profit also increased by 7%, supporting a stable gross margin near 88%. Despite higher operating expenses matching revenue growth, the EBIT margin improved to 31%, reflecting operational leverage. Net income grew overall but showed a slight decline in margin, falling by 12.7% in the last year.
Is the Income Statement Favorable?
In 2025, Apollo’s fundamentals remain largely favorable. Revenue growth outpaced expenses, sustaining robust profitability and a strong EBIT margin. Interest expenses stayed low at just over 1% of revenue, enhancing net income quality. However, a slight contraction in net margin and EPS signals some pressure on bottom-line efficiency. Overall, the income statement demonstrates solid operational performance but warrants monitoring margin trends closely.
Financial Ratios
Below is a summary of key financial ratios for Apollo Global Management, Inc. over the past five fiscal years:
| Ratios | 2021 | 2022 | 2023 | 2024 | 2025 |
|---|---|---|---|---|---|
| Net Margin | 31% | -18% | 15% | 17% | 15% |
| ROE | 49% | -30% | 35% | 26% | 19% |
| ROIC | 7% | -5% | 6% | 7% | -2% |
| P/E | 9.3x | -19.0x | 11.1x | 21.9x | 19.6x |
| P/B | 4.52x | 5.62x | 3.86x | 5.61x | 3.77x |
| Current Ratio | 0.63x | 0.73x | 0.82x | 0.80x | 0.00x* |
| Quick Ratio | 0.63x | 0.73x | 0.82x | 0.80x | 0.00x* |
| D/E | 3.75x | 1.08x | 0.58x | 0.61x | 0.57x |
| Debt-to-Assets | 47% | 3% | 3% | 3% | 3% |
| Interest Coverage | 2.18x | -35.3x | 23.8x | 36.7x | 32.0x |
| Asset Turnover | 0.20x | 0.04x | 0.10x | 0.07x | 0.07x |
| Fixed Asset Turnover | 10.3x | 12.5x | 0.0x* | 0.0x* | 0.0x* |
| Dividend Yield | 3.23% | 2.58% | 1.91% | 1.23% | 1.38% |
*Note: Current and Quick Ratios are zero in 2025, likely indicating missing or unusual data. Fixed Asset Turnover is zero or not reported in recent years.
Evolution of Financial Ratios
Apollo Global Management’s Return on Equity (ROE) showed volatility, peaking at 48.5% in 2021 and declining to 19.2% in 2025. The Current Ratio remained weak, hitting zero in 2025 after fluctuating near 0.8 prior. Debt-to-Equity ratio improved notably from a high 3.75 in 2021 to 0.57 in 2025, indicating reduced leverage. Profitability margins stabilized with net margin around 14.8% in 2025.
Are the Financial Ratios Fovorable?
In 2025, Apollo’s profitability ratios, including net margin (14.8%) and ROE (19.2%), are favorable, reflecting efficient capital use. Liquidity ratios are unfavorable with a zero Current and Quick Ratio, posing a risk. Leverage metrics are neutral to favorable, with debt-to-equity at 0.57 and low debt-to-assets of 2.9%. Asset turnover and price-to-book ratios remain unfavorable, while interest coverage is strong at nearly 29x. Overall, ratios lean slightly unfavorable.
Shareholder Return Policy
Apollo Global Management, Inc. maintains a dividend payout ratio around 27%, with dividends per share slightly fluctuating between $1.78 and $2.34 over recent years. The company also supports share buybacks, funded comfortably by free cash flow coverage above 90%, indicating prudent capital allocation.
The annual dividend yield ranges from 1.2% to 3.2%, reflecting moderate shareholder distributions. This balanced approach, combining dividends and buybacks with strong free cash flow backing, suggests a sustainable return policy aligned with long-term shareholder value creation.
Score analysis
The following radar chart highlights Apollo Global Management’s valuation and financial performance scores:
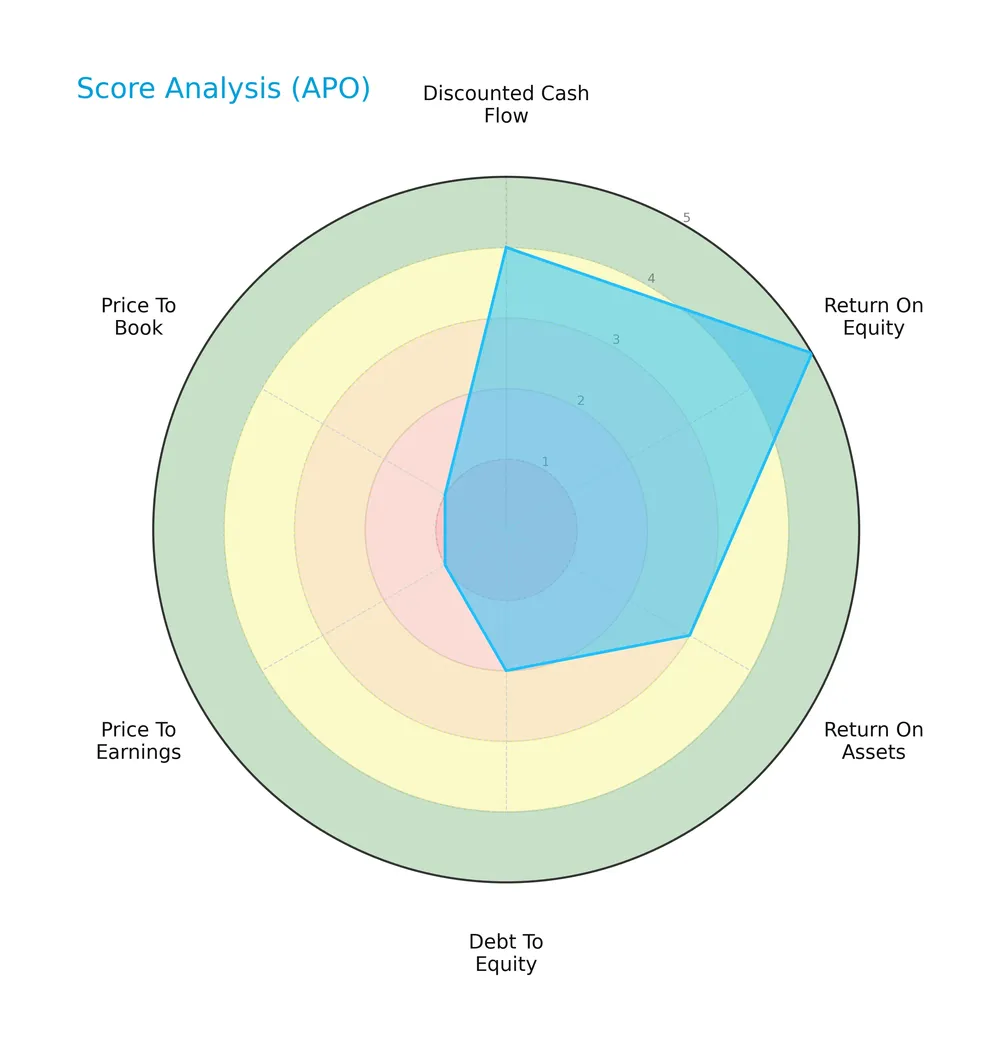
Apollo’s discounted cash flow and return on equity scores are favorable, indicating solid profitability. However, the debt-to-equity and valuation metrics score poorly, signaling financial leverage concerns and expensive pricing relative to book and earnings.
Analysis of the company’s bankruptcy risk
Apollo Global Management’s Altman Z-Score places it in the distress zone, suggesting a high risk of financial distress and potential bankruptcy:

Is the company in good financial health?
The Piotroski Score diagram assesses Apollo’s overall financial strength across key metrics:

With a Piotroski Score of 4, Apollo shows average financial health. This middling score reflects mixed signals in profitability, leverage, and operational efficiency, without clear strength or weakness.
Competitive Landscape & Sector Positioning
This section analyzes Apollo Global Management’s strategic positioning, revenue segments, key products, and competitors. I will assess whether Apollo holds a competitive advantage over its industry peers.
Strategic Positioning
Apollo Global Management concentrates on asset management and retirement services, with revenues heavily weighted toward retirement services (over $27B in 2025). Its investments span North America, Europe, and Asia, focusing on credit, private equity, and real estate sectors across diverse industries.
Revenue by Segment
This pie chart illustrates Apollo Global Management, Inc.’s revenue distribution by segment for the fiscal year 2025, highlighting the relative contributions of key business units.
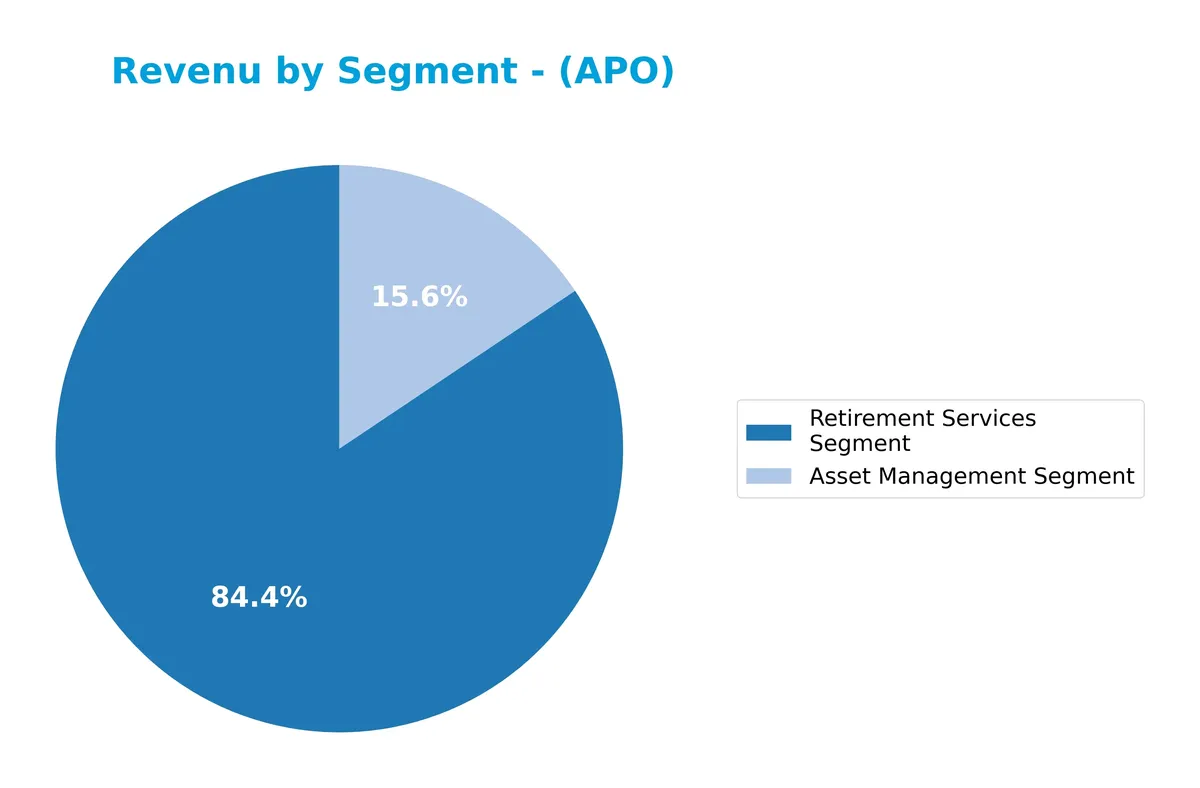
Apollo’s revenue predominantly stems from its Retirement Services Segment, which generated $27B in 2025, far exceeding the $5B from Asset Management. The Retirement Services segment shows strong growth since 2024’s $21.9B, indicating an accelerating focus. Asset Management grows steadily but lags, suggesting a concentration risk in Retirement Services as the primary driver. This shift demands close monitoring for diversification balance.
Key Products & Brands
Apollo Global Management generates revenue through the following core business segments:
| Product | Description |
|---|---|
| Retirement Services Segment | Provides retirement investment products and services, contributing $27B in revenue in 2025. |
| Asset Management Segment | Manages private equity, credit, and real estate investments globally, with $5B revenue in 2025. |
Apollo’s revenue mainly derives from retirement services and asset management. The retirement segment leads, reflecting strong demand in retirement investment solutions. Asset management complements with diverse private equity and credit products.
Main Competitors
Apollo Global Management, Inc. competes with 71 firms in the sector; below is a list of the top 10 leaders by market capitalization:
| Competitor | Market Cap. |
|---|---|
| Berkshire Hathaway Inc. | 1.07T |
| JPMorgan Chase & Co. | 886B |
| Visa Inc. | 672B |
| Mastercard Incorporated | 506B |
| Bank of America Corporation | 409B |
| Wells Fargo & Company | 310B |
| Morgan Stanley | 289B |
| The Goldman Sachs Group, Inc. | 287B |
| American Express Company | 260B |
| Citigroup Inc. | 221B |
Apollo Global Management ranks 25th among 71 competitors. Its market cap is 6.35% that of Berkshire Hathaway, the sector leader. Apollo sits below the top 10 average market cap of 491B but above the sector median of 55B. It enjoys a 31.86% market cap gap over its closest higher-ranked rival, signaling a notable scale difference.
Comparisons with competitors
Check out how we compare the company to its competitors:
Aucun article trouvé pour ces critères.
Does APO have a competitive advantage?
Apollo Global Management does not present a competitive advantage based on its ROIC being significantly below WACC, indicating value destruction and declining profitability. This negative trend contrasts with typical asset management firms that sustain value creation through efficient capital allocation.
Looking ahead, Apollo’s broad investment focus across credit, private equity, and real estate, along with geographic diversification in North America, Europe, and Asia, offers opportunities to capture growth in various markets. The firm’s active deployment of contrarian and distressed strategies may provide avenues for future portfolio expansion.
SWOT Analysis
This SWOT analysis highlights Apollo Global Management’s core strategic factors to guide investment decisions.
Strengths
- strong revenue growth of 16% in 2025
- favorable EBIT margin at 31%
- diversified investment portfolio across credit, private equity, and real estate
Weaknesses
- negative ROIC of -2.48% signals value destruction
- weak liquidity ratios with current and quick ratios at 0
- declining net margin over the long term
Opportunities
- expansion in global markets including Asia and Europe
- growing demand for alternative investments
- potential for industry consolidation deals
Threats
- high beta at 1.56 indicates elevated market risk
- regulatory risks in financial services sector
- competition from larger asset managers and hedge funds
Apollo’s strengths in margin and growth are offset by declining profitability and liquidity concerns. Strategic focus should prioritize improving capital efficiency and strengthening balance sheet resilience while leveraging global expansion opportunities.
Stock Price Action Analysis
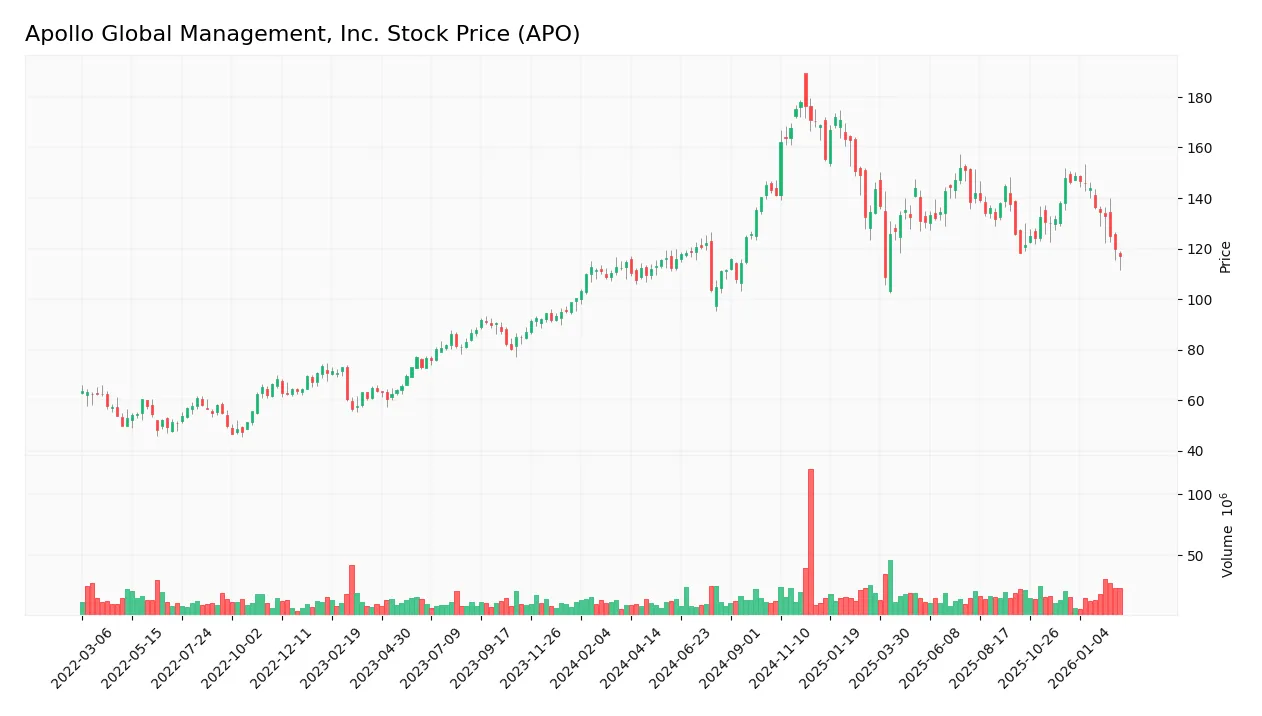
The weekly chart displays Apollo Global Management, Inc. (APO) stock price movements over the past 12 months, highlighting key support and resistance levels:
Trend Analysis
Over the past year, APO’s stock rose 2.22%, signaling a bullish trend with decelerating momentum. The price ranged from a low of 103.53 to a peak at 177.85, showing notable volatility (std dev 18.44). Recent months reveal a sharp 20.83% decline, reversing the broader positive trend.
Volume Analysis
Trading volume increased overall, with buyers holding a slight 50.61% edge historically. However, in the recent three months, sellers dominated with only 13.04% buyer volume, indicating bearish sentiment and reduced buyer participation amid rising activity.
Target Prices
Analysts set a clear target consensus for Apollo Global Management, Inc. reflecting moderate upside potential.
| Target Low | Target High | Consensus |
|---|---|---|
| 136 | 186 | 157.25 |
The target range from 136 to 186 shows analysts expect steady growth. The consensus at 157.25 suggests confidence but acknowledges valuation risks.

Don’t Let Luck Decide Your Entry Point
Optimize your entry points with our advanced ProRealTime indicators. You’ll get efficient buy signals with precise price targets for maximum performance. Start outperforming now!
Analyst & Consumer Opinions
This section reviews analyst ratings and consumer feedback to provide a balanced view of Apollo Global Management, Inc.’s current standing.
Stock Grades
Here is a summary of recent stock grades from recognized financial institutions for Apollo Global Management, Inc.:
| Grading Company | Action | New Grade | Date |
|---|---|---|---|
| UBS | Maintain | Buy | 2026-02-20 |
| Piper Sandler | Maintain | Overweight | 2026-02-10 |
| Barclays | Maintain | Overweight | 2026-02-10 |
| Morgan Stanley | Maintain | Overweight | 2026-02-10 |
| JP Morgan | Maintain | Overweight | 2026-02-10 |
| UBS | Maintain | Buy | 2026-01-13 |
| Barclays | Maintain | Overweight | 2026-01-09 |
| Barclays | Maintain | Overweight | 2025-12-12 |
| Barclays | Maintain | Overweight | 2025-11-25 |
| Morgan Stanley | Upgrade | Overweight | 2025-11-20 |
The consensus displays a steady pattern of positive ratings across major banks, with no recent downgrades. This consistent “Buy” and “Overweight” stance signals sustained confidence in the stock’s outlook.
Consumer Opinions
Apollo Global Management, Inc. evokes strong reactions from its clients, reflecting its complex role in alternative asset management.
| Positive Reviews | Negative Reviews |
|---|---|
| “Apollo delivers consistent returns, even in volatile markets.” | “Customer service response times can be slow.” |
| “Their deep industry knowledge gives me confidence in their investments.” | “High fees compared to peers reduce net gains.” |
| “I appreciate their transparency in reporting and communication.” | “Occasional lack of clarity on fund risks worries me.” |
Overall, Apollo’s clients praise its robust performance and expertise. However, service responsiveness and fee structures remain notable pain points.
Risk Analysis
Below is a detailed table outlining Apollo Global Management’s key risk factors, their likelihood, and potential impact:
| Category | Description | Probability | Impact |
|---|---|---|---|
| Financial Health | Altman Z-Score in distress zone indicates high bankruptcy risk despite moderate Piotroski score. | High | High |
| Liquidity | Current and quick ratios at zero signal poor short-term liquidity, raising cash flow concerns. | High | Medium |
| Valuation | Unfavorable P/E (19.64) and P/B (3.77) ratios suggest the stock may be overvalued relative to peers. | Medium | Medium |
| Operational Efficiency | Low asset turnover (0.07) and zero fixed asset turnover hint at inefficient capital deployment. | Medium | Medium |
| Leverage | Moderate debt-to-equity (0.57) with good interest coverage (28.98) shows manageable but present risk. | Medium | Low |
| Market Volatility | High beta (1.56) exposes the stock to amplified market swings, increasing price volatility. | High | Medium |
Apollo faces notable financial distress risks, underscored by its Altman Z-Score below zero. Liquidity is a red flag with zero current and quick ratios, uncommon in asset management firms. Despite a solid ROE (19.2%), its negative ROIC (-2.48%) versus a 9.59% WACC signals value destruction. Market volatility remains high, demanding cautious position sizing.
Should You Buy Apollo Global Management, Inc.?
Apollo Global Management appears to be a firm with improving profitability but a deteriorating competitive moat, suggesting value destruction. Despite a manageable leverage profile, significant valuation concerns persist. The overall B rating reflects a nuanced risk-reward balance.
Strength & Efficiency Pillars
Apollo Global Management, Inc. demonstrates strong profitability with a gross margin of 88.47% and an EBIT margin of 31.18%. The company maintains a solid net margin of 14.79% and a return on equity (ROE) of 19.2%, reflecting effective capital utilization. However, its return on invested capital (ROIC) stands at -2.48%, below the weighted average cost of capital (WACC) of 9.59%, indicating value destruction rather than creation. Operational margins remain favorable despite challenges in capital efficiency.
Weaknesses and Drawbacks
The company is in financial distress, as signaled by an Altman Z-Score of -0.72, well below the 1.8 distress threshold, implying a high bankruptcy risk. Apollo faces significant valuation concerns, with a price-to-book ratio of 3.77 labeled as very unfavorable, and a moderately unfavorable price-to-earnings ratio of 19.64. Liquidity is a critical red flag, with current and quick ratios reported at zero, increasing solvency risk. Additionally, recent market behavior is seller dominant (13.04% buyer dominance), amplifying short-term headwinds.
Our Final Verdict about Apollo Global Management, Inc.
Despite favorable operational margins and a bullish long-term stock trend, Apollo’s severe solvency risk indicated by its distressed Altman Z-Score makes the investment profile highly speculative. The financial distress overshadows profitability strengths, suggesting that conservative investors may consider this too risky. This profile might appeal only to risk-tolerant investors seeking deep value opportunities amid uncertainty.
Disclaimer: This content is for informational purposes only and does not constitute financial, investment, or other professional advice. Investing in financial markets involves a significant risk of loss, and past performance is not indicative of future results.
Additional Resources
- Is Apollo Global Management (APO) Attractive After Recent Share Price Pullback? – Yahoo Finance (Feb 24, 2026)
- 12,831 Shares in Apollo Global Management Inc. $APO Purchased by Equitable Trust Co. – MarketBeat (Feb 24, 2026)
- Apollo Global: The Credit Giant Being Treated Like A SaaS Fund (NYSE:APO) – Seeking Alpha (Feb 24, 2026)
- Apollo Global Management, Inc. (APO): A Bull Case Theory – Insider Monkey (Feb 23, 2026)
- INVESTOR ALERT: Pomerantz Law Firm Investigates Claims On Behalf of Investors of Apollo Global Management, Inc. – APO – PR Newswire (Feb 20, 2026)
For more information about Apollo Global Management, Inc., please visit the official website: apollo.com