Home > Analyses > Energy > APA Corporation
APA Corporation fuels modern life by extracting and delivering vital oil and gas resources across key global regions. It commands a strong presence in the energy sector with flagship operations in the Permian Basin and international ventures spanning Egypt and the UK. Renowned for operational efficiency and strategic pipeline ownership, APA continually drives industry innovation. As energy markets evolve, I ask whether APA’s fundamentals can sustain its growth and justify its current valuation.

Table of contents
Business Model & Company Overview
APA Corporation, founded in 1954 and headquartered in Houston, Texas, stands as a significant player in the Oil & Gas Exploration & Production industry. The company’s core mission integrates upstream exploration with midstream operations, creating a seamless ecosystem that spans from resource discovery to processing and transmission. Its diversified asset base includes key operations in the United States, Egypt, the United Kingdom, and offshore Suriname, underscoring its global footprint.
The company’s revenue engine balances exploration-driven production with stable cash flows from its gathering and pipeline assets, including four Permian-to-Gulf Coast pipelines. This blend of upstream and midstream activities supports operational resilience across fluctuating commodity cycles. APA’s strategic presence in the Americas, Europe, and Africa bolsters its competitive position. I see its economic moat rooted in integrated infrastructure and geographic diversification, which collectively shape the future of energy supply.
Financial Performance & Fundamental Metrics
I analyze APA Corporation’s income statement, key financial ratios, and dividend payout policy to assess its profitability, efficiency, and shareholder returns.
Income Statement
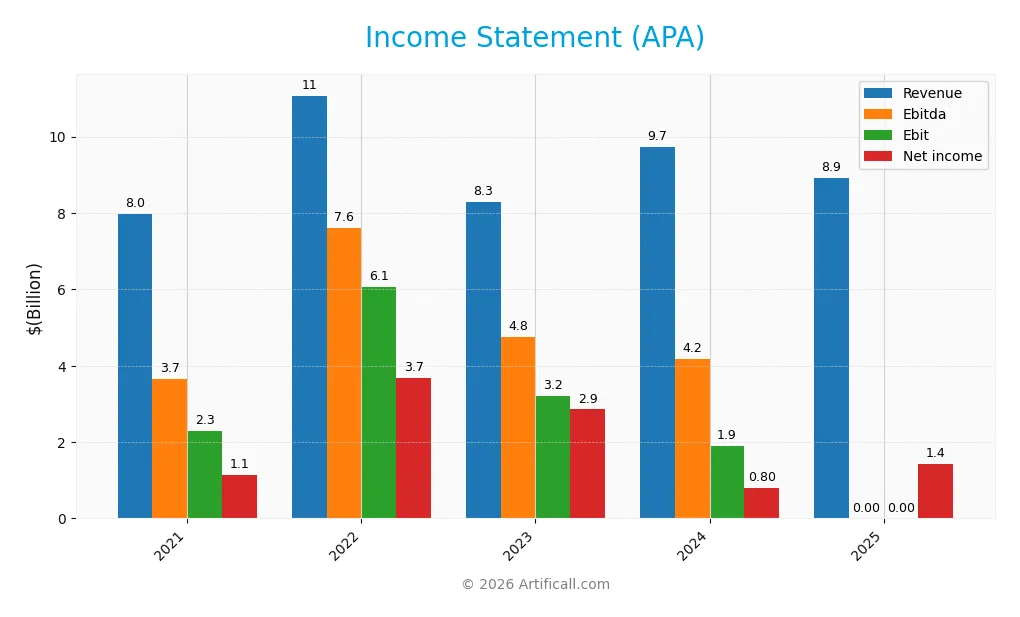
The table below details APA Corporation’s key income statement items over the past five fiscal years, highlighting revenue, expenses, profitability, and earnings per share.
| 2021 | 2022 | 2023 | 2024 | 2025 | |
|---|---|---|---|---|---|
| Revenue | 7.99B | 11.08B | 8.28B | 9.74B | 8.92B |
| Cost of Revenue | 4.45B | 4.82B | 4.05B | 5.44B | 0 |
| Operating Expenses | 848M | 1.17B | 869M | 1.10B | 1.50B |
| Gross Profit | 3.54B | 6.26B | 4.23B | 4.30B | 0 |
| EBITDA | 3.66B | 7.61B | 4.75B | 4.17B | 0 |
| EBIT | 2.30B | 6.06B | 3.21B | 1.91B | 0 |
| Interest Expense | 418M | 322M | 331M | 379M | 0 |
| Net Income | 973M | 3.67B | 2.85B | 804M | 1.43B |
| EPS | 2.60 | 11.07 | 9.27 | 2.28 | 3.99 |
| Filing Date | 2022-02-22 | 2023-02-23 | 2024-02-22 | 2025-02-28 | 2026-02-25 |
Income Statement Evolution
APA Corporation’s revenue grew 11.7% from 2021 to 2025 but declined 8.4% in the last year. Net income increased 26.3% overall, with a strong 94.7% jump in the most recent year. Margins weakened sharply in 2025, as gross and EBIT margins fell to zero, while net margin improved to 16.1%.
Is the Income Statement Favorable?
The 2025 income statement shows mixed fundamentals. Revenue and gross profit declined, signaling margin pressure and operational challenges. However, net income and EPS rose substantially, driven by lower interest expenses and improved net margin. Overall, APA’s income statement trends are favorable, but the erosion of core profitability warrants close monitoring.
Financial Ratios
The following table summarizes key financial ratios for APA Corporation over the last five fiscal years, providing insight into profitability, valuation, liquidity, leverage, efficiency, and dividend metrics:
| Ratios | 2021 | 2022 | 2023 | 2024 | 2025 |
|---|---|---|---|---|---|
| Net Margin | 14.2% | 33.2% | 34.5% | 8.3% | 16.1% |
| ROE | -71.2% | 868.6% | 107.5% | 15.2% | 12.9% |
| ROIC | 16.3% | 34.8% | 25.9% | 14.0% | N/A |
| P/E | 8.9 | 4.2 | 3.9 | 10.1 | 6.1 |
| P/B | -6.3 | 36.6 | 4.2 | 1.5 | 0.8 |
| Current Ratio | 1.12 | 0.93 | 1.02 | 1.15 | 0.22 |
| Quick Ratio | 0.90 | 0.78 | 0.84 | 1.01 | 0.22 |
| D/E | -4.77 | 13.29 | 2.00 | 1.17 | 0.38 |
| Debt-to-Assets | 57.2% | 42.7% | 34.8% | 31.8% | 24.1% |
| Interest Coverage | 6.4 | 15.8 | 10.1 | 8.4 | 0 |
| Asset Turnover | 0.60 | 0.84 | 0.54 | 0.50 | 0.50 |
| Fixed Asset Turnover | 0.96 | 1.23 | 0.82 | 0.77 | 0.70 |
| Dividend Yield | 0.52% | 1.34% | 2.79% | 4.33% | 4.09% |
Evolution of Financial Ratios
APA Corporation’s Return on Equity (ROE) showed volatility, peaking in 2023 before settling at 12.9% in 2025. The Current Ratio declined sharply, reaching an unfavorable 0.22 in 2025, signaling liquidity stress. Debt-to-Equity improved significantly, dropping to 0.38 in 2025, reflecting better leverage management. Profitability margins fluctuated but ended with a strong net margin of 16.1%.
Are the Financial Ratios Favorable?
In 2025, APA’s profitability was solid with a favorable net margin and a neutral ROE. Liquidity ratios, including the current and quick ratios, were unfavorable, indicating potential short-term funding issues. Leverage metrics, such as debt-to-equity and debt-to-assets, were favorable, showing controlled debt levels. Market valuation ratios, including P/E and P/B, were attractive. Overall, the ratios present a slightly favorable financial profile with notable liquidity risks.
Shareholder Return Policy
APA Corporation maintains a consistent dividend payout, with a 2025 payout ratio near 25% and a 4.1% annual yield. The dividend per share has remained stable at $1, supported by strong free cash flow coverage. The company also engages in share buybacks, complementing its cash returns to shareholders.
This balanced approach suggests APA prioritizes sustainable distributions without overleveraging. Given its free cash flow backing and moderate payout ratio, the policy appears aligned with long-term shareholder value creation while managing risks of excessive repurchases or dividend strain.
Score analysis
The radar chart below visualizes APA Corporation’s key financial metric scores for a comprehensive investment perspective:

APA shows strong profitability with very favorable returns on equity and assets. However, its discounted cash flow, debt-to-equity, and price-to-book scores are unfavorable. Price-to-earnings sits at a moderate level, balancing the profile.
Analysis of the company’s bankruptcy risk
APA’s Altman Z-Score places it firmly in the distress zone, indicating a high risk of financial distress and potential bankruptcy:

Is the company in good financial health?
The Piotroski Score diagram illustrates APA’s financial health based on nine fundamental criteria:

With a Piotroski Score of 6, APA ranks as average in financial strength. This suggests moderate operational efficiency and profitability, but not the robustness seen in stronger companies.
Competitive Landscape & Sector Positioning
This analysis explores APA Corporation’s sector positioning within Oil & Gas Exploration & Production. I will examine the company’s strategic stance, revenue breakdown, and key products. The review will also cover main competitors and APA’s competitive advantages. I aim to determine whether APA holds a distinct competitive edge over its rivals.
Strategic Positioning
APA Corporation concentrates on oil and gas exploration and production, with a product mix heavily weighted toward self-produced hydrocarbons. Geographically, it balances revenue between the United States and the North Sea, reflecting a focused yet internationally diversified footprint.
Revenue by Segment
The pie chart illustrates APA Corporation’s revenue breakdown by segment for the fiscal year 2024, highlighting the relative contribution of oil and gas sources.
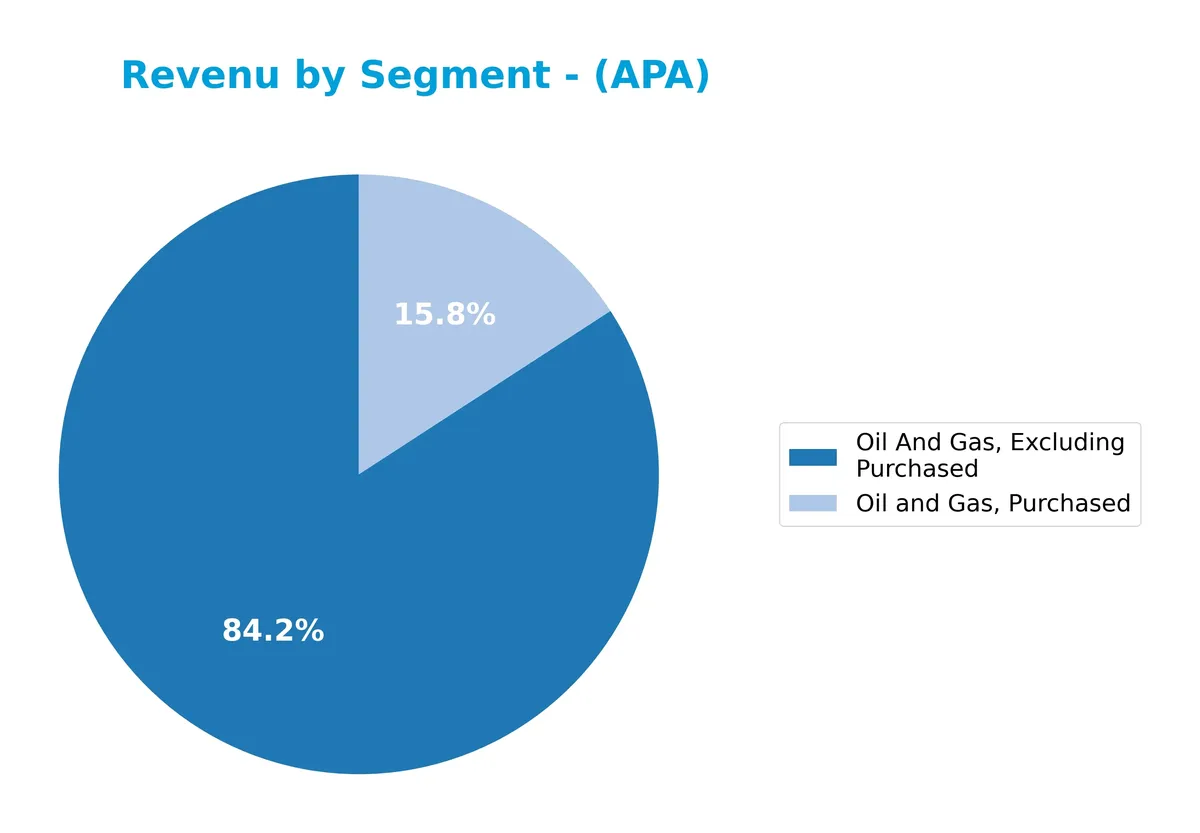
Oil and gas excluding purchased volumes dominate APA’s revenue at 8.2B in 2024, showing steady growth from 7.4B in 2023. Purchased oil and gas contribute 1.5B, nearly doubling since 2023’s 890M. This shift suggests APA increasingly leverages purchased resources alongside core production. The accelerating growth in both segments underscores expanding scale but also raises concentration risk in market-exposed commodity prices.
Key Products & Brands
Below is a summary of APA Corporation’s main products and brands based on recent revenue segmentation:
| Product | Description |
|---|---|
| Oil and Gas, Excluding Purchased | Revenue from exploration, development, and production of oil and gas properties directly owned by APA. |
| Oil and Gas, Purchased | Revenue from oil and gas purchased for resale or processing, rather than produced by APA itself. |
APA Corporation’s revenue primarily derives from its core oil and gas exploration and production activities. The company generates most sales from its owned reserves, supplemented by purchased oil and gas, reflecting a typical vertical integration approach in the energy sector.
Main Competitors
The sector includes 10 main competitors; the table below lists the top 10 leaders by market capitalization:
| Competitor | Market Cap. |
|---|---|
| ConocoPhillips | 120.5B |
| EOG Resources, Inc. | 58.8B |
| Diamondback Energy, Inc. | 44.3B |
| Occidental Petroleum Corporation | 41.8B |
| EQT Corporation | 33.4B |
| Expand Energy Corporation | 26.1B |
| Devon Energy Corporation | 24.2B |
| Texas Pacific Land Corporation | 20.5B |
| Coterra Energy Inc. | 20.3B |
| APA Corporation | 9.0B |
APA Corporation ranks 10th among its top 10 competitors in Oil & Gas Exploration & Production. Its market cap equals 8.2% of the sector leader, ConocoPhillips. APA sits below both the 39.9B average market cap of the top 10 and the 29.8B median for the sector. Notably, it is 105% smaller than its next closest competitor, Coterra Energy.
Comparisons with competitors
Check out how we compare the company to its competitors:
Does APA have a competitive advantage?
APA Corporation currently lacks a competitive advantage, as its ROIC is 5.54% below WACC, indicating value destruction and declining profitability from 2021 to 2025. The company shows no excess capital to reinvest, signaling operational inefficiency.
Looking ahead, APA maintains diverse operations across the US, North Sea, Egypt, and Suriname, with assets in pipelines and processing. This geographic and asset diversification may offer growth opportunities in new markets and energy segments despite recent margin pressures.
SWOT Analysis
This analysis highlights APA Corporation’s internal capabilities and external market conditions to guide strategic decisions.
Strengths
- diversified geographic footprint
- favorable net margin of 16%
- attractive dividend yield of 4.09%
Weaknesses
- declining ROIC, destroying value
- weak liquidity ratios (current ratio 0.22)
- negative EBIT and gross margin trends
Opportunities
- expansion in Permian-to-Gulf Coast pipelines
- recovery in oil prices could boost revenue
- operational improvements to reverse declining margins
Threats
- volatile oil and gas prices
- regulatory risks in multiple jurisdictions
- geopolitical tensions affecting key regions
APA’s strengths in dividend yield and geographic diversity are overshadowed by declining profitability and liquidity risks. Management must focus on operational efficiency and capital allocation to capture growth opportunities while mitigating sector volatility.
Stock Price Action Analysis
The upcoming weekly chart illustrates APA Corporation’s stock price movements and key inflection points over the past 12 months:
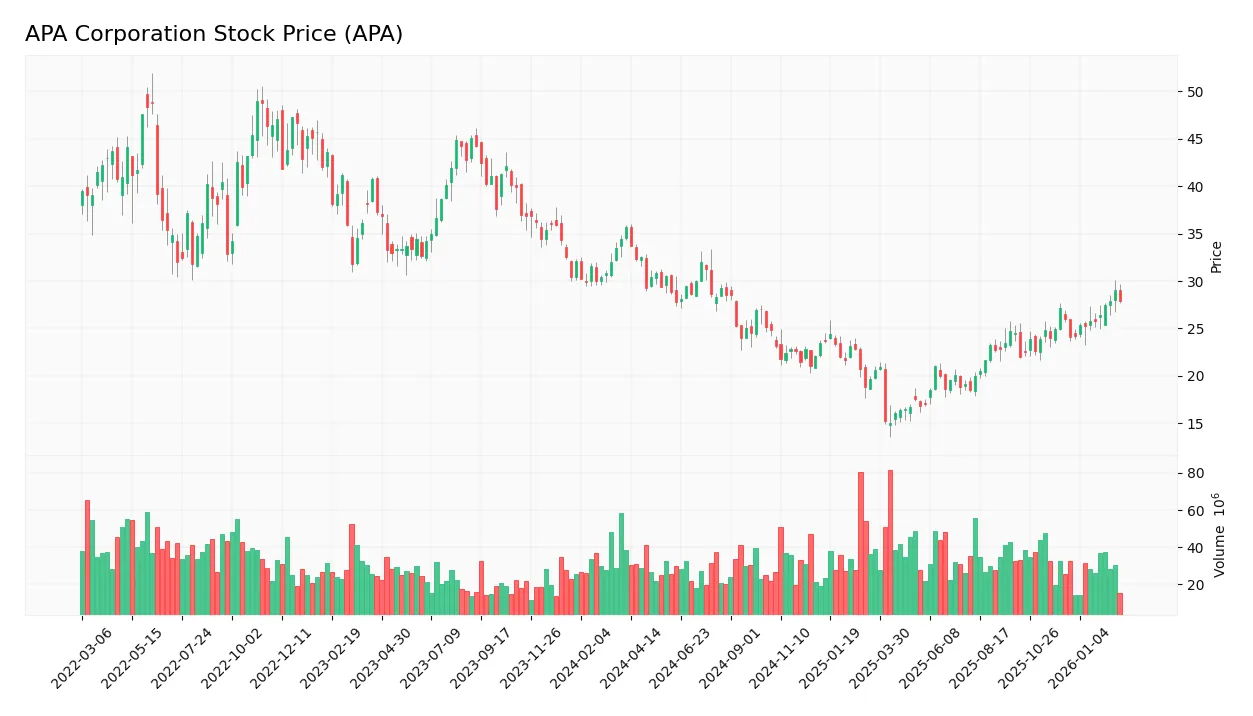
Trend Analysis
Over the past 12 months, APA Corporation’s stock declined by 22.1%, confirming a bearish trend with accelerating downside momentum. The price ranged from a high of 35.74 to a low of 15.04, reflecting significant volatility, supported by a 4.41 standard deviation.
Volume Analysis
Trading volume totals 3.85B shares, with buyer volume at 2.13B (55.3%) and seller volume at 1.70B (44.7%), showing an increasing volume trend. Over the last three months, buyer dominance strengthened to 67.2%, suggesting rising investor interest and buyer-driven market participation.
Target Prices
Analysts present a moderately bullish target consensus for APA Corporation.
| Target Low | Target High | Consensus |
|---|---|---|
| 21 | 40 | 27.75 |
The target range reflects cautious optimism, with a consensus price suggesting upside potential from current levels.

Don’t Let Luck Decide Your Entry Point
Optimize your entry points with our advanced ProRealTime indicators. You’ll get efficient buy signals with precise price targets for maximum performance. Start outperforming now!
Analyst & Consumer Opinions
This section examines APA Corporation’s analyst ratings and consumer feedback to provide a balanced performance overview.
Stock Grades
Here is the latest summary of APA Corporation’s analyst grades from recognized financial institutions:
| Grading Company | Action | New Grade | Date |
|---|---|---|---|
| Stephens & Co. | Maintain | Equal Weight | 2026-02-17 |
| RBC Capital | Maintain | Sector Perform | 2026-01-26 |
| Morgan Stanley | Maintain | Underweight | 2026-01-23 |
| Barclays | Downgrade | Underweight | 2026-01-21 |
| Bernstein | Maintain | Market Perform | 2026-01-05 |
| UBS | Maintain | Neutral | 2025-12-12 |
| Mizuho | Maintain | Underperform | 2025-12-12 |
| Johnson Rice | Upgrade | Accumulate | 2025-12-05 |
| Citigroup | Maintain | Neutral | 2025-11-26 |
| Goldman Sachs | Maintain | Sell | 2025-11-21 |
Most grades lean toward neutral or cautious stances, with a notable downgrade by Barclays and continued underweight ratings from Morgan Stanley and Mizuho. The consensus remains a Hold, reflecting mixed market sentiment.
Consumer Opinions
APA Corporation sparks mixed feelings among its customer base, reflecting diverse experiences with its services.
| Positive Reviews | Negative Reviews |
|---|---|
| Reliable energy supply even during outages | Customer service response times are slow |
| Competitive pricing compared to peers | Some billing errors reported |
| Strong commitment to sustainability | Limited communication on project delays |
Overall, consumers praise APA’s reliability and eco-conscious efforts. However, slow customer support and communication gaps remain persistent concerns. Addressing these issues could enhance customer loyalty significantly.
Risk Analysis
The table below summarizes key risks faced by APA Corporation, highlighting their likelihood and potential impact on the business:
| Category | Description | Probability | Impact |
|---|---|---|---|
| Liquidity Risk | Current and quick ratios at 0.22 indicate tight short-term liquidity. | High | High |
| Financial Distress | Altman Z-Score of 1.74 places APA in the distress zone, signaling bankruptcy risk. | Moderate | Very High |
| Operational Risk | Fixed asset turnover is low at 0.7, suggesting inefficiencies in asset use. | Moderate | Medium |
| Interest Coverage | Interest coverage ratio at 0 flags inability to cover interest expenses. | High | High |
| Market Volatility | Beta of 0.698 suggests less volatility, but oil price swings remain a factor. | Moderate | Medium |
Liquidity and interest coverage risks stand out as the most pressing. APA’s current ratio of 0.22 is dangerously low, raising red flags about meeting short-term obligations. The Altman Z-Score confirms financial distress, underscoring the need for caution. Historically, energy firms with similar profiles have struggled during downturns, amplifying these concerns.
Should You Buy APA Corporation?
APA Corporation appears to be a company with improving profitability and operational efficiency, yet its competitive moat could be seen as eroding due to declining value creation. Despite manageable leverage, the overall rating of B+ suggests a very favorable profile tempered by financial distress risks.
Strength & Efficiency Pillars
APA Corporation maintains a solid net margin of 16.08%, signaling operational profitability even amid sector challenges. The return on equity stands at a moderate 12.89%, reflecting reasonable shareholder value generation. However, the company’s return on invested capital (ROIC) is effectively zero, well below its weighted average cost of capital (WACC) at 5.54%, indicating it is not creating value through its capital investments. Despite this, APA’s efficient debt management with a debt-to-equity ratio of 0.38 supports financial flexibility.
Weaknesses and Drawbacks
APA is in financial distress, with an Altman Z-Score of 1.74, signaling elevated bankruptcy risk. This outweighs its profitability metrics and flags serious solvency concerns. The company’s liquidity is weak, with a current ratio of 0.22, far below the safe benchmark of 1.0, increasing short-term financial strain. Valuation metrics are favorable (P/E 6.12, P/B 0.79), but declining ROIC and operational inefficiencies raise red flags for long-term stability. Investors should note the bearish overall stock trend, with a 22.1% price decline heightening market pressure.
Our Final Verdict about APA Corporation
Despite APA’s operational profitability, its placement in the distress zone with a Z-score of 1.74 makes the investment profile highly speculative. The solvency risk overshadows favorable margins and recent buyer dominance, making the stock too risky for conservative capital. Investors might consider waiting for clearer signs of financial stabilization before committing capital.
Disclaimer: This content is for informational purposes only and does not constitute financial, investment, or other professional advice. Investing in financial markets involves a significant risk of loss, and past performance is not indicative of future results.
Additional Resources
- APA Corporation Announces Fourth-Quarter and Full-Year 2025 Financial and Operational Results – Yahoo Finance (Feb 25, 2026)
- APA Corporation Announces Fourth-Quarter and Full-Year 2025 Financial and Operational Results – Barchart.com (Feb 25, 2026)
- APA: Q4 Earnings Snapshot – KTEN (Feb 25, 2026)
- APA Corporation (APA) Exceeds Q4 Expectations with Strong Earnin – GuruFocus (Feb 25, 2026)
- APA Corp. reports Q4 adjusted EPS 91c, consensus 64c – TipRanks (Feb 26, 2026)
For more information about APA Corporation, please visit the official website: apacorp.com