Home > Analyses > Financial Services > Aon plc
Aon plc shapes the global risk landscape by delivering innovative insurance brokerage and risk management solutions that protect businesses and individuals daily. As a leader in commercial risk, health benefits, and retirement consulting, Aon drives industry standards with its diverse portfolio and cutting-edge advisory services. With a reputation for quality and strategic insight, I examine whether Aon’s robust fundamentals continue to support its premium valuation and long-term growth prospects.

Table of contents
Business Model & Company Overview
Aon plc, founded in 1919 and headquartered in Dublin, Ireland, stands as a global leader in the insurance brokerage sector. With 60,000 employees, it delivers a comprehensive ecosystem of risk, retirement, and health solutions. Its core mission integrates commercial risk brokerage, cyber consulting, and health benefits, creating a cohesive platform that addresses complex client needs worldwide.
Aon’s revenue engine balances advisory services with technology-driven solutions like CoverWallet and ReView. It operates strategically across the Americas, Europe, and Asia. This global footprint, combined with a robust mix of recurring consulting and insurance-linked services, secures a durable competitive advantage. Aon’s extensive expertise and diversified offerings fortify its economic moat, shaping the future of risk and health management.
Financial Performance & Fundamental Metrics
I analyze Aon plc’s income statement, key financial ratios, and dividend payout policy to assess its operational efficiency and shareholder value creation.
Income Statement
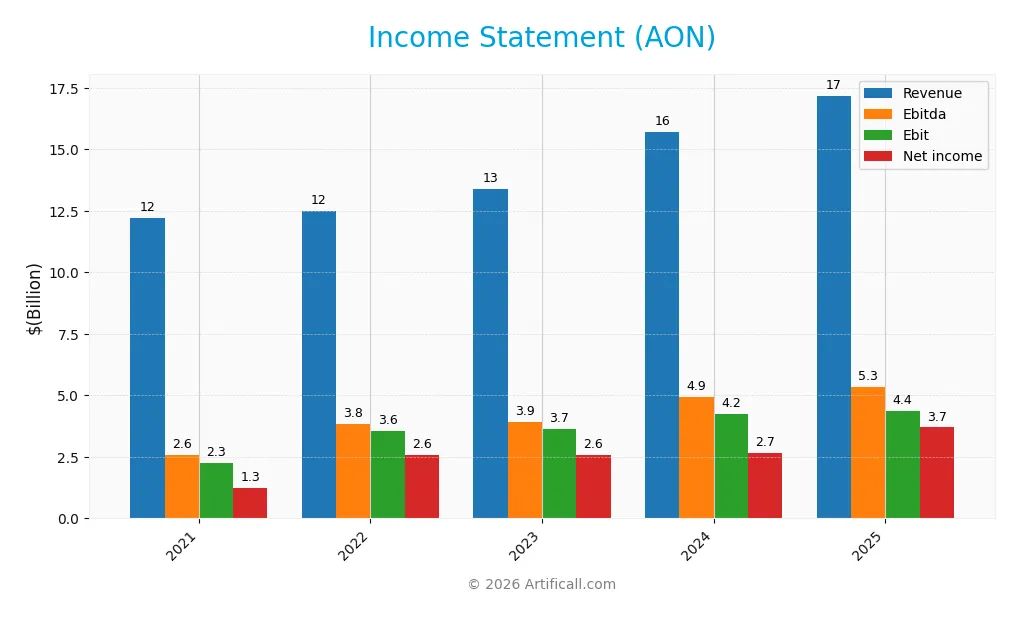
The table below summarizes Aon plc’s key income statement figures for fiscal years 2021 through 2025, illustrating consistent growth in revenue and net income.
| 2021 | 2022 | 2023 | 2024 | 2025 | |
|---|---|---|---|---|---|
| Revenue | 12.19B | 12.48B | 13.38B | 15.70B | 17.18B |
| Cost of Revenue | 6.74B | 6.48B | 6.90B | 8.28B | 8.99B |
| Operating Expenses | 3.37B | 2.33B | 2.69B | 3.58B | 3.85B |
| Gross Profit | 5.46B | 6.00B | 6.47B | 7.42B | 8.20B |
| EBITDA | 2.58B | 3.83B | 3.91B | 4.94B | 5.35B |
| EBIT | 2.25B | 3.56B | 3.65B | 4.25B | 4.38B |
| Interest Expense | 322M | 406M | 484M | 788M | 815M |
| Net Income | 1.26B | 2.59B | 2.56B | 2.65B | 3.70B |
| EPS | 5.59 | 12.23 | 12.60 | 12.55 | 17.13 |
| Filing Date | 2022-02-18 | 2023-02-17 | 2024-02-16 | 2025-02-18 | 2026-02-13 |
Income Statement Evolution
From 2021 to 2025, Aon’s revenue rose sharply by 41% to $17.2B, reflecting steady growth. Net income surged even more, nearly tripling to $3.7B, lifting net margins above 21%. Gross and operating margins also improved, signaling enhanced cost control despite rising expenses. The 2025 EBIT margin stabilized at a favorable 25.5%.
Is the Income Statement Favorable?
The 2025 income statement shows strong fundamentals. Revenue growth of 9.5% outpaced operating expenses growth, supporting margin expansion. Net margin jumped 27%, driven by disciplined cost management and controlled interest expense at 4.7% of revenue. Earnings per share rose 36%, confirming profitable capital allocation. Overall, the income statement’s health appears robust and well-positioned.
Financial Ratios
The table below summarizes key financial ratios for Aon plc over the last five fiscal years, highlighting profitability, valuation, liquidity, leverage, and efficiency metrics:
| Ratios | 2021 | 2022 | 2023 | 2024 | 2025 |
|---|---|---|---|---|---|
| Net Margin | 10.3% | 20.7% | 19.2% | 16.9% | 21.5% |
| ROE | 118.3% | -4.9% | -3.1% | 43.4% | 39.5% |
| ROIC | 9.9% | 22.7% | 22.9% | 11.2% | 12.2% |
| P/E | 53.8 | 24.5 | 23.1 | 28.6 | 20.5 |
| P/B | 63.7 | -120.1 | -71.7 | 12.4 | 8.1 |
| Current Ratio | 1.00 | 1.02 | 1.00 | 1.02 | 1.11 |
| Quick Ratio | 1.00 | 1.02 | 1.00 | 1.02 | 1.11 |
| D/E | 9.8 | -22.1 | -14.6 | 2.9 | 1.8 |
| Debt-to-Assets | 32.6% | 35.7% | 35.4% | 36.5% | 32.6% |
| Interest Coverage | 6.5 | 9.0 | 7.8 | 4.9 | 5.3 |
| Asset Turnover | 0.38 | 0.38 | 0.39 | 0.32 | 0.34 |
| Fixed Asset Turnover | 9.3 | 9.9 | 10.2 | 11.6 | 12.5 |
| Dividend Yield | 0.66% | 0.73% | 0.83% | 0.74% | 0.83% |
Evolution of Financial Ratios
From 2021 to 2025, Aon’s Return on Equity (ROE) improved markedly, reaching 39.5% in 2025, signaling enhanced profitability. The Current Ratio showed a mild uptrend, stabilizing near 1.11 in 2025, indicating steady liquidity. Meanwhile, the Debt-to-Equity Ratio decreased from extreme volatility to 1.77 in 2025, reflecting reduced financial risk and more balanced leverage.
Are the Financial Ratios Favorable?
In 2025, Aon’s profitability ratios such as net margin (21.5%) and ROE (39.5%) are favorable, supported by a return on invested capital well above its WACC. Liquidity ratios are mostly neutral to favorable, with a current ratio of 1.11 and quick ratio also at 1.11. However, leverage remains high with a debt-to-equity ratio of 1.77, flagged as unfavorable. Market valuation ratios show mixed signals: a neutral P/E at 20.5 contrasts with an unfavorable price-to-book of 8.12. Overall, half of the key ratios are favorable, suggesting a slightly favorable financial profile.
Shareholder Return Policy
Aon plc maintains a consistent dividend policy with a payout ratio near 17% in 2025 and a dividend yield of 0.83%. Dividend payments are well covered by free cash flow, reflecting prudent capital allocation. The company also engages in share buybacks, supporting shareholder returns beyond dividends.
This balanced approach aligns with sustainable value creation, as dividends remain affordable relative to earnings and cash flow. Aon’s strategy avoids excessive distributions or repurchases, preserving financial flexibility and long-term shareholder wealth.
Score analysis
The radar chart below illustrates Aon plc’s key financial scores for a comprehensive evaluation:
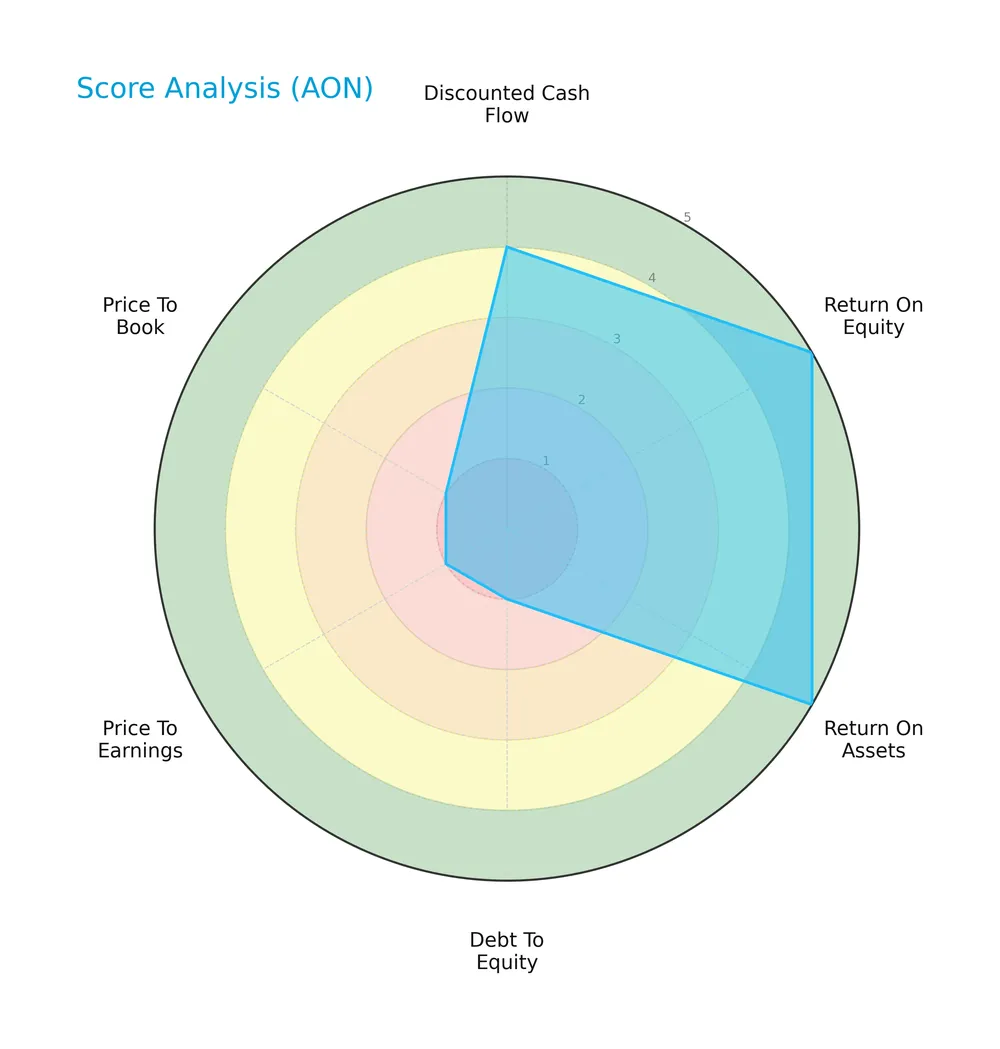
Aon scores very favorably on discounted cash flow, return on equity, and return on assets, reflecting strong profitability and valuation. However, its debt-to-equity, price-to-earnings, and price-to-book scores rank very unfavorably, signaling valuation and leverage concerns.
Analysis of the company’s bankruptcy risk
Aon’s Altman Z-Score places it in the distress zone, indicating a high risk of financial distress and potential bankruptcy:

Is the company in good financial health?
The Piotroski diagram presents Aon’s strong financial health based on its excellent Piotroski Score:

With a Piotroski Score of 8, Aon demonstrates very strong financial strength, suggesting robust profitability, liquidity, and operational efficiency.
Competitive Landscape & Sector Positioning
This section examines Aon plc’s industry position, revenue segments, and product offerings within financial services. I will analyze its main competitors and assess whether Aon holds a competitive advantage.
Strategic Positioning
Aon plc maintains a diversified product portfolio spanning commercial risk, human capital, health, reinsurance, and wealth solutions. Geographically, it balances significant exposure between the US (8.3B in 2025) and international markets, including Europe (3.2B) and Asia Pacific (1.7B), reflecting a global service footprint.
Revenue by Segment
This pie chart displays Aon plc’s revenue distribution by business segments for the fiscal year 2025, highlighting recent structural shifts and segment dominance.
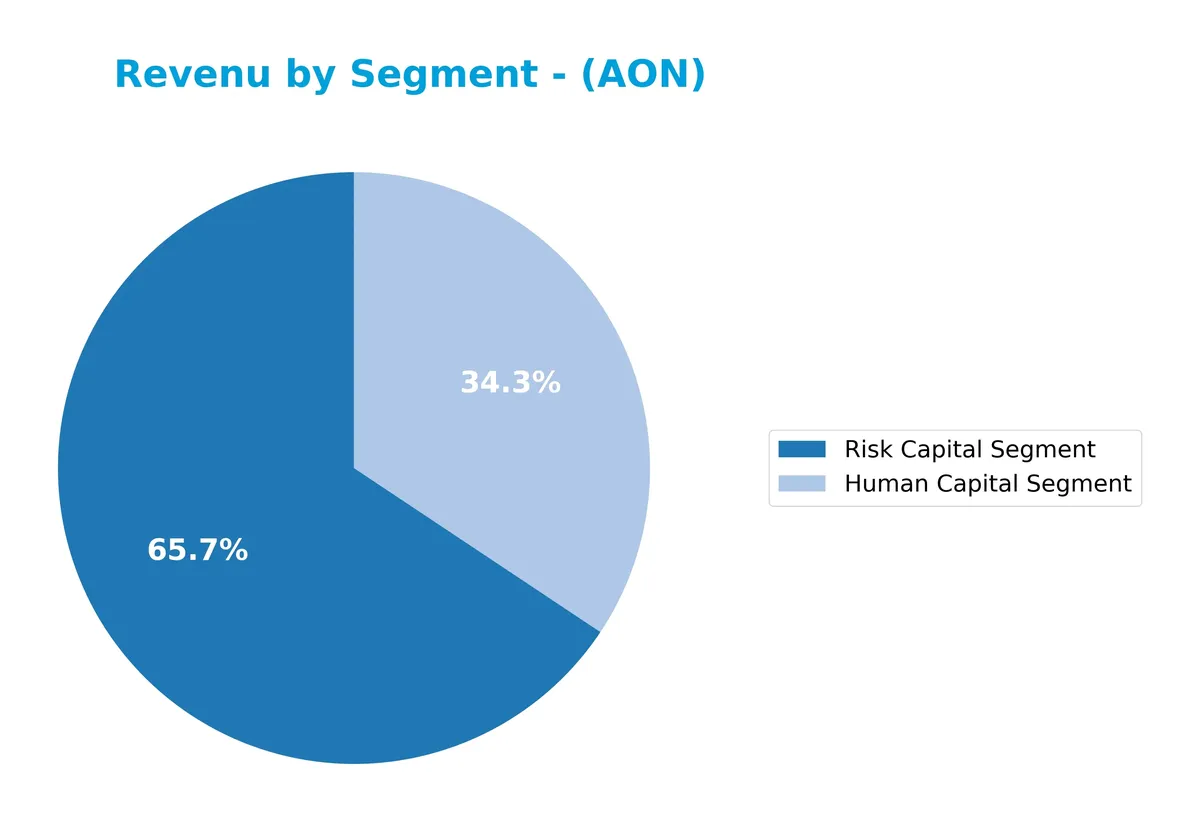
In 2025, Aon’s revenue centers on two key segments: Risk Capital at $11.3B and Human Capital at $5.9B. The Risk Capital segment leads, showing steady growth from $10.5B in 2024, underscoring its strategic importance. Human Capital also accelerates, rising from $5.2B, signaling expanding demand. This concentration suggests Aon is increasingly reliant on these core segments, reflecting a focused portfolio with potential concentration risk if market dynamics shift.
Key Products & Brands
The table below outlines Aon plc’s primary products and brands with concise descriptions:
| Product | Description |
|---|---|
| Human Capital Segment | Solutions focused on employee benefits, health brokerage, and workforce advisory services. |
| Risk Capital Segment | Includes commercial risk solutions, global risk consulting, and captives management. |
| Commercial Risk Solutions | Retail brokerage services for commercial insurance and risk management. |
| Health | Health benefits brokerage and health care exchange services. |
| Reinsurance | Treaty and facultative reinsurance services alongside insurance-linked securities. |
| Wealth Solutions | Retirement program consulting, actuarial, and investment advisory for defined benefit plans. |
| Data Solutions | Analytics and data services supporting insurance and risk management decision-making. |
| P&C Advisory | Property & casualty insurance advisory and brokerage services. |
| Retirement | Strategic design and consulting on retirement programs and investment management. |
| Consulting | Broad consulting services including risk management, restructuring, and M&A advisory. |
| CoverWallet | Digital platform providing small business insurance solutions. |
| Affinity | Specialized insurance and brokerage services targeting affinity groups. |
| Aon Inpoint | Data-driven analytics and consulting solutions for risk and insurance optimization. |
| ReView | Technology platform for reinsurance and risk management analytics. |
Aon’s portfolio spans comprehensive risk, health, and wealth management solutions. Their brands and segments integrate consulting, brokerage, and technological platforms to serve diverse client needs globally.
Main Competitors
The sector includes 6 competitors, with the table listing the top 6 leaders by market capitalization:
| Competitor | Market Cap. |
|---|---|
| Marsh & McLennan Companies, Inc. | 89.8B |
| Aon plc | 74.4B |
| Arthur J. Gallagher & Co. | 65.7B |
| Willis Towers Watson Public Limited Company | 32.3B |
| Brown & Brown, Inc. | 26.5B |
| Erie Indemnity Company | 12.8B |
Aon plc ranks 2nd among its 6 competitors. It holds 77% of the market cap of the leader, Marsh & McLennan. Aon is positioned above both the average market cap of the top 10 peers (50.3B) and the sector median (49.0B). The company maintains a healthy 29.8% market cap gap to its closest competitor above.
Comparisons with competitors
Check out how we compare the company to its competitors:
Does Aon have a competitive advantage?
Aon exhibits a sustainable competitive advantage, supported by a ROIC exceeding WACC by 5.4%, and a strong upward trend in ROIC of over 22% from 2021 to 2025. This indicates efficient capital allocation and consistent value creation, outperforming typical financial services benchmarks.
Looking ahead, Aon’s broad geographic reach across the U.S., EMEA, and Asia Pacific, combined with its expanding commercial risk and health solutions, positions it to capitalize on growing global demand. Continued innovation in captive management and strategic advisory services could further strengthen its market presence.
SWOT Analysis
This analysis highlights Aon plc’s key internal and external factors shaping its strategic position.
Strengths
- strong global presence
- high ROE at 39.5%
- favorable net margin at 21.5%
Weaknesses
- high debt-to-equity ratio at 1.77
- elevated price-to-book ratio at 8.12
- Altman Z-Score in distress zone at 1.76
Opportunities
- expanding health and cyber risk solutions
- growth in emerging markets like Asia Pacific
- increasing demand for retirement advisory
Threats
- intense competition in insurance brokering
- regulatory changes globally
- economic downturn impacting client budgets
Aon’s robust profitability and global footprint create a solid foundation. However, its leverage and valuation metrics warrant caution. Capturing growth in emerging markets and health solutions can drive future gains, but rising competition and financial risks require vigilant management.
Stock Price Action Analysis
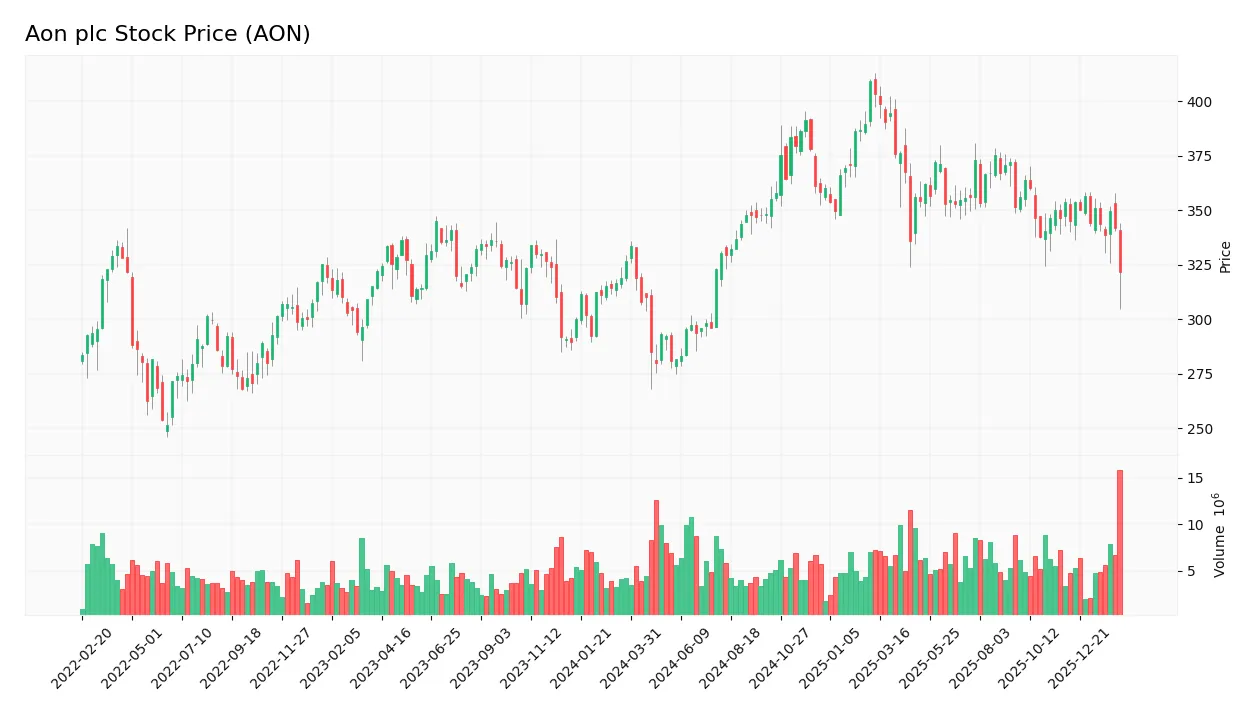
The following weekly chart illustrates Aon plc’s stock price movement over the last 100 weeks, capturing key highs and lows:
Trend Analysis
Over the past 12 months, Aon’s stock price declined by 1.56%, indicating a neutral trend as the change lies between -2% and +2%. The trend shows deceleration, with notable volatility reflected in a 29.44 standard deviation. The highest price reached 409.12, and the lowest touched 279.97.
Volume Analysis
In the last three months, trading volume increased but shifted to seller dominance, with buyers representing only 33.47%. This suggests weakening buyer conviction and growing selling pressure, indicating cautious or bearish investor sentiment amid higher market participation.
Target Prices
Analysts present a confident target consensus for Aon plc, reflecting solid growth expectations.
| Target Low | Target High | Consensus |
|---|---|---|
| 381 | 443 | 404.8 |
The target price range from 381 to 443 shows broad optimism, with a consensus near 405 signaling strong confidence in Aon’s future performance.

Don’t Let Luck Decide Your Entry Point
Optimize your entry points with our advanced ProRealTime indicators. You’ll get efficient buy signals with precise price targets for maximum performance. Start outperforming now!
Analyst & Consumer Opinions
This section examines Aon plc’s analyst ratings alongside consumer feedback to provide a balanced perspective.
Stock Grades
Here is the latest summary of analyst grades for Aon plc from reputable financial institutions:
| Grading Company | Action | New Grade | Date |
|---|---|---|---|
| Citigroup | Maintain | Buy | 2026-02-03 |
| Cantor Fitzgerald | Maintain | Overweight | 2026-02-02 |
| Wells Fargo | Maintain | Overweight | 2026-02-02 |
| Cantor Fitzgerald | Maintain | Overweight | 2026-01-14 |
| Wells Fargo | Maintain | Overweight | 2026-01-13 |
| Barclays | Maintain | Equal Weight | 2026-01-08 |
| JP Morgan | Maintain | Overweight | 2026-01-07 |
| Keefe, Bruyette & Woods | Maintain | Outperform | 2026-01-06 |
| Barclays | Downgrade | Equal Weight | 2025-11-20 |
| UBS | Maintain | Neutral | 2025-11-10 |
Most recent actions show steady confidence, with a predominance of “Overweight” and “Buy” grades. Barclays’ downgrade to “Equal Weight” in late 2025 stands out, but overall sentiment remains cautiously positive.
Consumer Opinions
Consumer sentiment around Aon plc reflects a mix of respect for its expertise and concerns over service consistency.
| Positive Reviews | Negative Reviews |
|---|---|
| “Aon delivers expert risk management solutions tailored to complex needs.” | “Customer service response times can be slow during peak periods.” |
| “The company’s technology platform enhances our insurance purchasing experience.” | “Pricing feels high compared to some competitors in the market.” |
| “Aon’s consulting teams provide insightful, actionable advice that drives results.” | “Some clients report occasional miscommunication on policy details.” |
Overall, customers praise Aon’s deep expertise and innovative tools. However, service speed and pricing are common pain points, signaling areas for operational improvement.
Risk Analysis
Below is a summary of key risks facing Aon plc, categorized by likelihood and potential impact:
| Category | Description | Probability | Impact |
|---|---|---|---|
| Financial Distress | Altman Z-Score at 1.76 signals moderate bankruptcy risk | Medium | High |
| Leverage | High debt-to-equity of 1.77 increases financial vulnerability | High | Medium |
| Valuation | Overvaluation indicated by P/B of 8.12 and P/E of 20.54 | Medium | Medium |
| Liquidity | Current ratio at 1.11 suggests tight short-term liquidity | Medium | Low |
| Market Volatility | Beta of 0.81 reduces sensitivity but limits upside in rallies | Low | Low |
The most concerning risk is financial distress, as Aon’s Altman Z-Score places it in the distress zone despite a strong Piotroski score. Elevated leverage amplifies this risk amid market uncertainties. Valuation multiples raise caution but are less critical than solvency risks.
Should You Buy Aon plc?
Aon plc appears to be a company with robust profitability and a very favorable durable moat, supported by growing ROIC and value creation. Despite a challenging leverage profile and Altman Z-score in the distress zone, its overall rating suggests a cautiously optimistic investment profile.
Strength & Efficiency Pillars
Aon plc demonstrates robust operational efficiency with a net margin of 21.51% and a return on equity of 39.51%. Its return on invested capital (ROIC) stands at 12.16%, significantly above its weighted average cost of capital (WACC) of 6.75%, confirming that the company is a clear value creator. This advantage is supported by a favorable interest coverage ratio of 5.38 and a very strong Piotroski score of 8, underscoring solid profitability and financial strength despite broader challenges.
Weaknesses and Drawbacks
Aon is currently in the distress zone with an Altman Z-Score of 1.76, signaling elevated bankruptcy risk that overshadows operational strengths. The company’s valuation metrics raise concerns: a high price-to-book ratio of 8.12 and a moderately high debt-to-equity ratio of 1.77 highlight leverage and premium pricing risks. Furthermore, recent market activity is seller-dominant with buyer dominance at just 33.47%, indicating short-term pressure and potential liquidity constraints.
Our Final Verdict about Aon plc
Despite Aon’s operational profitability and value creation, its distressed Altman Z-Score of 1.76 makes the investment profile highly speculative. The solvency risk dominates and suggests caution. This risk overshadows favorable margins and strong financial scores, making Aon too risky for conservative capital in the current environment.
Disclaimer: This content is for informational purposes only and does not constitute financial, investment, or other professional advice. Investing in financial markets involves a significant risk of loss, and past performance is not indicative of future results.
Additional Resources
- Aon Appoints Joe Peiser as CEO of Risk Capital – PR Newswire (Feb 12, 2026)
- Aon Appoints Joe Peiser As CEO Of Risk Capital – Pulse 2.0 (Feb 17, 2026)
- Fund Update: 243,700 AON PLC (AON) shares added to COMGEST GLOBAL INVESTORS S.A.S. portfolio – Quiver Quantitative (Feb 12, 2026)
- Joe Peiser Named CEO of Risk Capital at Aon – Risk & Insurance (Feb 13, 2026)
- Caprock Group LLC Purchases New Shares in Aon plc $AON – MarketBeat (Feb 14, 2026)
For more information about Aon plc, please visit the official website: aon.com