Home > Analyses > Technology > Amphenol Corporation
Amphenol Corporation powers connectivity in critical industries worldwide, embedding its advanced connectors and sensors into everyday technology. Its leadership in harsh environment solutions, communications, and interconnect systems drives innovation across automotive, aerospace, and data infrastructure markets. Known for quality and engineering excellence, Amphenol shapes how devices communicate and perform under pressure. As market dynamics shift, I ask: does Amphenol’s strong foundation still justify its premium valuation and growth prospects in 2026?
Table of contents
Business Model & Company Overview
Amphenol Corporation, founded in 1932 and headquartered in Wallingford, Connecticut, stands as a leading provider in the hardware, equipment, and parts sector. It integrates a broad range of electrical, electronic, and fiber optic connectors into a cohesive ecosystem that serves diverse end-markets such as automotive, aerospace, and telecommunications. Its three core segments—Harsh Environment Solutions, Communications Solutions, and Interconnect and Sensor Systems—form a robust platform driving innovation and reliability worldwide.
The company’s revenue engine balances hardware sales with value-added products, including cable assemblies and sensor-based systems. Amphenol’s strategic footprint spans the Americas, Europe, and Asia, supporting global original equipment manufacturers and service providers. This global reach, combined with a diversified product portfolio, creates a formidable economic moat, positioning Amphenol as a pivotal force shaping the future of interconnect technologies.
Financial Performance & Fundamental Metrics
I analyze Amphenol Corporation’s income statement, key financial ratios, and dividend payout policy to assess its profitability, efficiency, and shareholder returns.
Income Statement
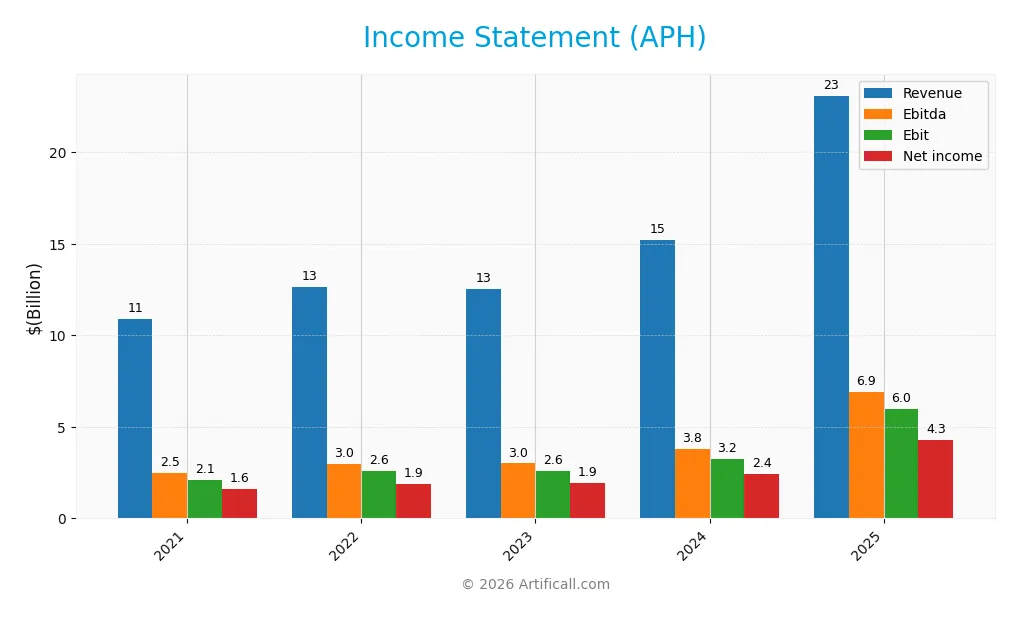
The table below summarizes Amphenol Corporation’s key income statement metrics over the last five fiscal years.
| 2021 | 2022 | 2023 | 2024 | 2025 | |
|---|---|---|---|---|---|
| Revenue | 10.9B | 12.6B | 12.6B | 15.2B | 23.1B |
| Cost of Revenue | 7.5B | 8.6B | 8.5B | 10.1B | 14.6B |
| Operating Expenses | 1.2B | 1.4B | 1.5B | 1.9B | 2.5B |
| Gross Profit | 3.4B | 4.0B | 4.1B | 5.1B | 8.5B |
| EBITDA | 2.5B | 3.0B | 3.0B | 3.8B | 6.9B |
| EBIT | 2.1B | 2.6B | 2.6B | 3.2B | 6.0B |
| Interest Expense | 116M | 128M | 140M | 217M | 368M |
| Net Income | 1.6B | 1.9B | 1.9B | 2.4B | 4.3B |
| EPS | 1.33 | 1.60 | 1.62 | 2.01 | 3.51 |
| Filing Date | 2022-02-09 | 2023-02-08 | 2024-02-07 | 2025-02-07 | 2026-02-11 |
Income Statement Evolution
Amphenol’s revenue more than doubled from 10.9B in 2021 to 23.1B in 2025, reflecting strong growth momentum. Net income surged 168% over the period, driven by expanding margins. Gross margin improved to 36.9%, while EBIT margin reached 25.8%, signaling operational efficiency gains alongside robust top-line expansion.
Is the Income Statement Favorable?
In 2025, Amphenol delivered a net margin of 18.5%, supported by controlled interest expenses at 1.6% of revenue. EBIT rose 85% year-over-year, outpacing revenue growth, and EPS jumped 74%, underscoring strong capital allocation. All key profitability and growth metrics rate favorable, reflecting solid fundamentals and operational discipline.
Financial Ratios
The following table presents key financial ratios for Amphenol Corporation (APH) over the last five fiscal years, illustrating profitability, valuation, liquidity, leverage, and operational efficiency:
| Ratios | 2021 | 2022 | 2023 | 2024 | 2025 |
|---|---|---|---|---|---|
| Net Margin | 15% | 15% | 15% | 16% | 18% |
| ROE | 25% | 27% | 23% | 25% | 32% |
| ROIC | 14% | 16% | 15% | 15% | 15% |
| P/E | 33 | 24 | 31 | 34 | 39 |
| P/B | 8.3 | 6.5 | 7.1 | 8.5 | 12.3 |
| Current Ratio | 2.4 | 2.4 | 2.2 | 2.4 | 3.0 |
| Quick Ratio | 1.7 | 1.6 | 1.5 | 1.7 | 2.5 |
| D/E | 0.80 | 0.69 | 0.56 | 0.74 | 1.16 |
| Debt-to-Assets | 34% | 32% | 28% | 34% | 43% |
| Interest Coverage | 19 | 20 | 19 | 15 | 16 |
| Asset Turnover | 0.74 | 0.82 | 0.76 | 0.71 | 0.64 |
| Fixed Asset Turnover | 7.7 | 8.5 | 7.8 | 7.3 | 10.0 |
| Dividend Yield | 0.7% | 1.1% | 0.8% | 0.7% | 0.5% |
Evolution of Financial Ratios
Return on Equity (ROE) improved steadily from 25.24% in 2021 to 31.84% in 2025, indicating stronger profitability. The Current Ratio increased from 2.43 to 2.98, reflecting better liquidity. Debt-to-Equity Ratio rose notably from 0.80 to 1.16, signaling higher leverage. Profit margins expanded consistently, with net margin reaching 18.49% in 2025.
Are the Financial Ratios Fovorable?
In 2025, profitability ratios such as ROE (31.84%) and net margin (18.49%) are favorable, showing efficient capital use. Liquidity ratios remain strong, with a Current Ratio near 3. Leverage is less favorable, given the elevated Debt-to-Equity at 1.16. Valuation metrics like P/E (38.55) and P/B (12.27) are unfavorable, suggesting premium pricing. Overall, ratios are slightly favorable with balanced strengths and risks.
Shareholder Return Policy
Amphenol Corporation maintains a moderate dividend payout ratio near 19%, with dividend per share growing steadily to $0.66 in 2025. The annual dividend yield remains below 0.5%, supported by disciplined share buybacks and free cash flow coverage above 80%, indicating prudent capital allocation.
This consistent distribution approach balances shareholder returns and reinvestment, aligning with sustainable long-term value creation. The payout ratio and cash flow coverage suggest manageable risk, avoiding excessive repurchases or unsustainable dividends amid market fluctuations.
Score analysis
The following radar chart presents a comprehensive view of the company’s key financial scores and valuation metrics:
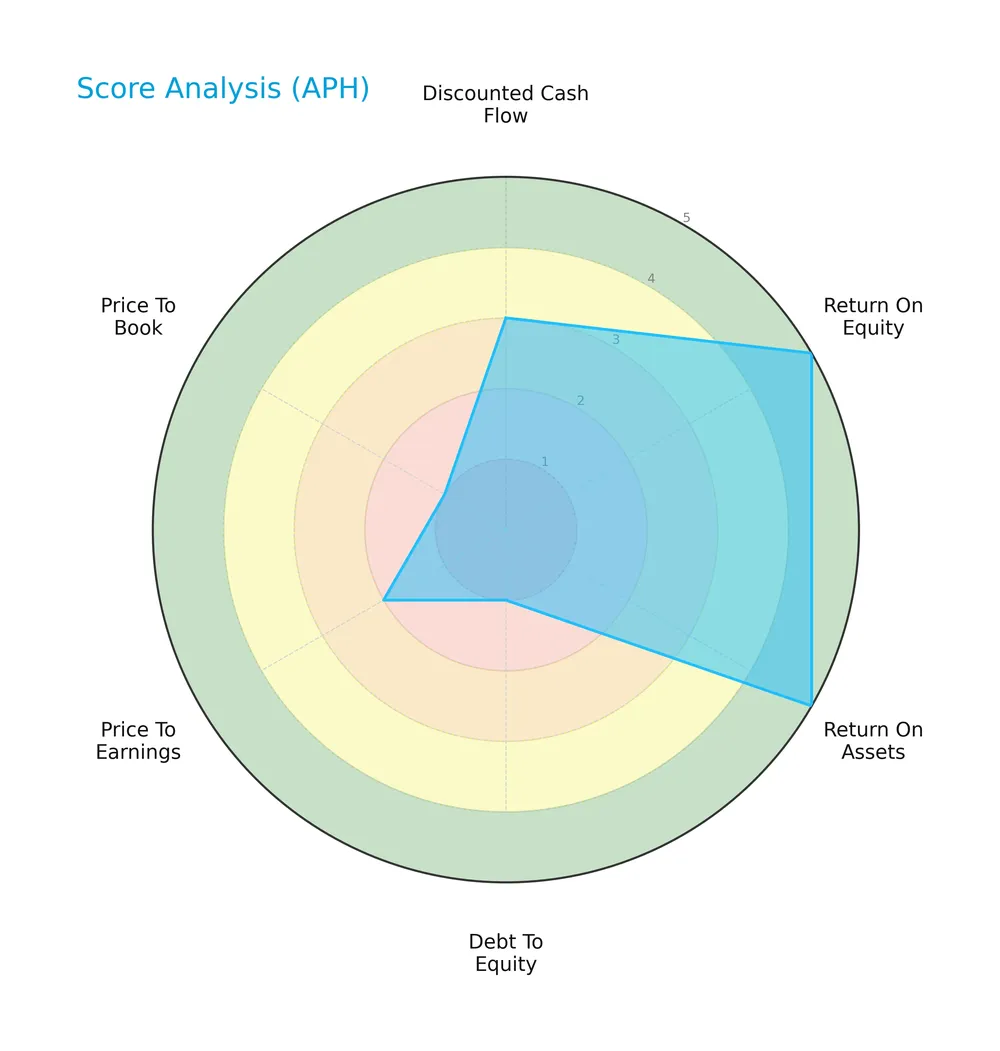
Amphenol Corporation scores very favorably on return on equity (5) and return on assets (5), indicating strong profitability. However, debt to equity (1), price to earnings (2), and price to book (1) scores signal significant weaknesses in leverage and valuation metrics. The discounted cash flow score stands at a moderate 3.
Analysis of the company’s bankruptcy risk
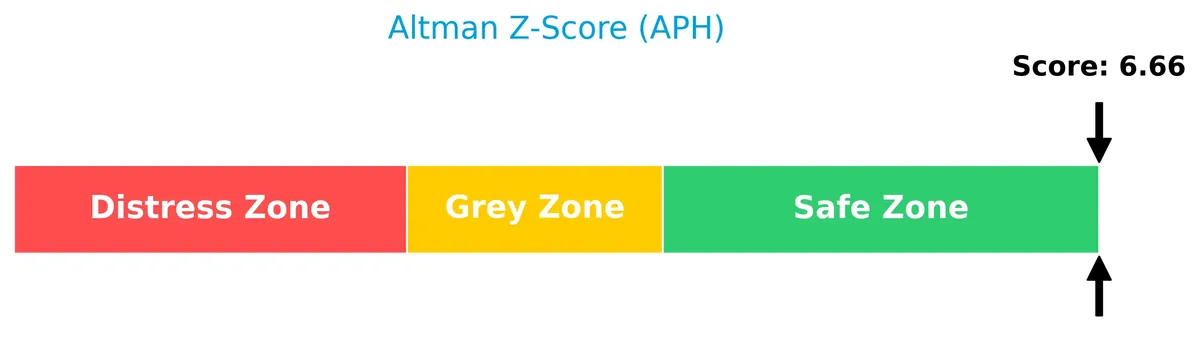
The Altman Z-Score places Amphenol firmly in the safe zone, indicating a very low risk of bankruptcy:
Is the company in good financial health?
The Piotroski Score diagram illustrates Amphenol’s financial strength clearly:
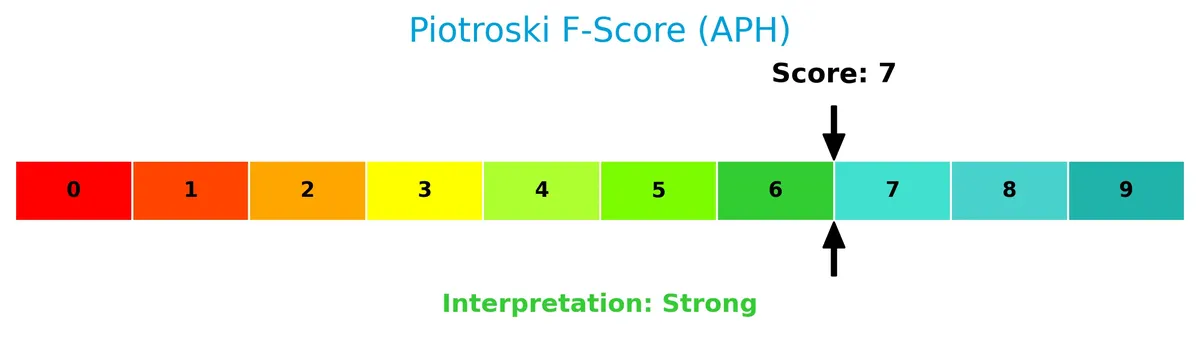
With a score of 7 categorized as strong, Amphenol shows robust financial health. This reflects solid profitability, efficient asset management, and prudent leverage, supporting its investment appeal.
Competitive Landscape & Sector Positioning
This section examines Amphenol Corporation’s strategic positioning within the technology sector, focusing on its diverse product segments and market reach. I will analyze whether Amphenol holds a competitive advantage over its main rivals based on its segment revenue, key products, and overall market dynamics.
Strategic Positioning
Amphenol Corporation maintains a diversified product portfolio across three segments: Communications Solutions, Harsh Environment Solutions, and Interconnect and Sensor Systems. Its geographic exposure spans the U.S., China, and other foreign locations, reflecting a broad international footprint.
Revenue by Segment
This pie chart illustrates Amphenol Corporation’s revenue distribution by segment for the fiscal year 2025, highlighting key business drivers across its product lines.
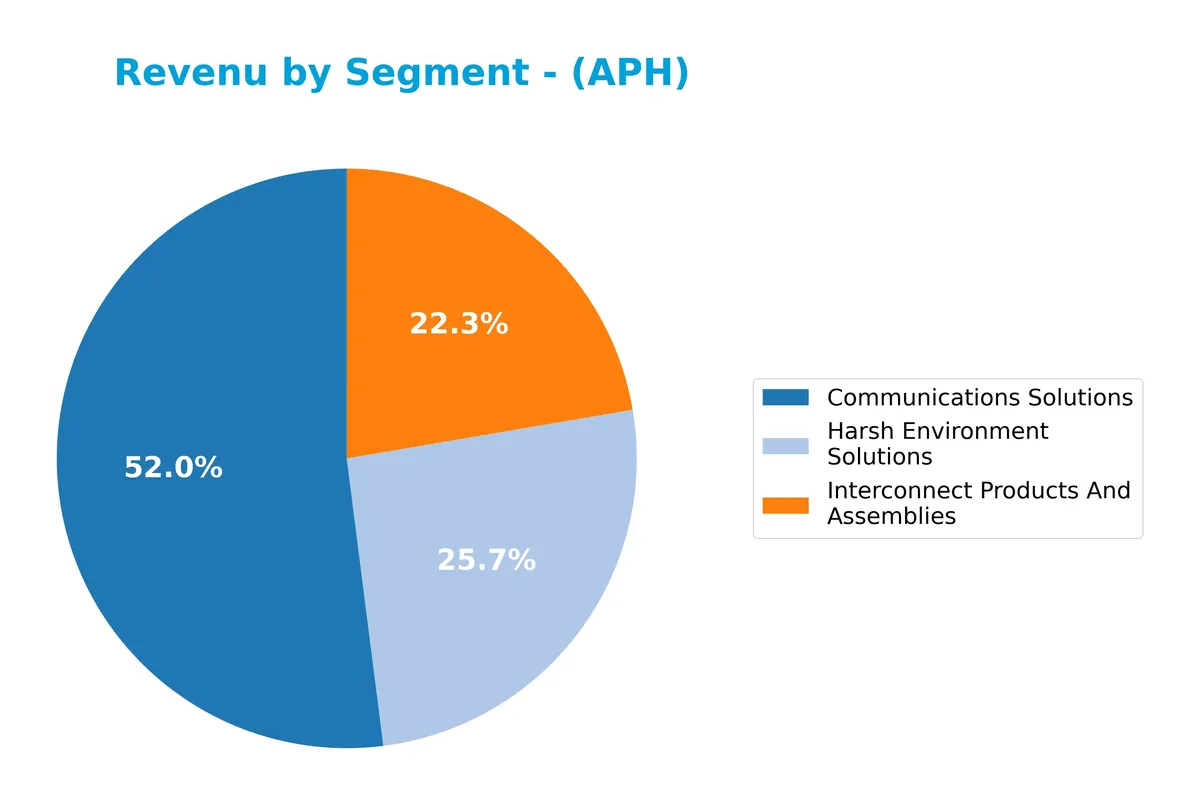
In 2025, Communications Solutions leads with $12.2B, marking strong growth from $6.4B in 2024. Harsh Environment Solutions and Interconnect Products contribute $6B and $5.2B respectively. Communications Solutions accelerated sharply, doubling in one year, signaling a strategic pivot and concentration risk. The other segments show steady increases but lag behind the dominant communications focus. This shift warrants attention for portfolio risk due to segment concentration.
Key Products & Brands
Amphenol’s portfolio focuses on three main segments generating significant revenue:
| Product | Description |
|---|---|
| Communications Solutions | Connectors and systems for consumer devices, network infrastructure, antennas, and specialty cables. |
| Harsh Environment Solutions | Data, power, fiber optic, and radio frequency connectors designed for extreme conditions. |
| Interconnect and Sensor Systems | Connectors, cable assemblies, harnesses, sensors, and sensor-based products for diverse industries. |
Amphenol’s product range spans harsh environment connectors, communications infrastructure, and sophisticated interconnect and sensor systems. These offerings serve automotive, aerospace, IT, military, and mobile network markets globally.
Main Competitors
Amphenol Corporation operates among 20 competitors, with the table below listing the top 10 leaders by market capitalization:
| Competitor | Market Cap. |
|---|---|
| Amphenol Corporation | 171B |
| Corning Incorporated | 78B |
| TE Connectivity Ltd. | 69B |
| Sandisk Corporation | 40B |
| Garmin Ltd. | 39B |
| Keysight Technologies, Inc. | 35B |
| Celestica Inc. | 34B |
| Coherent, Inc. | 29B |
| Jabil Inc. | 26B |
| Teledyne Technologies Inc. | 24B |
Amphenol Corporation ranks first among 20 competitors, with a market cap 2.9% above the nearest rival, Corning Incorporated. It stands well above the average market cap of the top 10 (54B) and the sector median (22B). The company holds a commanding lead with a significant gap to its closest competitor below.
Comparisons with competitors
Check out how we compare the company to its competitors:
Does Amphenol Corporation have a competitive advantage?
Amphenol Corporation demonstrates a sustainable competitive advantage, consistently creating value with a ROIC exceeding its WACC by over 6%, supported by a growing ROIC trend. This reflects efficient capital use, strong profitability, and effective management over the 2021-2025 period.
Looking ahead, Amphenol’s diverse product portfolio in harsh environment solutions, communications, and sensor systems positions it well to capture growth in automotive, aerospace, and broadband markets. Expansion in international locations and innovation in connector technologies offer promising opportunities for future revenue and margin expansion.
SWOT Analysis
This SWOT analysis identifies Amphenol Corporation’s key internal and external factors affecting its strategic positioning.
Strengths
- strong revenue growth of 112% over five years
- favorable margins with 18.5% net margin
- very favorable moat with ROIC exceeding WACC
Weaknesses
- high price-to-book ratio at 12.27 signals overvaluation
- elevated debt-to-equity ratio of 1.16 increases financial risk
- low dividend yield at 0.49% may deter income investors
Opportunities
- expanding global footprint, especially in Other Foreign Locations
- growing demand for harsh environment connectors
- innovation in fiber optic and sensor technologies
Threats
- intense competition in hardware and connectors sector
- potential supply chain disruptions
- sensitivity to global economic cycles impacting industrial customers
Amphenol’s strengths in profitability and growth position it well for sustained value creation. However, elevated leverage and valuation caution require prudent risk management. The company should leverage its innovation and global reach while navigating competitive and macroeconomic headwinds.
Stock Price Action Analysis
The weekly stock chart for Amphenol Corporation (APH) reveals significant price appreciation and recent trend nuances over the past 12 months:
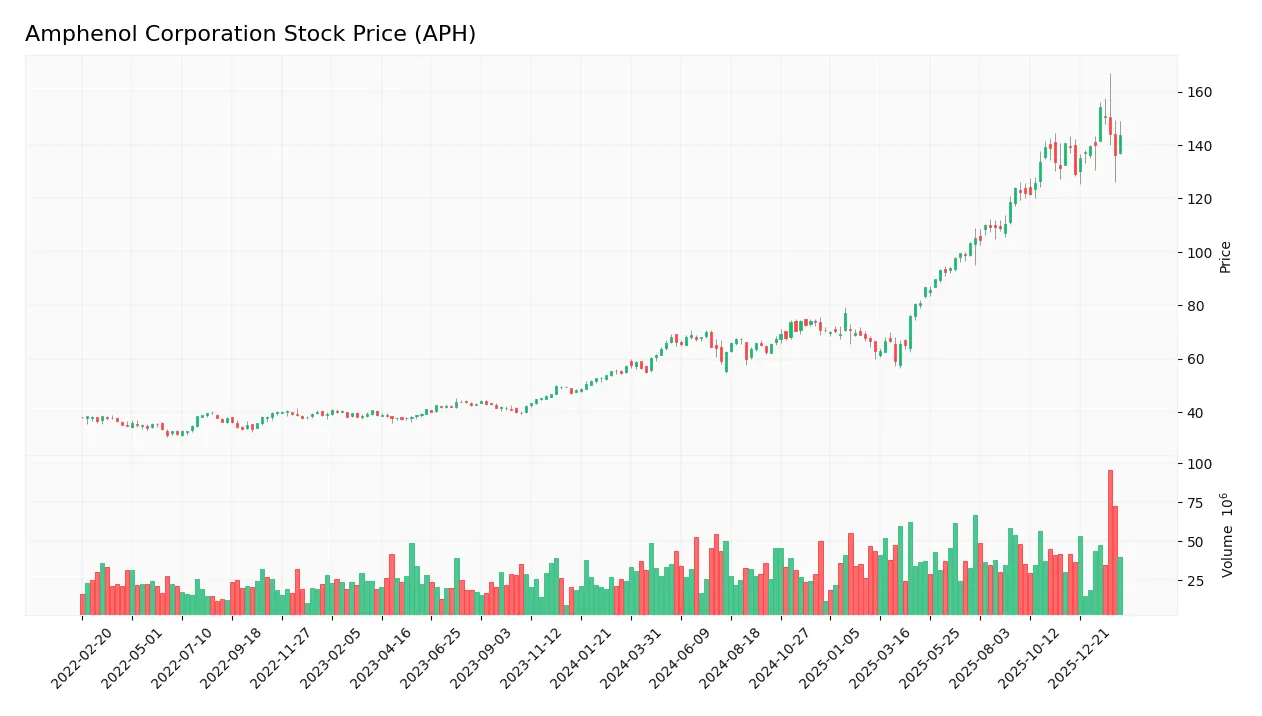
Trend Analysis
Over the past year, the stock price rose 151.23%, indicating a clear bullish trend. The highest price reached 154.39 and the lowest was 55.09. Despite strong gains, the trend shows deceleration, supported by a 29.11 standard deviation, signaling volatility but slowing momentum.
Volume Analysis
Over the last three months, volume increased overall but shifted to slightly seller-dominant activity, with buyers accounting for 46.84%. This suggests cautious investor sentiment and moderate market participation amid recent price consolidation.
Target Prices
Analysts present a confident target consensus for Amphenol Corporation.
| Target Low | Target High | Consensus |
|---|---|---|
| 139 | 210 | 174.13 |
The target range suggests moderate upside potential, with consensus indicating a solid valuation near 174. This aligns with sector growth trends and Amphenol’s robust market position.

Don’t Let Luck Decide Your Entry Point
Optimize your entry points with our advanced ProRealTime indicators. You’ll get efficient buy signals with precise price targets for maximum performance. Start outperforming now!
Analyst & Consumer Opinions
This section examines the latest analyst ratings and consumer feedback for Amphenol Corporation (APH).
Stock Grades
Here are the latest verified stock grades from leading financial institutions for Amphenol Corporation:
| Grading Company | Action | New Grade | Date |
|---|---|---|---|
| Citigroup | Maintain | Buy | 2026-01-29 |
| Barclays | Maintain | Overweight | 2026-01-29 |
| JP Morgan | Maintain | Overweight | 2026-01-27 |
| UBS | Maintain | Buy | 2026-01-14 |
| Citigroup | Maintain | Buy | 2026-01-12 |
| Barclays | Upgrade | Overweight | 2026-01-12 |
| Truist Securities | Maintain | Buy | 2025-12-19 |
| Barclays | Maintain | Equal Weight | 2025-11-13 |
| Truist Securities | Maintain | Buy | 2025-10-23 |
| Citigroup | Maintain | Buy | 2025-10-23 |
The ratings consistently favor a positive outlook, with multiple buy and overweight designations and a recent upgrade by Barclays. The consensus remains bullish despite some hold ratings, reflecting measured confidence among analysts.
Consumer Opinions
Amphenol Corporation (APH) draws mixed but insightful consumer sentiment, reflecting its market position and operational focus.
| Positive Reviews | Negative Reviews |
|---|---|
| Durable and reliable connectors | Customer support response times vary |
| Wide product range meets diverse needs | Pricing considered higher than competitors |
| Strong innovation in product design | Some delays reported in order fulfillment |
Consumers consistently praise Amphenol’s product quality and innovation. However, concerns around pricing and customer service responsiveness suggest areas for improvement.
Risk Analysis
Below is a summary table of key risks facing Amphenol Corporation, highlighting their likelihood and potential impact:
| Category | Description | Probability | Impact |
|---|---|---|---|
| Valuation Risk | Elevated P/E (38.55) and P/B (12.27) ratios suggest overvaluation | High | High |
| Leverage Risk | Debt-to-equity ratio of 1.16 indicates elevated financial leverage | Medium | Medium |
| Market Volatility | Beta of 1.21 signals higher sensitivity to market swings | Medium | Medium |
| Dividend Yield | Low yield (0.49%) may reduce appeal to income-focused investors | Low | Low |
| Operational Risk | Exposure to global supply chain disruptions in hardware sector | Medium | High |
The most pressing risks are valuation and operational uncertainties. The stock trades well above sector averages in price multiples, increasing correction risk. Additionally, global supply chain challenges in technology hardware remain volatile, potentially impacting margins despite strong ROIC of 15.12%. Investors should monitor leverage carefully given the debt load relative to equity.
Should You Buy Amphenol Corporation?
Amphenol appears to be in a very favorable position with strong value creation and a durable competitive moat reflected by growing ROIC above WACC. While its leverage profile raises caution, overall financial health suggests a solid B rating, indicating moderate risk but robust operational efficiency.
Strength & Efficiency Pillars
Amphenol Corporation demonstrates operational strength with a robust net margin of 18.49% and a return on equity (ROE) of 31.84%. Its return on invested capital (ROIC) stands at 15.12%, comfortably exceeding the weighted average cost of capital (WACC) at 8.88%, confirming the company as a clear value creator. The firm’s growing ROIC trend and very favorable moat suggest a sustainable competitive advantage. High gross margin (36.88%) and EBIT margin (25.84%) reinforce its efficient cost management and profitability.
Weaknesses and Drawbacks
Valuation metrics present significant concerns. Amphenol’s price-to-earnings ratio (PE) is elevated at 38.55, indicating a premium valuation that may pressure returns. The price-to-book ratio (PB) of 12.27 further signals overvaluation relative to book value. Leverage is a notable risk with a debt-to-equity ratio of 1.16, flagged as unfavorable. Despite a strong current ratio of 2.98, the high leverage could limit financial flexibility amid market volatility. Recent trading shows slight seller dominance (46.84% buyers), suggesting cautious sentiment in the near term.
Our Final Verdict about Amphenol Corporation
Amphenol’s long-term fundamentals appear solid, supported by strong profitability and a durable moat. However, the company’s premium valuation combined with recent seller dominance suggests that investors might consider a wait-and-see approach for a more attractive entry point. While the profile could appeal for long-term exposure, valuation risks and market pressure warrant prudence. Overall, Amphenol may appear promising but requires careful timing and risk management.
Disclaimer: This content is for informational purposes only and does not constitute financial, investment, or other professional advice. Investing in financial markets involves a significant risk of loss, and past performance is not indicative of future results.
Additional Resources
- ING Groep NV Sells 189,124 Shares of Amphenol Corporation $APH – MarketBeat (Feb 12, 2026)
- Decoding Amphenol Corp (APH): A Strategic SWOT Insight – GuruFocus (Feb 12, 2026)
- IT Datacom Segment Supported Amphenol Corporation’s (APH) Better-Than-Expected Earnings – Insider Monkey (Feb 10, 2026)
- Amphenol Corp. (NYSE:APH) Passes Key Growth Screen from “The Little Book That Makes You Rich” – ChartMill (Feb 12, 2026)
- AMPHENOL CORP /DE/ SEC 10-K Report – TradingView (Feb 11, 2026)
For more information about Amphenol Corporation, please visit the official website: amphenol.com