Home > Analyses > Healthcare > Amgen Inc.
Amgen transforms lives by pioneering therapies that tackle complex diseases like cancer, cardiovascular ailments, and autoimmune disorders. As a titan in biopharmaceuticals, it commands a portfolio of breakthrough products including Enbrel, Neulasta, and Repatha, renowned for innovation and clinical impact. With decades of industry leadership and strategic collaborations fueling its R&D engine, Amgen sets the pace in healthcare. Yet, I ask: do its current fundamentals still warrant its premium valuation and growth expectations?

Table of contents
Business Model & Company Overview
Amgen Inc., founded in 1980 and headquartered in Thousand Oaks, California, stands as a leader in the drug manufacturing sector. It develops and delivers a broad portfolio of human therapeutics targeting inflammation, oncology, bone health, cardiovascular, and neuroscience. Its integrated ecosystem spans from discovery to delivery, serving healthcare providers globally with innovative biologics and specialty medicines.
The company’s revenue engine blends patented biologics with recurring sales in inflammation and oncology, supported by strong distribution through wholesalers and direct channels. Amgen’s strategic presence spans the Americas, Europe, and Asia, leveraging collaborations with global pharma giants. Its deep R&D pipeline and robust partnerships create a formidable economic moat, securing its role in shaping biopharma’s future.
Financial Performance & Fundamental Metrics
I analyze Amgen Inc.’s income statement, key financial ratios, and dividend payout policy to assess its core financial health and shareholder value.
Income Statement
The table below summarizes Amgen Inc.’s key income statement figures over the past five fiscal years, highlighting trends in revenue, expenses, and profitability metrics.

| 2021 | 2022 | 2023 | 2024 | 2025 | |
|---|---|---|---|---|---|
| Revenue | 25.98B | 26.32B | 28.19B | 33.42B | 36.75B |
| Cost of Revenue | 6.45B | 6.41B | 8.42B | 12.86B | 6.42B |
| Operating Expenses | 11.89B | 10.35B | 11.84B | 13.31B | 15.44B |
| Gross Profit | 19.53B | 19.92B | 19.78B | 20.57B | 30.33B |
| EBITDA | 11.30B | 12.17B | 14.80B | 13.36B | 17.13B |
| EBIT | 7.90B | 8.75B | 10.73B | 7.76B | 11.75B |
| Interest Expense | 1.20B | 1.41B | 2.88B | 3.16B | 2.76B |
| Net Income | 5.89B | 6.55B | 6.72B | 4.09B | 7.71B |
| EPS | 10.34 | 12.18 | 12.56 | 7.62 | 14.33 |
| Filing Date | 2022-02-16 | 2023-02-09 | 2024-02-14 | 2025-02-14 | 2026-02-13 |
Income Statement Evolution
Amgen’s revenue grew 41.5% from 2021 to 2025, with a 9.95% increase in the last year. Net income rose 30.9% over five years and jumped 71.5% in 2025. Gross margin remained strong at 82.5%, while EBIT margin stood at 32.0%. Net margin slightly declined over the period but improved sharply in 2025.
Is the Income Statement Favorable?
The 2025 income statement shows favorable fundamentals. Revenue growth and net income gains outpaced operating expenses, despite a slight unfavorable trend in OPEX relative to revenue. Interest expense remains neutral at 7.5% of revenue. Overall, margins and earnings per share growth indicate solid operational efficiency and profitability.
Financial Ratios
The table below summarizes key financial ratios for Amgen Inc. over the last five fiscal years, offering a clear view of the company’s performance and financial health:
| Ratios | 2021 | 2022 | 2023 | 2024 | 2025 |
|---|---|---|---|---|---|
| Net Margin | 23% | 25% | 24% | 12% | 21% |
| ROE | 88% | 179% | 108% | 70% | 89% |
| ROIC | 14% | 17% | 8% | 9% | 18% |
| P/E | 22 | 22 | 23 | 34 | 23 |
| P/B | 19 | 39 | 25 | 24 | 20 |
| Current Ratio | 1.59 | 1.41 | 1.65 | 1.26 | 1.14 |
| Quick Ratio | 1.26 | 1.10 | 1.13 | 0.95 | 0.90 |
| D/E | 5.0 | 10.6 | 10.4 | 10.2 | 6.3 |
| Debt-to-Assets | 54% | 60% | 67% | 65% | 60% |
| Interest Coverage | 6.4 | 6.8 | 2.7 | 2.3 | 5.4 |
| Asset Turnover | 0.42 | 0.40 | 0.29 | 0.36 | 0.41 |
| Fixed Asset Turnover | 5.0 | 4.9 | 4.7 | 5.1 | 4.6 |
| Dividend Yield | 3.1% | 3.0% | 3.0% | 3.4% | 2.9% |
Evolution of Financial Ratios
Amgen’s Return on Equity (ROE) exhibited volatility, peaking above 100% in 2022 and 2023 before declining to 89% in 2025. The Current Ratio gradually decreased from roughly 1.6 in 2021 to 1.14 in 2025, indicating a reduction in short-term liquidity. The Debt-to-Equity Ratio showed a sharp increase from 5.0 in 2021 to over 10.3 in 2023, then improved to 6.3 in 2025, reflecting fluctuating leverage and capital structure adjustments.
Are the Financial Ratios Favorable?
In 2025, profitability ratios like net margin (21%) and ROE (89%) are favorable, supported by a strong ROIC of 18.35% versus a WACC of 5.53%, signaling efficient capital use. Liquidity ratios such as the Current (1.14) and Quick (0.9) ratios are neutral, while leverage ratios remain unfavorable, with a high Debt-to-Equity (6.31) and Debt-to-Assets (60.28%) indicating elevated financial risk. Market valuation metrics show a neutral P/E (22.84) but unfavorable Price-to-Book (20.34), suggesting premium pricing. Overall, the financial ratios appear slightly favorable.
Shareholder Return Policy
Amgen Inc. maintains a consistent dividend policy with a payout ratio around 66%, yielding close to 2.9% annually. The dividend per share has steadily increased, supported by free cash flow coverage above 80%. The company also conducts share buybacks.
This balanced approach combines dividends and buybacks, reflecting prudent capital allocation. Coverage ratios suggest distributions are sustainable, though high leverage warrants monitoring. Overall, the policy aligns with stable, long-term shareholder value creation.
Score analysis
The following radar chart visualizes key financial scores for Amgen Inc., highlighting strengths and weaknesses across valuation and profitability metrics:
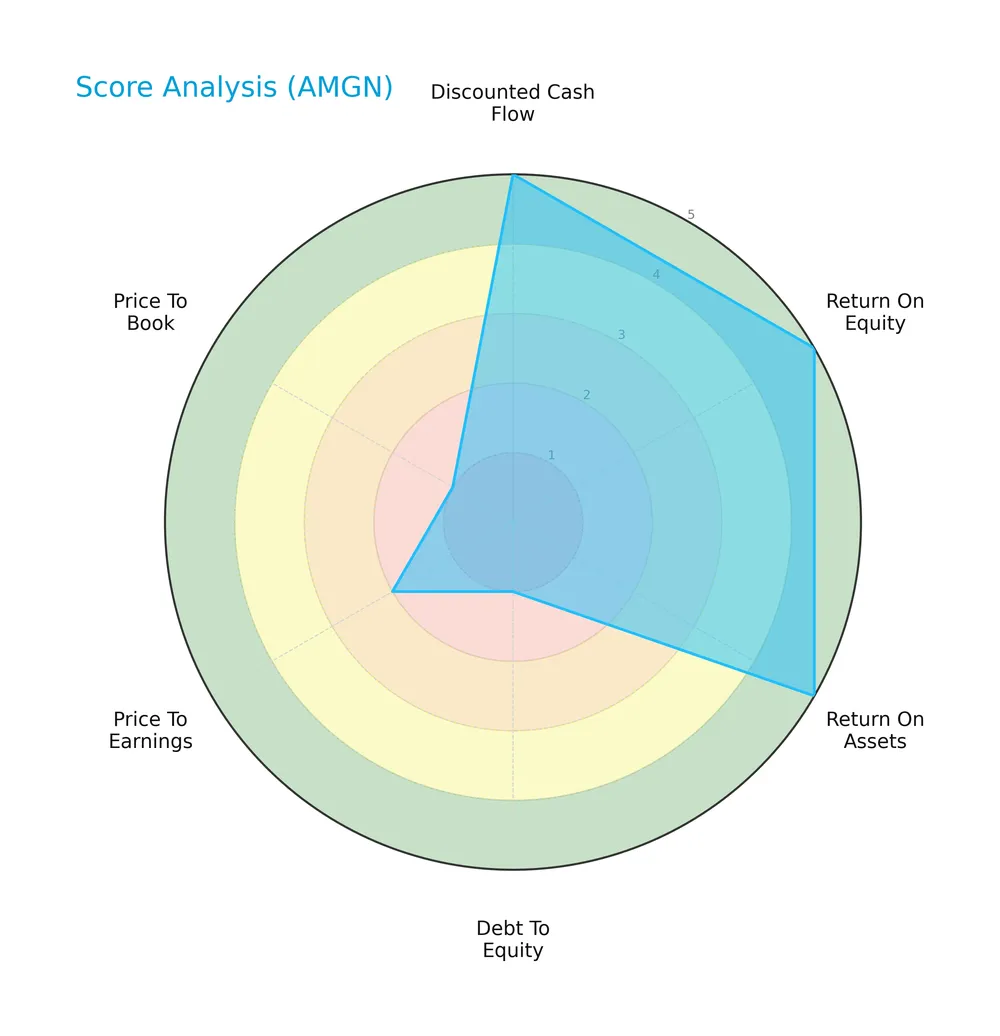
Amgen scores very favorably on discounted cash flow, return on equity, and return on assets, indicating strong profitability. However, debt-to-equity, price-to-earnings, and price-to-book ratios reflect unfavorable valuation and leverage concerns.
Analysis of the company’s bankruptcy risk
Amgen’s Altman Z-Score places it in the grey zone, signalling moderate bankruptcy risk and some financial caution warranted:

Is the company in good financial health?
The Piotroski Score diagram below illustrates Amgen’s robust financial health status:

With a very strong Piotroski Score of 8, Amgen demonstrates solid profitability, efficient capital use, and healthy financial strength, which supports its investment appeal.
Competitive Landscape & Sector Positioning
This section examines Amgen Inc.’s strategic positioning, revenue breakdown, key products, and main competitors. I will assess whether Amgen holds a sustainable competitive advantage within its sector.
Strategic Positioning
Amgen maintains a diversified product portfolio across inflammation, oncology, and cardiovascular diseases, with significant revenue from multiple flagship drugs. Its geographic exposure is concentrated in the U.S. (around 71%), supported by growing international sales, reflecting a balanced but U.S.-centric strategy.
Revenue by Segment
This pie chart illustrates Amgen Inc.’s revenue distribution by product segments for fiscal year 2024, highlighting the diverse sources of its total sales.

In 2024, Amgen’s revenue is driven primarily by “Other Products” at 5.63B and Prolia at 4.37B, signaling a broad portfolio base. ENBREL remains significant at 3.32B but shows a gradual decline from previous years. Notably, Repatha and XGEVA each contribute over 2.2B, reflecting strong footholds in their respective markets. The recent year shows revenue concentration in a few key biologics, indicating reliance risks but also resilience in core treatments.
Key Products & Brands
Below is a summary table of Amgen Inc.’s key products and their descriptions:
| Product | Description |
|---|---|
| Enbrel | Treats plaque psoriasis, rheumatoid arthritis, and psoriatic arthritis. |
| Neulasta | Reduces infection risk due to low white blood cell count in cancer patients. |
| Prolia | Treats postmenopausal women with osteoporosis. |
| Xgeva | Prevents skeletal-related events. |
| Otezla | Treats adult patients with plaque psoriasis, psoriatic arthritis, and oral ulcers from Behçet’s disease. |
| Aranesp | Treats anemia by increasing red blood cell count. |
| Kyprolis | Treats relapsed or refractory multiple myeloma. |
| Repatha | Reduces risks of myocardial infarction, stroke, and coronary revascularization. |
| Nplate | Immune thrombocytopenia treatment. |
| Vectibix | Treats metastatic colorectal cancer. |
| MVASI | Biosimilar to Avastin for cancer treatment. |
| Parsabiv | Treats secondary hyperparathyroidism in dialysis patients. |
| EPOGEN | Treats anemia due to chronic kidney disease or chemotherapy. |
| KANJINTI | Biosimilar to Herceptin for HER2-positive breast cancer. |
| BLINCYTO | Treats certain types of acute lymphoblastic leukemia. |
| Aimovig | Prevents migraine. |
| EVENITY | Treats osteoporosis in postmenopausal women at high fracture risk. |
| AMGEVITATM | Biosimilar to Humira for autoimmune diseases. |
| Sensipar/Mimpara | Controls parathyroid hormone in chronic kidney disease patients. |
| NEUPOGEN | Stimulates white blood cell production. |
| IMLYGIC | Treats melanoma through oncolytic viral therapy. |
| Corlanor | Treats chronic heart failure. |
| AVSOLA | Biosimilar to Remicade for autoimmune diseases. |
| TEPEZZA | Treats thyroid eye disease. |
| TEZSPIRE | Treats severe asthma. |
| KRYSTEXXA | Treats chronic gout refractory to conventional therapy. |
Amgen’s product portfolio spans inflammation, oncology, bone health, cardiovascular, nephrology, and neuroscience. Their mix combines established biologics, biosimilars, and novel therapies, reflecting diversified revenue sources in a competitive biopharma sector.
Main Competitors
There are 10 main competitors in the Healthcare sector, showing the top 10 leaders by market capitalization:
| Competitor | Market Cap. |
|---|---|
| Eli Lilly and Company | 970B |
| Johnson & Johnson | 500B |
| AbbVie Inc. | 405B |
| AstraZeneca PLC | 285B |
| Merck & Co., Inc. | 268B |
| Amgen Inc. | 176B |
| Gilead Sciences, Inc. | 151B |
| Pfizer Inc. | 143B |
| Bristol-Myers Squibb Company | 109B |
| Biogen Inc. | 26B |
Amgen Inc. ranks 6th among its top competitors. Its market cap is approximately 20% that of the leader, Eli Lilly. Amgen sits below both the average top 10 market cap of 303B and the sector median of 222B. It maintains a 34.6% gap above its nearest competitor, Merck, highlighting a moderate scale advantage in the mid-tier group.
Comparisons with competitors
Check out how we compare the company to its competitors:
Does Amgen have a competitive advantage?
Amgen demonstrates a sustainable competitive advantage, consistently creating value with an ROIC 12.8% above WACC and a strong upward ROIC trend. This reflects efficient capital use and growing profitability in the drug manufacturing sector.
Looking ahead, Amgen focuses on expanding therapies in inflammation, oncology, and neuroscience. Collaborations on novel treatments like VS-6766 and KHK4083 position it well to capture new markets and innovate within complex disease areas.
SWOT Analysis
This SWOT analysis highlights Amgen Inc.’s core competitive factors and challenges to inform strategic decisions.
Strengths
- strong global presence with $33.4B revenue
- robust gross margin at 82.5%
- very favorable moat with growing ROIC
- diverse product portfolio across key therapy areas
Weaknesses
- high debt-to-equity ratio at 6.31 raises financial risk
- asset turnover at 0.41 signals capital inefficiency
- unfavorable price-to-book ratio at 20.34 reflects valuation concerns
Opportunities
- expanding international markets with growing non-US sales
- advancements in oncology and autoimmune therapies
- strategic collaborations boosting pipeline innovation
Threats
- pricing pressures from generic competition
- regulatory risks in drug approvals
- patent expirations impacting key products
Amgen demonstrates a durable competitive advantage and solid profitability. However, leverage and capital efficiency weaknesses require cautious capital allocation. Growth hinges on innovation and global expansion amid increasing competitive and regulatory challenges.
Stock Price Action Analysis
The following weekly chart displays Amgen Inc.’s stock price movement over the past 12 months, highlighting key fluctuations and overall trajectory:
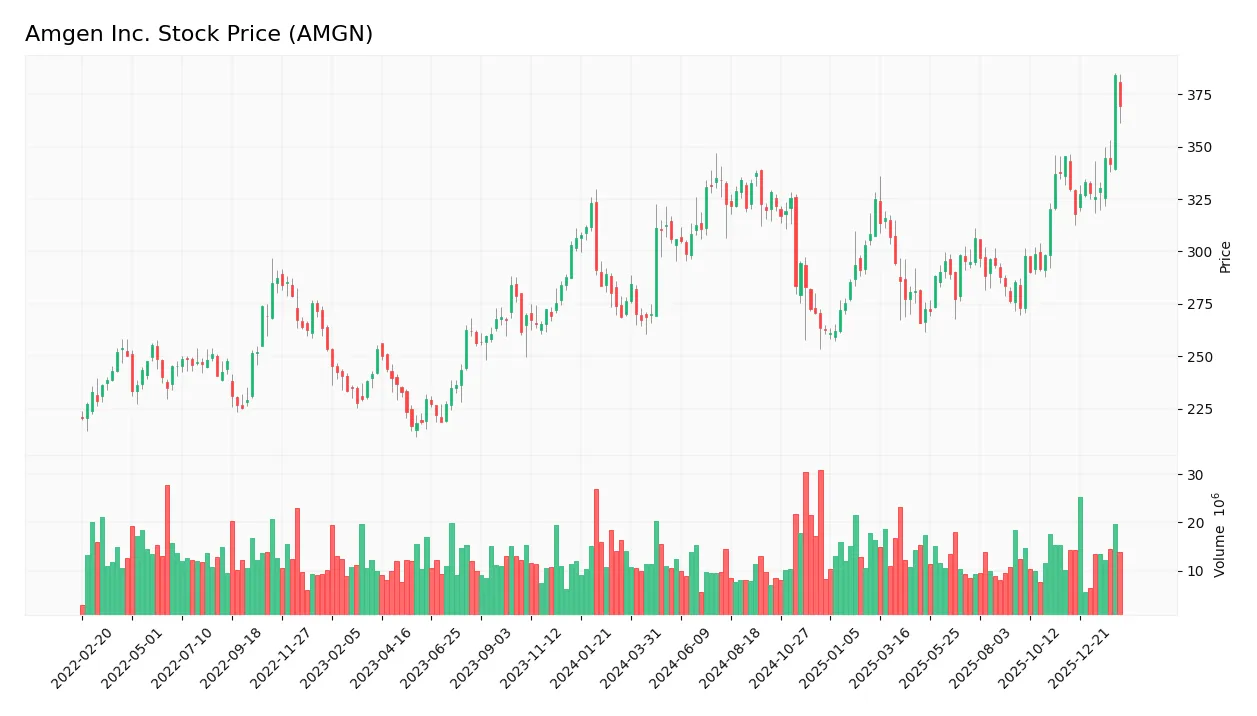
Trend Analysis
Over the past 12 months, AMGN’s stock price rose by 33.68%, indicating a strong bullish trend. The trend exhibits acceleration with volatility measured by a 24.99 standard deviation. The stock reached a high of 384.32 and a low of 261.22, confirming upward momentum.
Volume Analysis
Trading volume shows an increasing trend with total volume at 1.56B shares. Buyer volume slightly exceeds seller volume at 50.82%, indicating balanced but gradually stronger buying interest. Recent three-month data reveal a neutral buyer behavior with 52.91% buyer dominance, suggesting stable market participation.
Target Prices
Analysts set a clear target price consensus for Amgen Inc., reflecting confidence in its growth prospects.
| Target Low | Target High | Consensus |
|---|---|---|
| 295 | 425 | 358.33 |
The target range suggests upside potential from current levels, with a consensus price signaling steady appreciation expectations.

Don’t Let Luck Decide Your Entry Point
Optimize your entry points with our advanced ProRealTime indicators. You’ll get efficient buy signals with precise price targets for maximum performance. Start outperforming now!
Analyst & Consumer Opinions
This section reviews analyst ratings and consumer feedback to provide a balanced view of Amgen Inc.’s market perception.
Stock Grades
The latest verified analyst ratings for Amgen Inc. reveal a stable consensus with few changes across major firms:
| Grading Company | Action | New Grade | Date |
|---|---|---|---|
| Guggenheim | Maintain | Neutral | 2026-02-06 |
| Argus Research | Maintain | Buy | 2026-02-06 |
| Morgan Stanley | Maintain | Equal Weight | 2026-02-04 |
| Cantor Fitzgerald | Maintain | Neutral | 2026-02-04 |
| Leerink Partners | Maintain | Outperform | 2026-02-04 |
| Citigroup | Maintain | Neutral | 2026-02-04 |
| UBS | Maintain | Buy | 2026-01-26 |
| Bernstein | Downgrade | Market Perform | 2026-01-20 |
| Truist Securities | Maintain | Hold | 2026-01-08 |
| Morgan Stanley | Maintain | Equal Weight | 2025-12-12 |
Most analysts maintain neutral to positive ratings, with a strong bias toward buy and hold recommendations. Bernstein’s recent downgrade to market perform stands out as a cautious note amid steady or unchanged grades.
Consumer Opinions
Amgen Inc. generates mixed but insightful consumer sentiment that reveals key perceptions of its products and service.
| Positive Reviews | Negative Reviews |
|---|---|
| High-quality, effective biopharmaceuticals | Expensive pricing limits accessibility |
| Reliable product efficacy | Complex insurance and reimbursement process |
| Strong customer support and patient education | Occasional delays in order fulfillment |
Overall, consumers praise Amgen’s product effectiveness and support but often cite high costs and administrative hurdles as barriers. This feedback highlights Amgen’s strength in innovation but reveals pricing as a persistent challenge.
Risk Analysis
Below is a summary of key risks facing Amgen Inc., categorized by type, with their likelihood and potential impact:
| Category | Description | Probability | Impact |
|---|---|---|---|
| Financial Leverage | High debt-to-equity ratio (6.31) and debt-to-assets (60.28%) increase financial risk. | Medium | High |
| Valuation | Elevated price-to-book ratio (20.34) signals possible overvaluation risk. | Medium | Medium |
| Liquidity | Current ratio (1.14) and quick ratio (0.9) are moderate, posing some short-term liquidity risk. | Medium | Medium |
| Market Volatility | Low beta (0.472) reduces market risk but may limit upside in bull markets. | Low | Low |
| Regulatory | Drug approval and patent expirations may disrupt revenue streams in a highly regulated sector. | Medium | High |
Amgen’s most significant risks stem from its heavy leverage and regulatory environment. The company sits in the Altman Z-Score grey zone (2.34), indicating moderate financial distress risk. However, a very strong Piotroski score (8) reflects operational strength that partially offsets these concerns. Investors should watch debt levels and regulatory developments closely.
Should You Buy Amgen Inc.?
Amgen appears to be a profitable company with a durable competitive moat supported by growing ROIC well above WACC. While its leverage profile raises caution, the overall B+ rating suggests a favorable but balanced investment profile amid moderate financial risks.
Strength & Efficiency Pillars
Amgen Inc. demonstrates strong operational efficiency, supported by a net margin of 20.98% and a return on equity (ROE) of 89.06%. Its return on invested capital (ROIC) stands at 18.35%, comfortably above the weighted average cost of capital (WACC) at 5.53%, confirming Amgen as a clear value creator. The company’s growing ROIC trend enhances its moat, signaling a sustainable competitive advantage and effective capital allocation in a challenging healthcare sector.
Weaknesses and Drawbacks
Amgen’s Altman Z-Score of 2.34 places it in the grey zone, indicating moderate financial risk but no immediate distress. However, the company faces significant leverage concerns, with a debt-to-equity ratio of 6.31 and debt-to-assets at 60.28%, both unfavorable. Its price-to-book ratio at 20.34 suggests an expensive valuation relative to book value. While the current ratio of 1.14 is neutral, these leverage figures raise caution about balance sheet resilience under economic stress.
Our Final Verdict about Amgen Inc.
Despite a solid profitability profile and value creation, Amgen’s moderate solvency risk reflected by a grey zone Altman Z-Score suggests prudence. The company’s strong fundamentals and bullish long-term trend could appeal to investors, but the valuation premium and leverage warrant a measured, wait-and-see approach. Amgen may appear attractive for long-term exposure but requires careful risk management amid market uncertainties.
Disclaimer: This content is for informational purposes only and does not constitute financial, investment, or other professional advice. Investing in financial markets involves a significant risk of loss, and past performance is not indicative of future results.
Additional Resources
- Here’s What Argus Research and Guggenheim Are Saying About Amgen Inc. (AMGN) – Yahoo Finance (Feb 13, 2026)
- How to watch Amgen at Citi’s 2026 virtual oncology summit – Stock Titan (Feb 13, 2026)
- LSV Asset Management Raises Holdings in Amgen Inc. $AMGN – MarketBeat (Feb 13, 2026)
- AMGEN INC SEC 10-K Report – TradingView (Feb 13, 2026)
- Two Days Left Until Amgen Inc. (NASDAQ:AMGN) Trades Ex-Dividend – simplywall.st (Feb 10, 2026)
For more information about Amgen Inc., please visit the official website: amgen.com