Home > Analyses > Industrials > AMETEK, Inc.
AMETEK, Inc. powers critical industries with precision instruments and engineered solutions that touch daily life and advanced technology alike. Its dual focus on electronic instruments and electromechanical devices drives innovation across aerospace, industrial machinery, and medical sectors. Known for durable, high-quality products, AMETEK shapes markets through relentless engineering excellence. As we assess its robust market position, the key question is whether AMETEK’s fundamentals still support its premium valuation and growth trajectory.

Table of contents
Business Model & Company Overview
AMETEK, Inc., founded in 1930 and headquartered in Berwyn, Pennsylvania, commands a leading position in the industrial machinery sector. It delivers a cohesive ecosystem of electronic instruments and electromechanical devices that serve diverse markets—from aerospace to pharmaceuticals. The company’s two segments, Electronic Instruments and Electromechanical, integrate advanced technology with precision engineering to solve critical industrial challenges globally.
AMETEK’s revenue engine balances hardware sales with specialized, high-margin instruments and engineered components. Its products span process control, aerospace sensors, precision motion control, and thermal management, reaching customers across the Americas, Europe, and Asia. This diversified portfolio and global footprint create a durable economic moat, securing AMETEK’s role as a key innovator shaping its industry’s future.
Financial Performance & Fundamental Metrics
I analyze AMETEK, Inc.’s income statement, key financial ratios, and dividend payout policy to assess its core financial health and shareholder value.
Income Statement
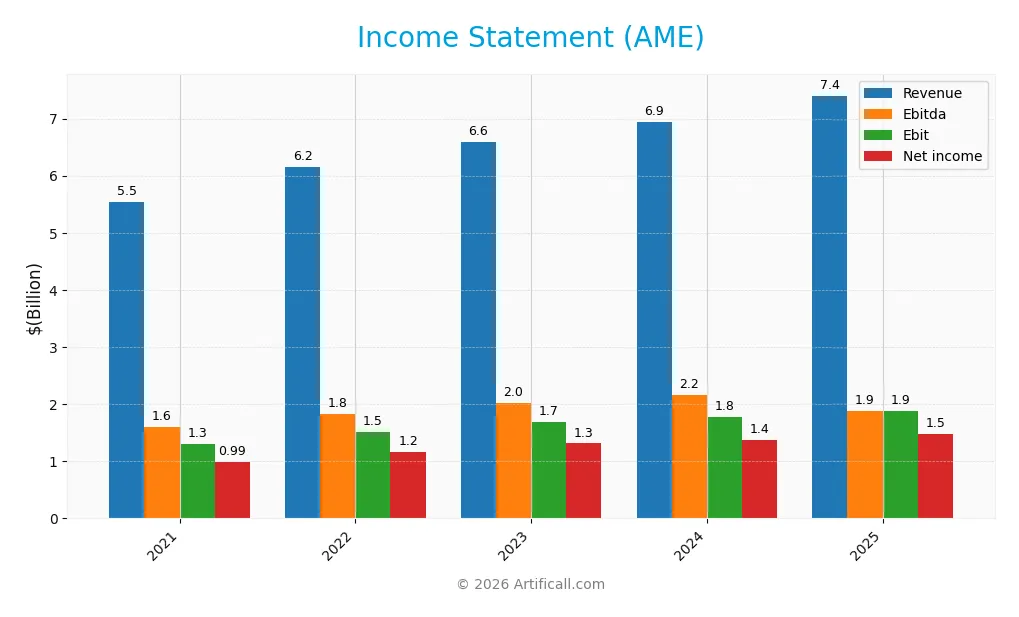
The following table presents AMETEK, Inc.’s key income statement figures for fiscal years 2021 through 2025, reflecting revenue and profitability trends.
| 2021 | 2022 | 2023 | 2024 | 2025 | |
|---|---|---|---|---|---|
| Revenue | 5.55B | 6.15B | 6.60B | 6.94B | 7.40B |
| Cost of Revenue | 3.63B | 4.01B | 4.21B | 4.46B | 4.71B |
| Operating Expenses | 604M | 645M | 677M | 697M | 757M |
| Gross Profit | 1.91B | 2.15B | 2.38B | 2.48B | 2.69B |
| EBITDA | 1.60B | 1.83B | 2.03B | 2.16B | 1.88B |
| EBIT | 1.30B | 1.51B | 1.69B | 1.77B | 1.88B |
| Interest Expense | 80M | 83M | 82M | 113M | 81M |
| Net Income | 990M | 1.16B | 1.31B | 1.38B | 1.48B |
| EPS | 4.29 | 5.04 | 5.70 | 5.95 | 6.42 |
| Filing Date | 2022-02-22 | 2023-02-21 | 2024-02-22 | 2025-02-20 | 2026-02-17 |
Income Statement Evolution
From 2021 to 2025, AMETEK’s revenue rose 33.4%, reflecting steady growth. Net income surged 49.5%, improving margins overall. The gross margin expanded to 36.4% in 2025, while the net margin reached 20.0%, both favorable. Operating expenses grew in line with revenue, maintaining stable profitability ratios.
Is the Income Statement Favorable?
In 2025, AMETEK showed solid fundamentals with a 6.6% revenue increase and 5.9% EBIT growth. The 25.4% EBIT margin and 1.1% interest expense ratio indicate efficient operations and manageable debt costs. Net margin growth was modest but positive. Overall, 78.6% of income statement metrics are favorable, signaling robust financial health.
Financial Ratios
The table below summarizes key financial ratios for AMETEK, Inc. over the past five fiscal years:
| Ratios | 2021 | 2022 | 2023 | 2024 | 2025 |
|---|---|---|---|---|---|
| Net Margin | 18% | 19% | 20% | 20% | 20% |
| ROE | 14% | 16% | 15% | 14% | 14% |
| ROIC | 10% | 11% | 10% | 11% | 11% |
| P/E | 34.3 | 27.9 | 28.9 | 30.3 | 32.0 |
| P/B | 4.94 | 4.33 | 4.35 | 4.32 | 4.45 |
| Current Ratio | 1.36 | 1.62 | 0.98 | 1.24 | 1.06 |
| Quick Ratio | 0.87 | 0.95 | 0.59 | 0.75 | 0.67 |
| D/E | 0.40 | 0.34 | 0.39 | 0.24 | 0.21 |
| Debt-to-Assets | 23% | 21% | 22% | 16% | 14% |
| Interest Coverage | 16.3 | 18.0 | 20.9 | 15.8 | 23.8 |
| Asset Turnover | 0.47 | 0.49 | 0.44 | 0.47 | 0.46 |
| Fixed Asset Turnover | 7.05 | 7.63 | 5.88 | 6.58 | 6.56 |
| Dividend Yield | 0.54% | 0.62% | 0.61% | 0.62% | 0.60% |
Evolution of Financial Ratios
From 2021 to 2025, AMETEK’s Return on Equity (ROE) showed minor fluctuations but remained stable around 14–15%, indicating consistent profitability. The Current Ratio declined from 1.36 in 2021 to 1.06 in 2025, reflecting reduced short-term liquidity. Meanwhile, the Debt-to-Equity Ratio improved markedly from 0.40 to 0.21, suggesting stronger leverage management over the period.
Are the Financial Ratios Favorable?
In 2025, AMETEK’s profitability is solid, with a 20% net margin and an 11% ROIC exceeding its 8.3% WACC, signaling value creation. Liquidity is neutral to unfavorable; the Current Ratio is just above 1.0, while the Quick Ratio is weaker at 0.67. Leverage metrics, including a 0.21 debt-to-equity and strong 23x interest coverage, are favorable. Valuation ratios like P/E at 32 and P/B at 4.45 are unfavorable, balancing the overall assessment to slightly favorable.
Shareholder Return Policy
AMETEK, Inc. maintains a consistent dividend payout ratio around 19%, with dividend per share rising steadily to $1.24 in 2025. The annual dividend yield hovers near 0.6%, supported by moderate free cash flow coverage and ongoing share buyback programs.
This balanced approach suggests disciplined capital allocation, aiming to reward shareholders while preserving cash for operations and growth. The dividend and buyback strategy appears aligned with sustainable long-term value creation, avoiding excessive distribution risks.
Score analysis
Here is a radar chart illustrating AMETEK, Inc.’s key financial scores across various valuation and performance metrics:
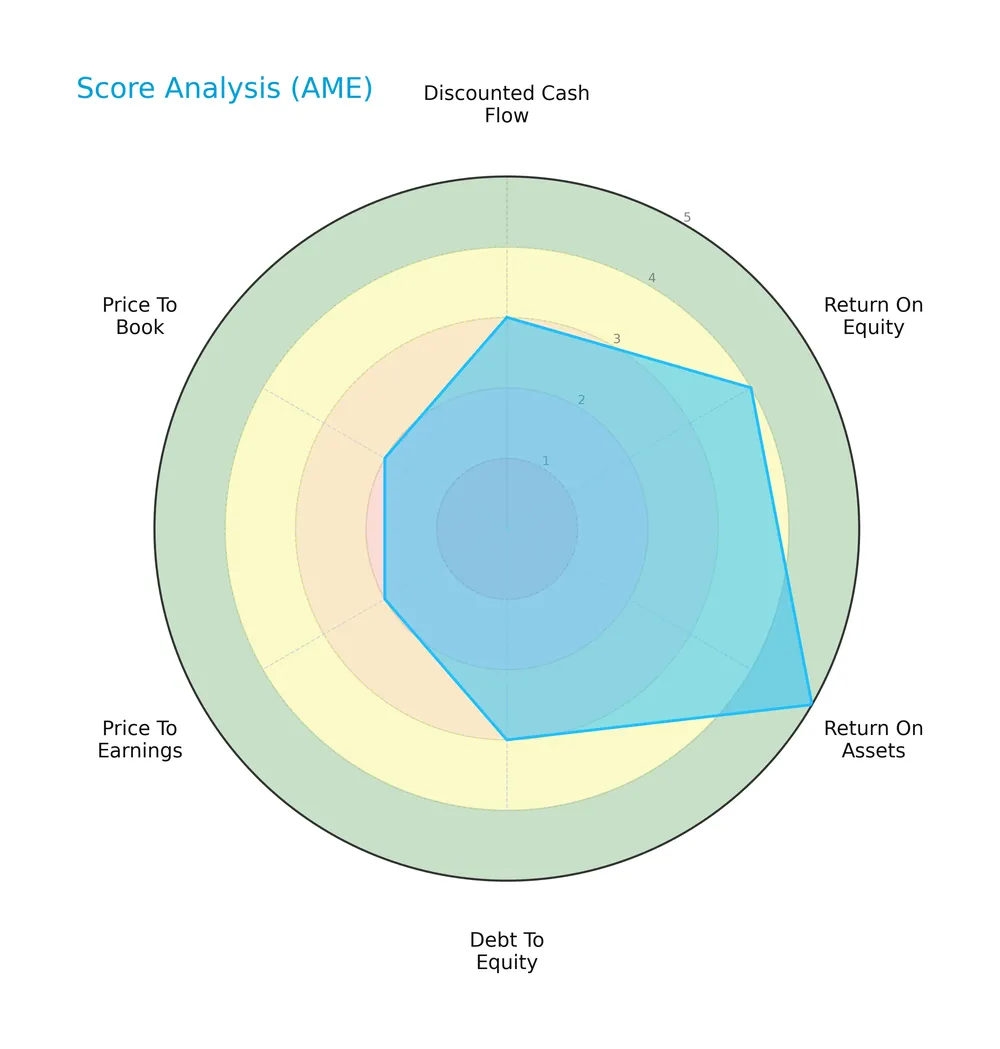
The company shows very favorable return on assets (5) and favorable return on equity (4), indicating strong operational efficiency. Debt-to-equity and discounted cash flow scores are moderate (3), while valuation ratios price-to-earnings and price-to-book score unfavorably low (2), reflecting market valuation concerns.
Analysis of the company’s bankruptcy risk
AMETEK, Inc. sits comfortably in the safe zone with an Altman Z-Score of 6.81, signaling a very low risk of bankruptcy:

Is the company in good financial health?
The Piotroski Score diagram highlights AMETEK’s financial strength, reflected by a strong score of 7:

A score of 7 suggests robust profitability and solid financial health, positioning the company above average in operational and financial quality.
Competitive Landscape & Sector Positioning
This sector analysis explores AMETEK, Inc.’s strategic positioning within the industrial machinery industry. It examines the company’s revenue by segment, key products, and main competitors. I will assess whether AMETEK holds a competitive advantage over its peers based on these factors.
Strategic Positioning
AMETEK operates a diversified portfolio with two main segments: Electronic Instruments (4.9B in 2025) and Electromechanical (2.5B). Its revenue spans multiple industries and global regions, with significant exposure to the US (3.6B), Asia (1.5B), and Europe (1.1B), reflecting balanced geographic diversification.
Revenue by Segment
The pie chart illustrates AMETEK, Inc.’s revenue distribution by segment for fiscal year 2025, highlighting contributions from the Electromechanical Group and Electronic Instruments Group.
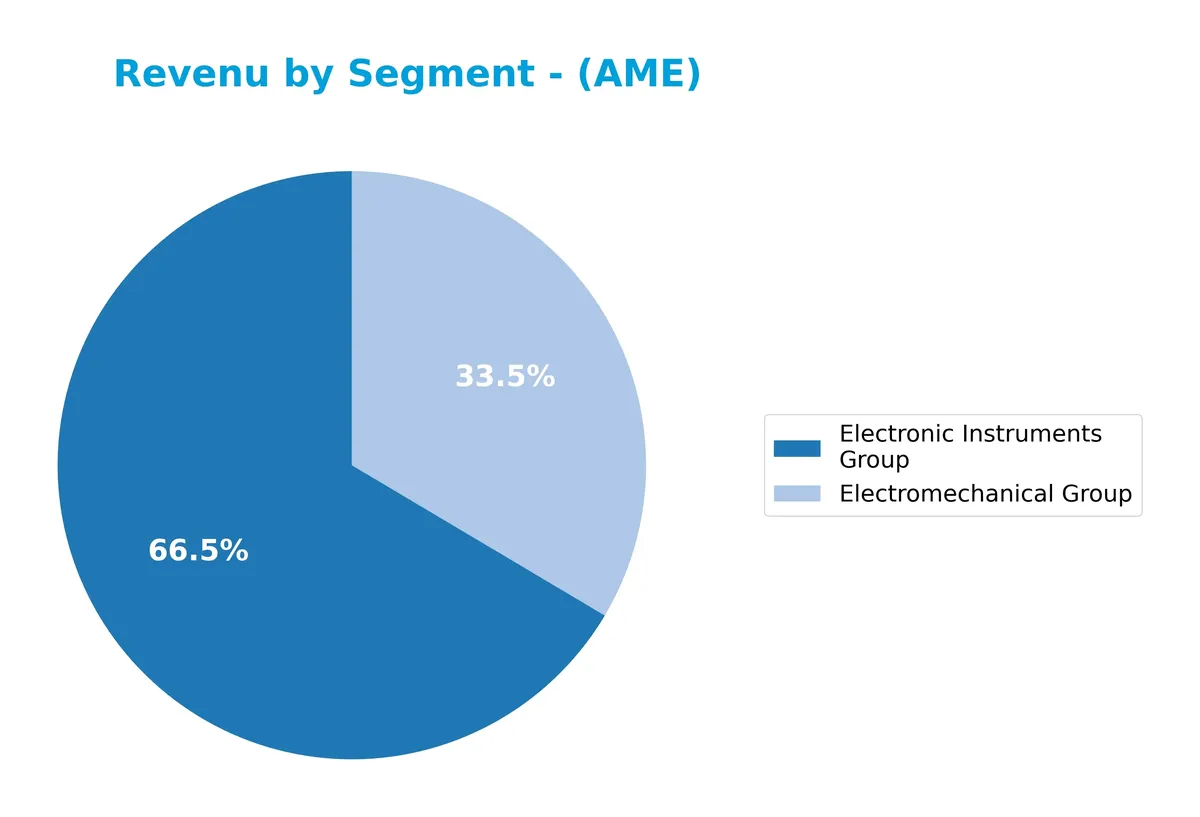
In 2025, the Electronic Instruments Group leads with $4.9B in revenue, significantly outpacing the Electromechanical Group’s $2.5B. Both segments show steady growth over recent years, with the Electromechanical Group accelerating more sharply since 2023. This dual-segment strength reduces concentration risk and signals balanced capital allocation across core operations.
Key Products & Brands
The table below outlines AMETEK’s main product groups and their market applications:
| Product | Description |
|---|---|
| Electronic Instruments Group | Advanced instruments for process, aerospace, power, industrial, laboratory, medical, and test markets. Includes power quality devices and aerospace sensors. |
| Electromechanical Group | Engineered electrical connectors, precision motion control products, specialty metals, motor-blower systems, and aviation maintenance services. |
AMETEK’s product portfolio spans sophisticated electronic instruments and electromechanical devices. Both segments serve diverse, high-demand industrial and aerospace markets, underscoring the company’s broad technological reach.
Main Competitors
There are 24 competitors in the Industrials sector. The table below lists the top 10 leaders by market capitalization:
| Competitor | Market Cap. |
|---|---|
| Eaton Corporation plc | 127B |
| Parker-Hannifin Corporation | 114B |
| Howmet Aerospace Inc. | 85.2B |
| Emerson Electric Co. | 76.3B |
| Illinois Tool Works Inc. | 73B |
| Cummins Inc. | 71.9B |
| AMETEK, Inc. | 48.3B |
| Roper Technologies, Inc. | 46.8B |
| Rockwell Automation, Inc. | 44.8B |
| Symbotic Inc. | 35.9B |
AMETEK, Inc. ranks 7th among 24 competitors. Its market cap represents 42.4% of the leader’s size. The company sits below the top 10 average market cap of 72.4B but above the sector median of 32.4B. It holds a 33.4% gap from the next competitor above, indicating a solid buffer in its peer group.
Comparisons with competitors
Check out how we compare the company to its competitors:
Does AMETEK have a competitive advantage?
AMETEK demonstrates a sustainable competitive advantage, creating value with a ROIC exceeding its WACC by 2.7%, supported by a growing ROIC trend of 11.5% over 2021-2025. Its robust margins and consistent profitability reflect efficient capital allocation and strong operational execution in the industrial machinery sector.
Looking ahead, AMETEK’s diverse product portfolio across electronics and electromechanical segments positions it well to capture growth in aerospace, power, and industrial markets. Its expansion into advanced instrumentation and global geographic reach suggest ongoing opportunities to leverage innovation and market penetration.
SWOT Analysis
This SWOT analysis distills AMETEK’s key internal and external factors shaping its strategic outlook.
Strengths
- strong gross margin at 36%
- ROIC well above WACC, signaling value creation
- diversified industrial segments
Weaknesses
- high P/E and P/B ratios suggest premium valuation
- quick ratio below 1 indicates liquidity caution
- relatively low dividend yield
Opportunities
- growth in international markets, especially Asia
- expanding aerospace and power instrument demand
- potential for operational efficiency improvements
Threats
- global supply chain disruptions
- competitive pressure in industrial machinery
- sensitivity to economic cycles impacting capital expenditures
AMETEK’s robust profitability and competitive moat provide a solid foundation. However, valuation and liquidity warrant careful monitoring. Strategic focus on international growth and operational excellence can offset external risks in a cyclical industry.
Stock Price Action Analysis
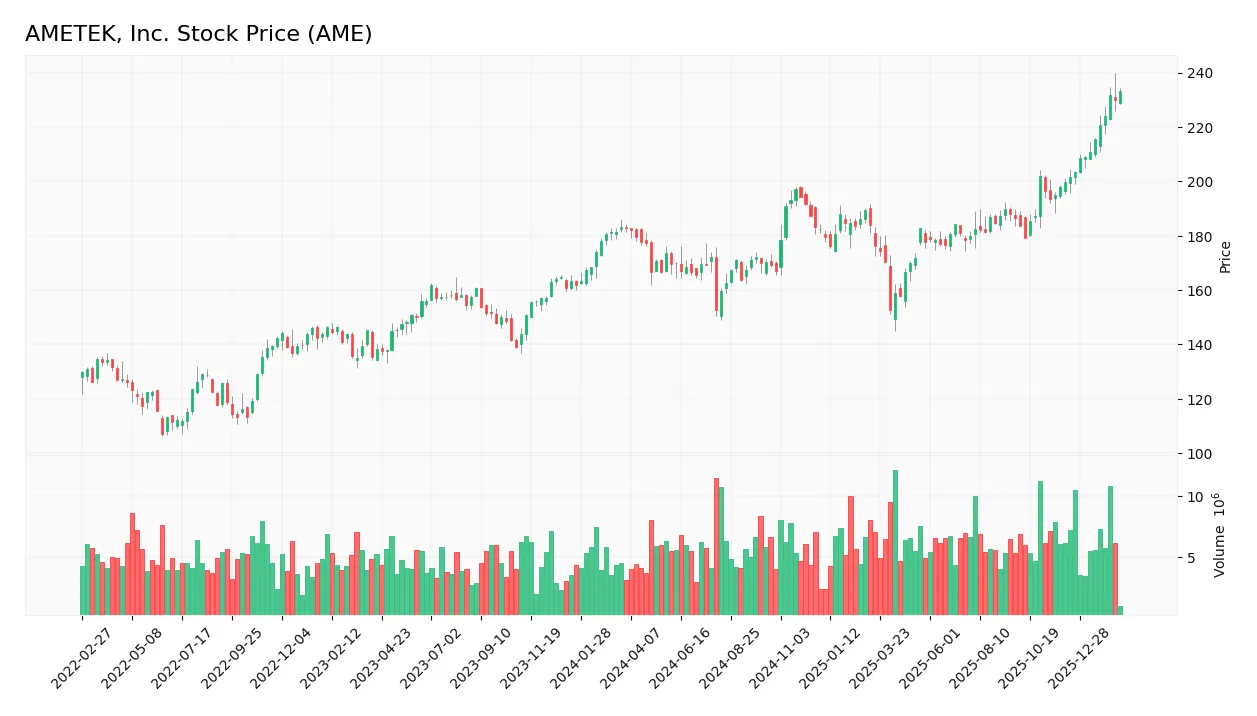
The weekly stock chart below illustrates AMETEK, Inc.’s price movements over the past 12 months, highlighting key highs and lows:
Trend Analysis
Over the past 12 months, AMETEK’s stock price increased by 27.57%, indicating a bullish trend with acceleration. The price ranged from a low of 153 to a high of 233, with volatility reflected in a 16.16 standard deviation. Recent months confirm sustained upward momentum.
Volume Analysis
Trading volume shows an increasing trend, with buyers accounting for 57.26% overall. In the recent period, buyer dominance strengthens to 91.58%, suggesting strong buying interest and heightened market participation. This buyer-driven activity signals positive investor sentiment.
Target Prices
Analysts present a confident target consensus for AMETEK, Inc. in 2026.
| Target Low | Target High | Consensus |
|---|---|---|
| 215 | 271 | 241.64 |
The target prices indicate a strong upside potential, reflecting positive analyst expectations for AMETEK’s performance in the current market cycle.

Don’t Let Luck Decide Your Entry Point
Optimize your entry points with our advanced ProRealTime indicators. You’ll get efficient buy signals with precise price targets for maximum performance. Start outperforming now!
Analyst & Consumer Opinions
This section examines the latest analyst ratings and consumer feedback to gauge AMETEK, Inc.’s market perception.
Stock Grades
Here are the latest verified analyst grades for AMETEK, Inc., reflecting recent rating actions from major firms:
| Grading Company | Action | New Grade | Date |
|---|---|---|---|
| DA Davidson | Maintain | Buy | 2026-02-05 |
| DA Davidson | Maintain | Buy | 2026-02-04 |
| Keybanc | Maintain | Overweight | 2026-02-04 |
| Barclays | Maintain | Equal Weight | 2026-02-04 |
| Oppenheimer | Downgrade | Perform | 2026-01-27 |
| Morgan Stanley | Maintain | Equal Weight | 2026-01-12 |
| Keybanc | Maintain | Overweight | 2026-01-07 |
| Barclays | Maintain | Equal Weight | 2026-01-07 |
| Keybanc | Maintain | Overweight | 2026-01-06 |
| Mizuho | Maintain | Outperform | 2026-01-05 |
The majority of analysts maintain a positive stance, favoring Buy or Overweight ratings. One downgrade from Oppenheimer to Perform stands out but does not shift the overall consensus, which remains bullish.
Consumer Opinions
Consumer sentiment around AMETEK, Inc. reflects a mix of strong product reliability and concerns over customer service responsiveness.
| Positive Reviews | Negative Reviews |
|---|---|
| Products deliver consistent, high-quality results. | Customer support is slow to resolve technical issues. |
| Equipment durability exceeds expectations in demanding environments. | Pricing feels steep compared to competitors. |
| Users appreciate the company’s innovation and technology leadership. | Some users report difficulty accessing detailed product information. |
Overall, consumers praise AMETEK’s product robustness and innovation. However, recurring complaints about customer service delays and pricing pressure warrant caution for prospective buyers.
Risk Analysis
Below is a summary table of key risks facing AMETEK, Inc., highlighting their likelihood and potential impact on the company:
| Category | Description | Probability | Impact |
|---|---|---|---|
| Valuation Risk | Elevated P/E (31.97) and P/B (4.45) ratios suggest potential overvaluation compared to industry. | Medium | High |
| Liquidity Risk | Quick ratio at 0.67 indicates weaker short-term liquidity, posing potential operational stress. | Medium | Medium |
| Market Volatility | Beta of 1.036 signals sensitivity to market swings, impacting share price stability. | Medium | Medium |
| Operational Risk | Asset turnover at 0.46 is below industrial norms, reflecting possible inefficiencies. | Medium | Medium |
| Interest Coverage | Strong interest coverage (23.13) lowers default risk but requires monitoring if conditions shift. | Low | Low |
| Dividend Yield Risk | Low dividend yield (0.6%) may reduce attractiveness for income-focused investors. | Low | Low |
AMETEK’s most pressing risks stem from its stretched valuation and suboptimal liquidity ratios. The P/E and P/B multiples exceed typical industrial sector benchmarks, increasing vulnerability in market corrections. The quick ratio below 1 warns of limited immediate asset coverage for liabilities, a concern during economic downturns. However, a robust Altman Z-Score (6.81) and solid Piotroski Score (7) confirm financial stability, cushioning these risks. Vigilance remains essential as market conditions evolve.
Should You Buy AMETEK, Inc.?
AMETEK appears to be a robustly profitable company with a very favorable competitive moat, evidenced by growing ROIC well above WACC, suggesting strong value creation. Despite a moderate leverage profile, its overall B+ rating reflects solid financial health and operational efficiency.
Strength & Efficiency Pillars
AMETEK, Inc. exhibits solid operational strength, with a net margin of 20.0% and an EBIT margin of 25.4%, reflecting efficient cost management. Its return on invested capital (ROIC) stands at 11.04%, comfortably above the weighted average cost of capital (WACC) at 8.29%, confirming the company is a clear value creator. While return on equity (ROE) at 13.93% remains moderate, AMETEK’s growing ROIC trend and a strong Piotroski score of 7 underscore sustainable competitive advantages and robust financial health.
Weaknesses and Drawbacks
The company’s valuation metrics raise caution. A price-to-earnings ratio of 31.97 and price-to-book of 4.45 suggest a premium valuation relative to sector averages, potentially limiting upside. Liquidity metrics reveal some vulnerabilities: a quick ratio of 0.67 indicates lower immediate liquidity, which could pressure short-term obligations. Despite a low debt-to-equity ratio of 0.21 reflecting conservative leverage, the modest current ratio of 1.06 suggests limited buffer against sudden liquidity shocks. Dividend yield at 0.6% also underwhelms income-focused investors.
Our Final Verdict about AMETEK, Inc.
AMETEK displays a fundamentally strong profile with clear value creation and operational efficiency. The bullish long-term trend and dominant buyer activity, with 91.58% buyer dominance recently, suggest positive momentum. However, the company’s high valuation multiples and modest liquidity metrics counsel prudence. This profile might appear attractive for long-term exposure, though investors could consider waiting for a more favorable entry point amid current premium pricing.
Disclaimer: This content is for informational purposes only and does not constitute financial, investment, or other professional advice. Investing in financial markets involves a significant risk of loss, and past performance is not indicative of future results.
Additional Resources
- Decoding AMETEK Inc (AME): A Strategic SWOT Insight – GuruFocus (Feb 18, 2026)
- AMETEK INC/ SEC 10-K Report – TradingView (Feb 17, 2026)
- P/E Ratio Insights for AMETEK – Benzinga (Feb 17, 2026)
- Should You Think About Buying AMETEK, Inc. (NYSE:AME) Now? – Yahoo Finance (Feb 13, 2026)
- AMETEK, Inc. $AME Shares Sold by TimesSquare Capital Management LLC – MarketBeat (Feb 15, 2026)
For more information about AMETEK, Inc., please visit the official website: ametek.com