Home > Analyses > Financial Services > Ameriprise Financial, Inc.
Ameriprise Financial shapes how millions secure their financial futures through expert advice and tailored wealth management. The firm dominates asset management with a diverse product suite, including retirement solutions, insurance, and investment advisory services. Known for innovation and a client-centric approach, Ameriprise blends legacy experience with modern financial strategies. As markets evolve, I examine whether its robust fundamentals still support its premium valuation and long-term growth prospects.

Table of contents
Business Model & Company Overview
Ameriprise Financial, Inc., founded in 1894 and headquartered in Minneapolis, MN, stands as a leading player in asset management and financial services. The company unites a broad spectrum of offerings—financial planning, wealth management, insurance, and investment products—into a cohesive ecosystem that serves both individual and institutional clients. With 13,600 employees, Ameriprise operates at scale, delivering tailored advice and solutions across a complex financial landscape.
Its revenue engine balances recurring advisory fees with commissions from brokerage and insurance products, creating diversified cash flow streams. Ameriprise extends its reach through four segments: Advice & Wealth Management, Asset Management, Retirement & Protection Solutions, and Corporate & Other, serving clients across the Americas, Europe, and Asia. This multifaceted approach strengthens its economic moat, positioning it as a key architect in shaping the future of wealth management globally.
Financial Performance & Fundamental Metrics
I analyze Ameriprise Financial’s income statement, key financial ratios, and dividend payout policy to evaluate its profitability, efficiency, and shareholder returns.
Income Statement
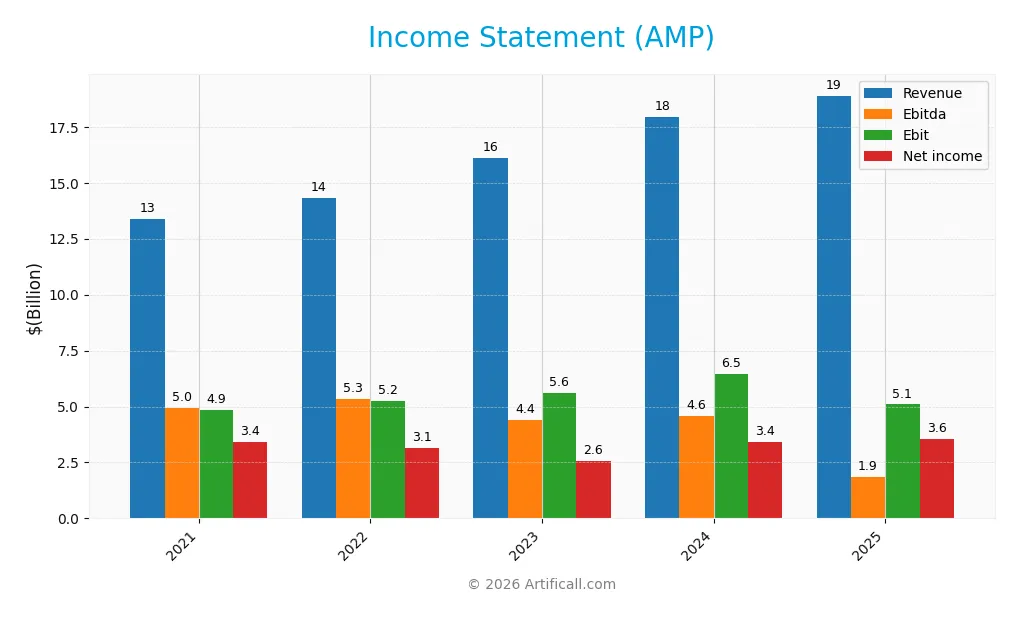
The following table summarizes Ameriprise Financial, Inc.’s key income statement figures for fiscal years 2021 through 2025.
| 2021 | 2022 | 2023 | 2024 | 2025 | |
|---|---|---|---|---|---|
| Revenue | 13.4B | 14.3B | 16.1B | 17.9B | 18.9B |
| Cost of Revenue | 5.1B | 5.4B | 6.7B | 7.6B | 8.7B |
| Operating Expenses | 3.4B | 3.7B | 3.8B | 3.9B | 5.1B |
| Gross Profit | 8.3B | 8.9B | 9.4B | 10.4B | 10.2B |
| EBITDA | 4.9B | 5.3B | 4.4B | 4.6B | 1.9B |
| EBIT | 4.9B | 5.2B | 5.6B | 6.5B | 5.1B |
| Interest Expense | 0.2B | 0.2B | 0.3B | 0.3B | 0.3B |
| Net Income | 3.4B | 3.1B | 2.6B | 3.4B | 3.6B |
| EPS | 29.1 | 28.3 | 24.2 | 33.7 | 36.9 |
| Filing Date | 2022-02-25 | 2023-02-23 | 2024-02-22 | 2025-02-20 | 2026-02-19 |
Income Statement Evolution
Ameriprise Financial’s revenue rose steadily by 41.1% from 2021 to 2025, with a modest 5.4% increase in 2025 alone. Net income showed neutral growth overall, increasing 4.3% over the period. However, gross profit declined slightly last year, and EBIT contracted by 21.2%, reflecting margin pressures despite generally stable operating expenses.
Is the Income Statement Favorable?
In 2025, the company posted a 54.0% gross margin and a 27.0% EBIT margin, both favorable compared to industry standards. Net margin held at 18.9%, though it shrank slightly year-over-year. EPS grew strongly by 10.0%, indicating efficient capital allocation. While some margin erosion signals caution, the overall income statement fundamentals remain favorable in 2025.
Financial Ratios
The following table details key financial ratios for Ameriprise Financial, Inc. (AMP) over the last five fiscal years:
| Ratios | 2021 | 2022 | 2023 | 2024 | 2025 |
|---|---|---|---|---|---|
| Net Margin | 25.5% | 21.97% | 15.88% | 18.97% | 18.86% |
| ROE | 57.5% | 82.8% | 54.0% | 65.1% | 54.4% |
| ROIC | 2.25% | 2.64% | 2.53% | 2.84% | 2.14% |
| P/E | 10.6 | 11.0 | 15.7 | 15.8 | 13.0 |
| P/B | 6.09 | 9.11 | 8.49 | 10.29 | 7.10 |
| Current Ratio | 278.0 | 42.3 | 98.8 | 107.2 | 7.87 |
| Quick Ratio | 278.0 | 42.3 | 98.8 | 107.2 | 7.87 |
| D/E | 0.87 | 1.42 | 1.22 | 1.05 | 0.90 |
| Debt-to-Assets | 2.95% | 3.39% | 3.28% | 3.02% | 3.07% |
| Interest Coverage | 25.4x | 26.4x | 17.3x | 19.6x | 15.7x |
| Asset Turnover | 0.076 | 0.090 | 0.092 | 0.099 | 0.099 |
| Fixed Asset Turnover | N/A | N/A | N/A | N/A | N/A |
| Dividend Yield | 1.41% | 1.54% | 1.37% | 1.07% | 6.51% |
Evolution of Financial Ratios
Ameriprise Financial’s Return on Equity (ROE) showed volatility, peaking above 80% in 2022 before moderating to 54% in 2025. The Current Ratio declined sharply from an exceptionally high 278 in 2021 to 7.87 in 2025, indicating reduced liquidity. Debt-to-Equity Ratio remained relatively stable near 0.9 in 2025, reflecting consistent leverage management. Profitability margins fluctuated but stayed generally stable.
Are the Financial Ratios Favorable?
In 2025, profitability was strong with a net margin of 18.9% and ROE at 54.4%, both favorable versus typical financial sector benchmarks. Liquidity ratios show mixed signals: the current ratio at 7.87 is low compared to prior years but flagged unfavorable, while the quick ratio is favorable at the same level. Leverage and interest coverage ratios remain neutral to favorable; however, asset turnover and price-to-book ratio are unfavorable. Overall, the ratios appear slightly favorable, balancing strengths in profitability and leverage against weaker efficiency and liquidity metrics.
Shareholder Return Policy
Ameriprise Financial, Inc. maintains a high dividend payout ratio around 85% in 2025 with a 6.5% annual yield, supported by free cash flow coverage. The company also executes share buybacks, which complement its shareholder distribution strategy.
While the payout is generous, the elevated ratio may pressure future earnings retention. This distribution approach balances immediate shareholder returns with the risk of limiting reinvestment, making long-term value creation contingent on sustained cash flow and earnings stability.
Score analysis
The following radar chart presents a comprehensive view of key financial scores for Ameriprise Financial, Inc.:
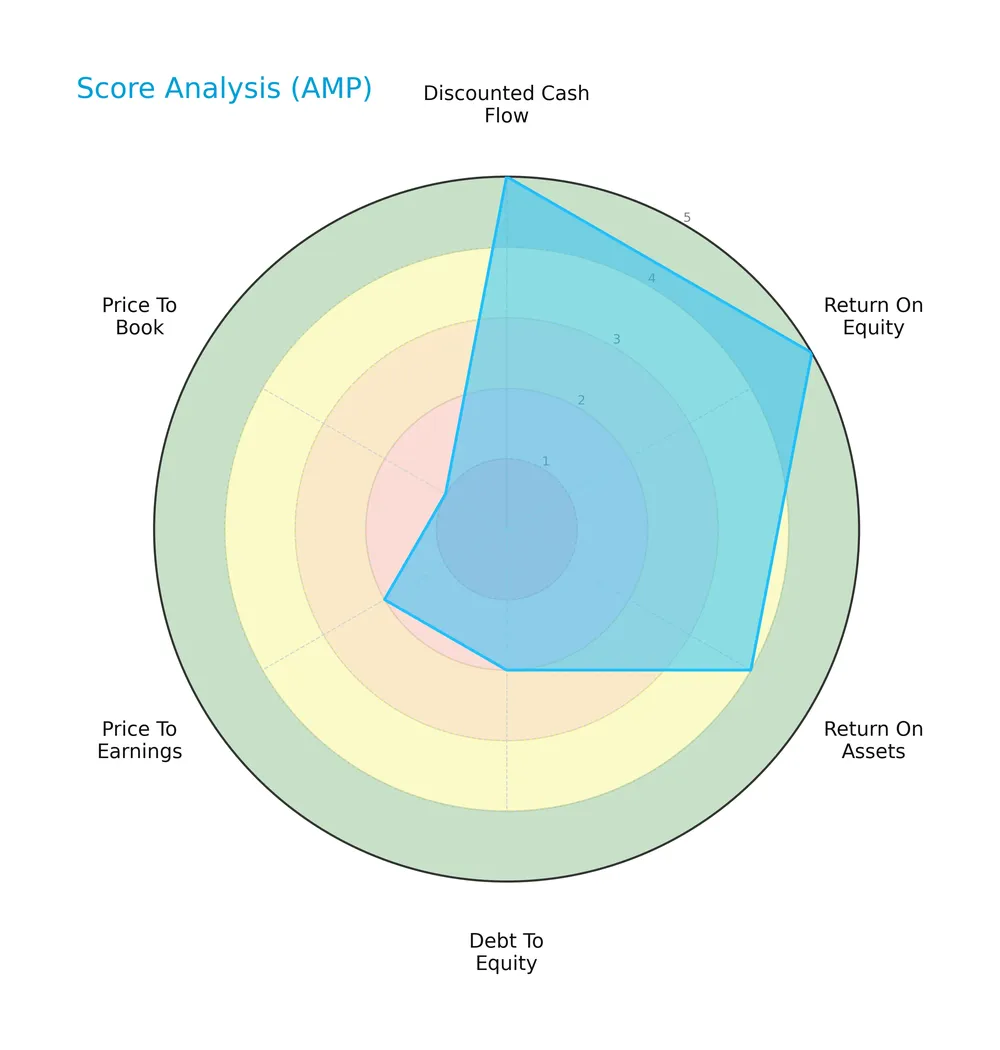
Ameriprise scores very favorably in discounted cash flow and return on equity, indicating strong profitability and valuation metrics. Return on assets remains favorable. However, debt-to-equity, price-to-earnings, and price-to-book scores signal caution due to higher leverage and valuation concerns.
Analysis of the company’s bankruptcy risk
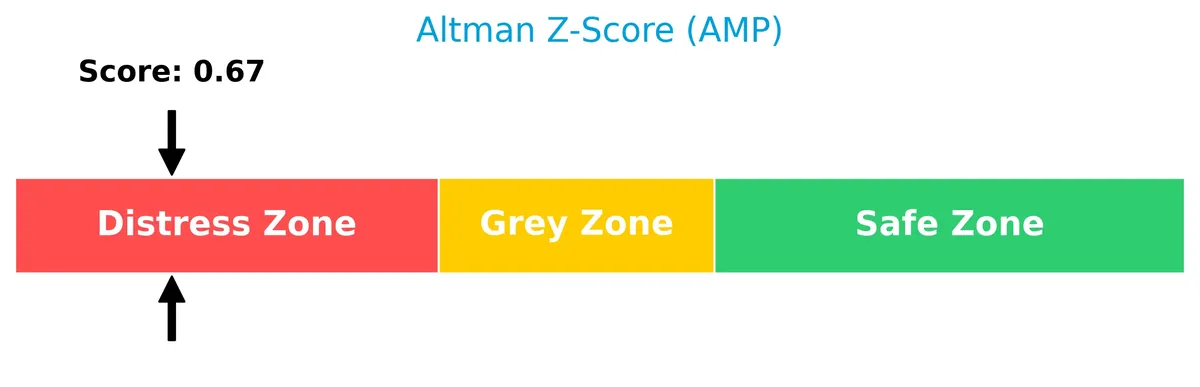
The Altman Z-Score places the company in the distress zone, highlighting a significant risk of financial distress and potential bankruptcy:
Is the company in good financial health?
Here is the Piotroski Score diagram summarizing the company’s financial strength:

With a Piotroski score of 6, Ameriprise demonstrates average financial health. This indicates some strengths in profitability and efficiency but leaves room for improvement in financial robustness and risk management.
Competitive Landscape & Sector Positioning
This sector analysis examines Ameriprise Financial’s strategic positioning, revenue breakdown, key products, and main competitors. I will assess whether Ameriprise holds a competitive advantage in its asset management and financial services markets.
Strategic Positioning
Ameriprise Financial maintains a diversified product portfolio across Advice & Wealth Management, Asset Management, and Retirement & Protection Solutions. Its revenue base is predominantly U.S.-focused, with minimal non-U.S. exposure reported in earlier years, indicating a concentrated geographic presence.
Revenue by Segment
This pie chart illustrates Ameriprise Financial, Inc.’s revenue distribution across key segments for the fiscal year 2025, highlighting the company’s diversified income streams.
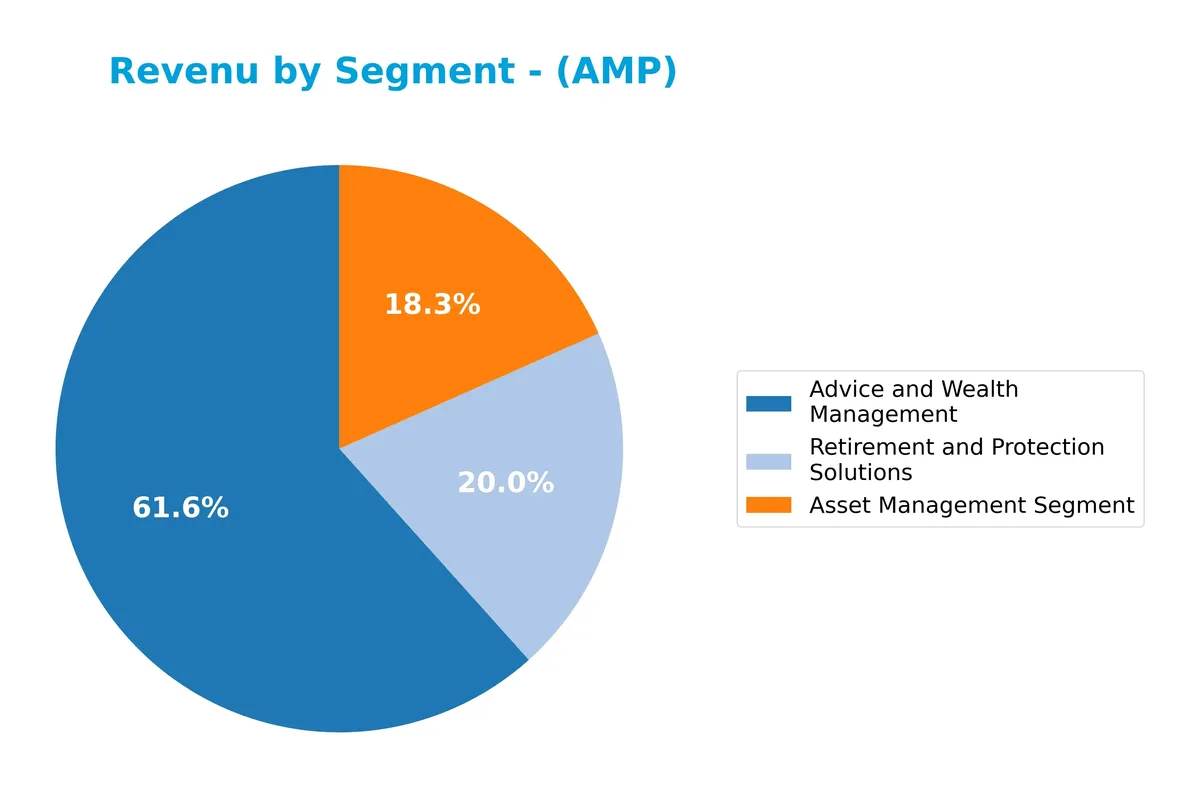
Advice and Wealth Management leads with $12.2B, underlining its dominant role. Retirement and Protection Solutions follow with $4B, showing steady growth. Asset Management contributes $3.6B, reflecting consistency. The trend indicates a strong shift toward advisory services, with the 2025 figures marking an acceleration, emphasizing concentration in wealth management as the primary growth engine.
Key Products & Brands
Ameriprise Financial’s main products and brands by segment and service category are detailed below:
| Product | Description |
|---|---|
| Advice & Wealth Management | Financial planning, brokerage, investment advisory, mutual funds, insurance, annuities, cash management. |
| Asset Management | Investment management and advice, mutual funds, ETFs, hedge funds, property and infrastructure funds. |
| Retirement & Protection | Variable annuities, life insurance, disability insurance products for retail clients. |
Ameriprise’s portfolio spans comprehensive wealth management, diversified asset management products, and retirement-focused insurance solutions. This broad offering supports both individual and institutional client needs.
Main Competitors
There are 11 competitors in total; the table below lists the top 10 leaders by market capitalization:
| Competitor | Market Cap. |
|---|---|
| Blackstone Inc. | 191B |
| BlackRock, Inc. | 168B |
| KKR & Co. Inc. | 115B |
| The Bank of New York Mellon Corporation | 82B |
| Ares Management Corporation | 55B |
| Ameriprise Financial, Inc. | 46B |
| State Street Corporation | 36B |
| Northern Trust Corporation | 26B |
| T. Rowe Price Group, Inc. | 23B |
| Franklin Resources, Inc. | 12B |
Ameriprise Financial ranks 6th among its peers with a market cap at 23% of the sector leader, Blackstone Inc. The company lies below both the average market cap of the top 10 competitors (75B) and the sector median (46B). It enjoys a 24.65% premium over its next closest competitor, Ares Management, reflecting a meaningful gap.
Comparisons with competitors
Check out how we compare the company to its competitors:
Does AMP have a competitive advantage?
Ameriprise Financial, Inc. does not currently present a competitive advantage. Its return on invested capital (ROIC) is significantly below its weighted average cost of capital (WACC), indicating value destruction and declining profitability.
Looking ahead, Ameriprise’s diversified segments—Advice & Wealth Management, Asset Management, and Retirement & Protection Solutions—offer growth opportunities. Expansion in these areas could enhance future competitiveness if operational efficiency improves.
SWOT Analysis
This analysis highlights Ameriprise Financial’s key internal and external factors affecting its market position and strategy.
Strengths
- strong net margin at 18.86%
- high ROE of 54.41%
- diversified financial services portfolio
Weaknesses
- declining ROIC below WACC
- unfavorable asset turnover
- high price-to-book ratio at 7.1
Opportunities
- growing demand for wealth management
- expansion in retirement solutions
- rising digital advisory platforms
Threats
- intense competition in asset management
- regulatory changes in financial services
- market volatility impacting client investments
Ameriprise shows robust profitability and a broad service mix but struggles with capital efficiency. Strategic focus should address value creation and operational agility amid competitive and regulatory pressures.
Stock Price Action Analysis
The weekly chart below highlights Ameriprise Financial, Inc. (AMP) stock price movements over the last 12 months, revealing key highs and lows:
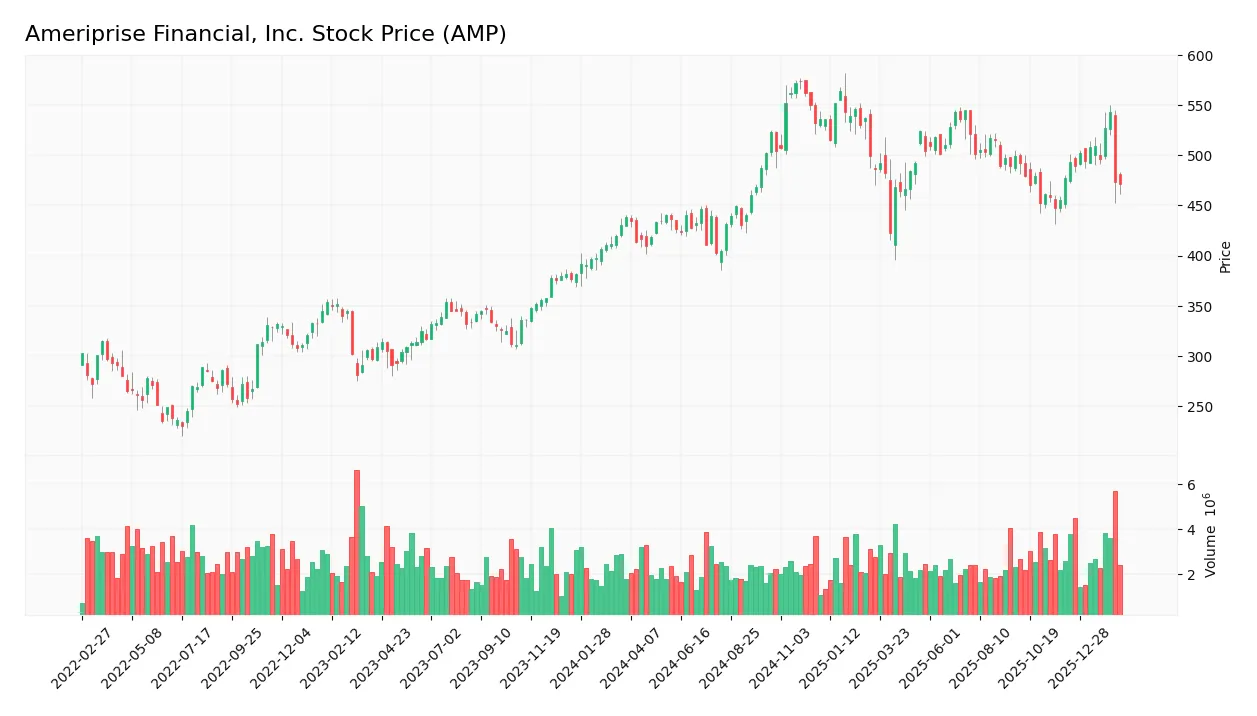
Trend Analysis
Over the past 12 months, AMP’s stock price rose 7.58%, indicating a bullish trend with acceleration. The price ranged between 402.61 and 573.97, showing notable volatility, with a standard deviation of 44.0. Recent weeks show a slight deceleration, with a -1.13% change over the last 11 weeks.
Volume Analysis
Trading volume over the last three months increased, with buyers slightly dominant at 55.48%. Total buyer volume reached 20.5M versus 16.4M seller volume, suggesting moderately positive investor sentiment and growing market participation.
Target Prices
Analysts set a strong target consensus for Ameriprise Financial, Inc., reflecting positive market expectations.
| Target Low | Target High | Consensus |
|---|---|---|
| 485 | 605 | 554.4 |
The target range suggests analysts anticipate upside potential with a consensus price of 554.4, indicating confidence in Ameriprise’s growth prospects.

Don’t Let Luck Decide Your Entry Point
Optimize your entry points with our advanced ProRealTime indicators. You’ll get efficient buy signals with precise price targets for maximum performance. Start outperforming now!
Analyst & Consumer Opinions
This section examines Ameriprise Financial, Inc.’s analyst ratings and consumer feedback to provide a balanced perspective.
Stock Grades
The following table presents recent verified stock grades for Ameriprise Financial, Inc. from established analysts:
| Grading Company | Action | New Grade | Date |
|---|---|---|---|
| RBC Capital | Maintain | Outperform | 2026-02-02 |
| Jefferies | Maintain | Buy | 2026-02-02 |
| Piper Sandler | Upgrade | Neutral | 2026-01-30 |
| Morgan Stanley | Maintain | Underweight | 2025-12-22 |
| Argus Research | Maintain | Buy | 2025-11-13 |
| Keefe, Bruyette & Woods | Maintain | Market Perform | 2025-11-03 |
| RBC Capital | Maintain | Outperform | 2025-11-03 |
| Evercore ISI Group | Maintain | In Line | 2025-10-09 |
| Morgan Stanley | Maintain | Underweight | 2025-10-01 |
| RBC Capital | Maintain | Outperform | 2025-07-30 |
Grades show a stable outlook with multiple maintains at Outperform and Buy. Piper Sandler’s recent upgrade from Underweight to Neutral suggests cautious optimism among some analysts.
Consumer Opinions
Ameriprise Financial draws mixed consumer sentiment, reflecting its complex role in wealth management.
| Positive Reviews | Negative Reviews |
|---|---|
| Personalized financial advice builds trust. | High fees reduce overall value for clients. |
| Responsive customer service improves experience. | Occasional delays in account updates frustrate users. |
| Comprehensive retirement planning options. | Digital platform can be unintuitive and clunky. |
Consumers consistently praise Ameriprise for tailored advice and strong client relationships. However, recurring complaints about fees and technology glitches suggest areas needing strategic improvement.
Risk Analysis
Below is a summary table of key risks facing Ameriprise Financial, Inc., highlighting their likelihood and potential impact:
| Category | Description | Probability | Impact |
|---|---|---|---|
| Financial Health | Altman Z-Score at 0.67 signals high bankruptcy risk, in the distress zone. | High | Severe |
| Valuation | Price-to-Book ratio of 7.1 is very unfavorable, indicating possible overvaluation risk. | Medium | Moderate |
| Profitability | ROIC at 2.14% is below WACC 8.97%, signaling poor capital efficiency and value destruction. | High | Significant |
| Liquidity | Current ratio is 7.87 but flagged unfavorable due to distortion by non-operating assets. | Medium | Moderate |
| Debt Management | Debt-to-Equity score is unfavorable, raising concerns on leverage management. | Medium | Moderate |
| Market Volatility | Beta of 1.25 implies above-average sensitivity to market swings. | High | Moderate |
The most alarming risk is the distressed Altman Z-Score, which historically signals a high probability of financial distress. Poor ROIC below WACC confirms Ameriprise struggles to generate returns above its cost of capital, eroding shareholder value. Combined with overvaluation signals and moderate leverage concerns, these risks warrant cautious allocation despite favorable profitability metrics.
Should You Buy Ameriprise Financial, Inc.?
Ameriprise appears to be navigating a challenging profitability and value creation environment, with declining ROIC and a very unfavorable moat. While its leverage profile shows some risks, the overall B+ rating suggests moderate operational efficiency but warrants cautious analytical interpretation.
Strength & Efficiency Pillars
Ameriprise Financial, Inc. delivers solid operational margins with a gross margin of 54.04% and an EBIT margin of 26.95%. The net margin stands at a strong 18.86%, while return on equity impresses at 54.41%, signaling effective shareholder value generation. However, the return on invested capital (ROIC) at 2.14% falls below the weighted average cost of capital (WACC) of 8.97%, indicating the company is currently shedding value rather than creating it. Operational profitability remains a key strength despite this value erosion.
Weaknesses and Drawbacks
The company is in financial distress, with an Altman Z-Score of 0.67, well below the safe threshold, signaling heightened bankruptcy risk. This solvency red flag outweighs favorable margins. Valuation metrics are mixed: a reasonable P/E of 13.05 contrasts sharply with a high P/B ratio of 7.1, suggesting the stock trades at a premium relative to book value. The current ratio is elevated at 7.87, which, while superficially signaling liquidity, may indicate inefficient asset use. Overall, these factors raise concerns over balance sheet strength and market pricing.
Our Final Verdict about Ameriprise Financial, Inc.
Despite robust profitability, Ameriprise’s distress-level Altman Z-Score of 0.67 flags serious solvency risks. This financial fragility makes the investment profile highly speculative and too risky for conservative capital. Operational strengths cannot offset the looming bankruptcy potential. Caution is paramount until the company’s financial health shows clear improvement.
Disclaimer: This content is for informational purposes only and does not constitute financial, investment, or other professional advice. Investing in financial markets involves a significant risk of loss, and past performance is not indicative of future results.
Additional Resources
- Are Investors Undervaluing Ameriprise Financial (AMP) Right Now? – Yahoo Finance (Feb 20, 2026)
- Ameriprise Financial, Inc. $AMP Shares Purchased by NEOS Investment Management LLC – MarketBeat (Feb 19, 2026)
- Decoding Ameriprise Financial Inc (AMP): A Strategic SWOT Insigh – GuruFocus (Feb 20, 2026)
- HighTower Advisors LLC Increases Position in Ameriprise Financial, Inc. $AMP – MarketBeat (Feb 19, 2026)
- RBC Capital Raises its Price Target on Ameriprise Financial, Inc. (AMP) to $605 and Reiterates an Outperform Rating – Yahoo Finance (Feb 09, 2026)
For more information about Ameriprise Financial, Inc., please visit the official website: ameriprise.com