Home > Analyses > Utilities > American Water Works Company, Inc.
American Water Works Company, Inc. delivers a vital resource that powers daily life for millions across 24 states. As the largest publicly traded water and wastewater utility in the U.S., it commands a vast network of treatment plants and pipelines, blending legacy infrastructure with modern innovation. Its reputation for reliability and regulatory expertise sets it apart in a highly regulated sector. The key question: does American Water’s solid foundation still justify its current valuation and growth prospects in 2026?

Table of contents
Business Model & Company Overview
American Water Works Company, Inc., founded in 1886 and headquartered in Camden, NJ, stands as a dominant player in the regulated water sector. It operates a vast ecosystem of water and wastewater services, reaching 3.4M active customers across 1,700 communities in 14 states. Its infrastructure includes 80 surface water plants, 480 groundwater plants, and 52.5K miles of mains, creating a resilient network essential for public health and industry alike.
The company’s revenue engine balances regulated water delivery with wastewater treatment, serving residential, commercial, industrial, and municipal customers. Its footprint spans 24 states, providing services to 14M people. This broad geographic reach and essential service create a formidable economic moat, underpinning its role as a cornerstone in America’s water utilities landscape.
Financial Performance & Fundamental Metrics
I analyze American Water Works Company, Inc.’s income statement, key financial ratios, and dividend payout policy to assess its core financial health and shareholder value.
Income Statement
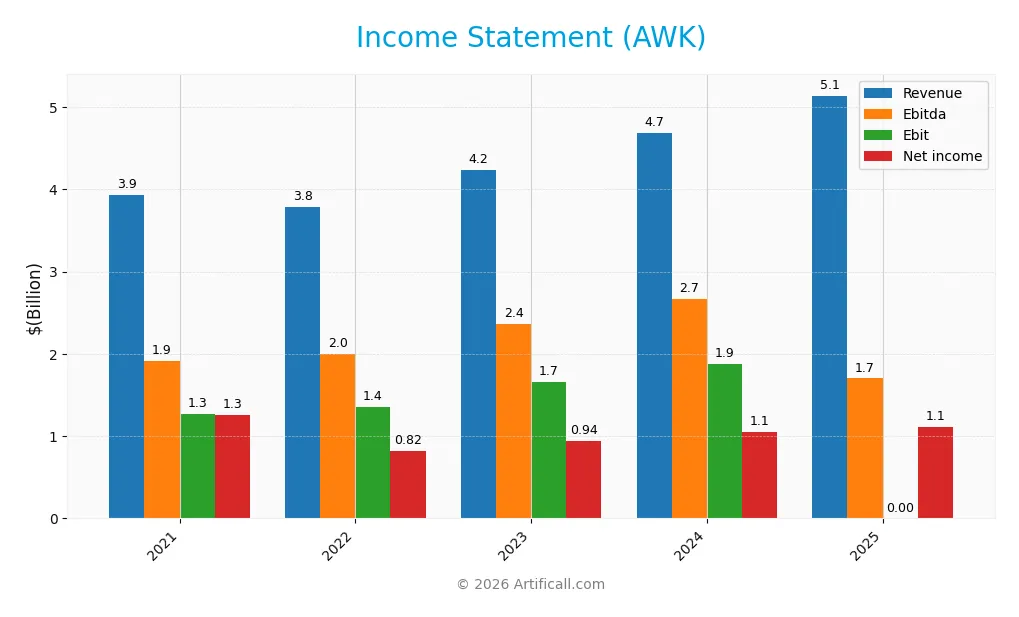
This table summarizes American Water Works Company, Inc.’s key income statement figures for fiscal years 2021 through 2025, highlighting revenue, expenses, and profitability metrics.
| 2021 | 2022 | 2023 | 2024 | 2025 | |
|---|---|---|---|---|---|
| Revenue | 3.93B | 3.79B | 4.23B | 4.68B | 5.14B |
| Cost of Revenue | 1.78B | 1.59B | 1.72B | 1.86B | 2.02B |
| Operating Expenses | 957M | 930M | 1.01B | 1.11B | 3.26B |
| Gross Profit | 2.15B | 2.20B | 2.51B | 2.83B | 3.12B |
| EBITDA | 1.91B | 1.99B | 2.36B | 2.67B | 1.70B |
| EBIT | 1.27B | 1.35B | 1.66B | 1.88B | 0 |
| Interest Expense | 403M | 433M | 460M | 523M | 615M |
| Net Income | 1.26B | 820M | 944M | 1.05B | 1.11B |
| EPS | 6.94 | 4.51 | 4.89 | 5.39 | 5.70 |
| Filing Date | 2022-02-16 | 2023-02-15 | 2024-02-14 | 2025-02-19 | 2026-02-18 |
Income Statement Evolution
American Water Works Company, Inc. posted a 31% revenue increase from 2021 to 2025, with a 9.7% jump between 2024 and 2025. Despite strong top-line growth, net income declined 12% over the period. Gross margins improved favorably to 60.7%, but net margins contracted by 33%, indicating rising costs pressured profitability despite revenue gains.
Is the Income Statement Favorable?
In 2025, AWK generated $5.14B in revenue with a 21.6% net margin, reflecting solid operational performance. However, EBIT was zero, signaling unusual or non-recurring impacts. Interest expense remained favorable at roughly 12% of revenue. Overall, half of the income statement metrics were positive, half negative, resulting in a neutral fundamental stance on profitability stability.
Financial Ratios
The table below summarizes key financial ratios for American Water Works Company, Inc. over the past five fiscal years:
| Ratios | 2021 | 2022 | 2023 | 2024 | 2025 |
|---|---|---|---|---|---|
| Net Margin | 32% | 22% | 22% | 22% | 22% |
| ROE | 17% | 11% | 10% | 10% | 10% |
| ROIC | 4% | 4% | 4% | 4% | -87% |
| P/E | 27.2 | 33.8 | 27.0 | 23.1 | 22.9 |
| P/B | 4.71 | 3.61 | 2.60 | 2.35 | 2.35 |
| Current Ratio | 0.73 | 0.44 | 0.65 | 0.39 | 0 |
| Quick Ratio | 0.70 | 0.41 | 0.59 | 0.35 | 0 |
| D/E | 1.52 | 1.62 | 1.27 | 1.37 | 1.47 |
| Debt-to-Assets | 42% | 45% | 41% | 43% | 0% |
| Interest Coverage | 3.0 | 2.9 | 3.3 | 3.3 | -3.1 |
| Asset Turnover | 0.15 | 0.14 | 0.14 | 0.14 | 0 |
| Fixed Asset Turnover | 0.19 | 0.16 | 0.17 | 0.17 | 0 |
| Dividend Yield | 1.25% | 1.68% | 2.09% | 2.41% | 2.49% |
Evolution of Financial Ratios
Return on Equity (ROE) remained stable around 10% in recent years, indicating steady shareholder returns. The Current Ratio deteriorated to 0 in 2025, showing weakening liquidity. Debt-to-Equity Ratio increased to 1.47, reflecting higher leverage. Profitability margins, including net margin near 21.6%, showed minor fluctuations but generally held firm over the period.
Are the Financial Ratios Fovorable?
In 2025, profitability ratios like net margin and dividend yield appear favorable, supporting income stability. However, liquidity ratios are unfavorable, with a zero current and quick ratio. Leverage is elevated, marked by a high debt-to-equity ratio and negative interest coverage. Market valuation ratios, including P/E and P/B, are neutral. Overall, the financial ratios lean slightly unfavorable given liquidity and leverage concerns.
Shareholder Return Policy
American Water Works pays dividends with a payout ratio near 57%, yielding about 2.5% annually. Dividend per share has steadily increased, supported by consistent earnings. The company also conducts share buybacks, enhancing overall shareholder returns despite negative free cash flow coverage.
This distribution strategy balances steady income with capital returns, though negative free cash flow coverage signals caution. The approach appears aimed at sustainable long-term value, yet investors should monitor cash flow adequacy to ensure ongoing distribution viability.
Score analysis
The radar chart below illustrates American Water Works Company, Inc.’s key financial scores across valuation, profitability, and leverage metrics:
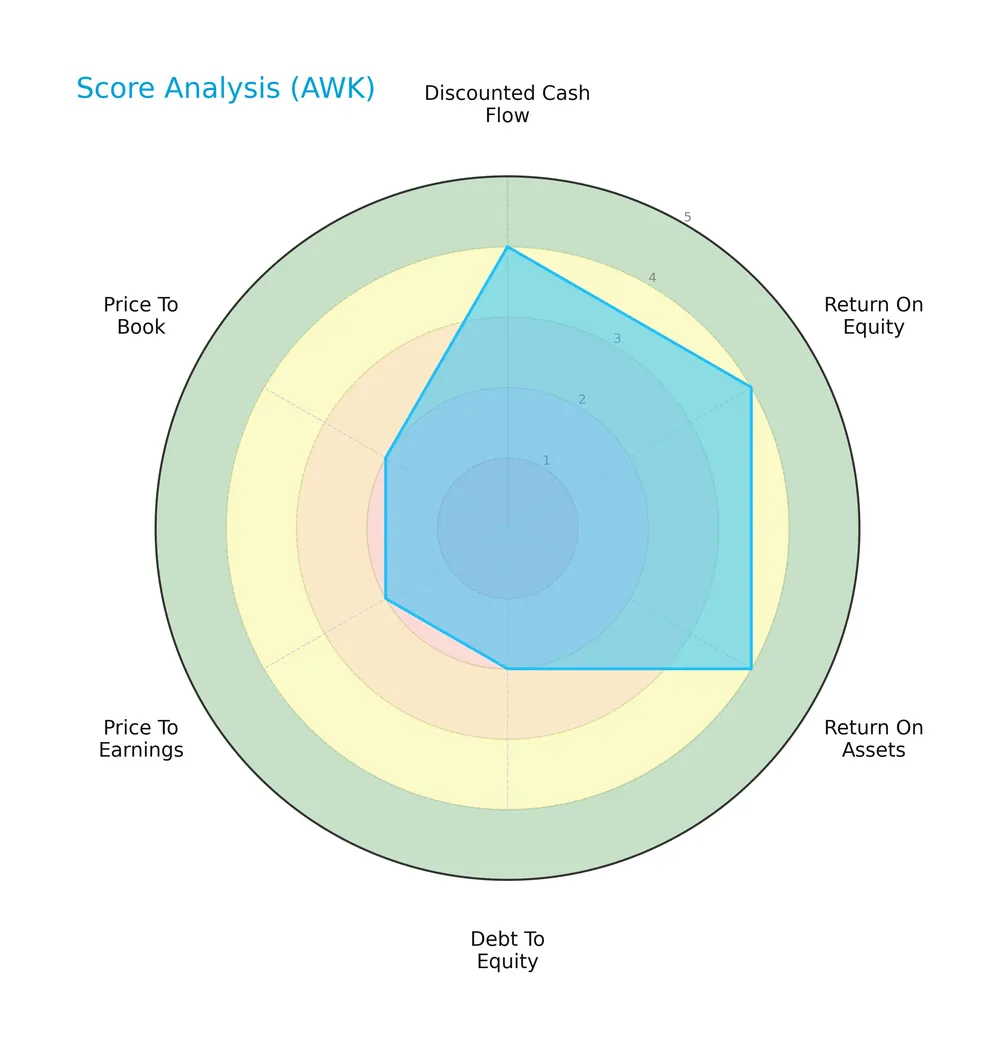
The company scores favorably on discounted cash flow, return on equity, and return on assets, each rated 4. However, debt to equity, price to earnings, and price to book scores are weaker at 2, indicating some valuation and leverage concerns.
Is the company in good financial health?
The Piotroski diagram assesses American Water Works Company, Inc.’s financial strength based on nine key criteria:

With a Piotroski Score of 5, the company falls into an average health category, reflecting moderate financial stability but room for improvement in profitability, leverage, or efficiency factors.
Competitive Landscape & Sector Positioning
This section examines American Water Works Company, Inc.’s strategic positioning within the regulated water industry. We will analyze its revenue by segment, key products, and main competitors. I will assess whether the company holds a competitive advantage over its peers.
Strategic Positioning
American Water Works concentrates primarily on regulated water and wastewater services, generating over $4.7B in 2025 from this core segment. It serves approximately 3.4M customers across 14 states, focusing on the U.S. market without significant geographic diversification beyond key states like Illinois and Missouri.
Revenue by Segment
This pie chart illustrates American Water Works Company, Inc.’s revenue breakdown by segment, focusing on fiscal year 2025 and historical data from 2013 to 2025.
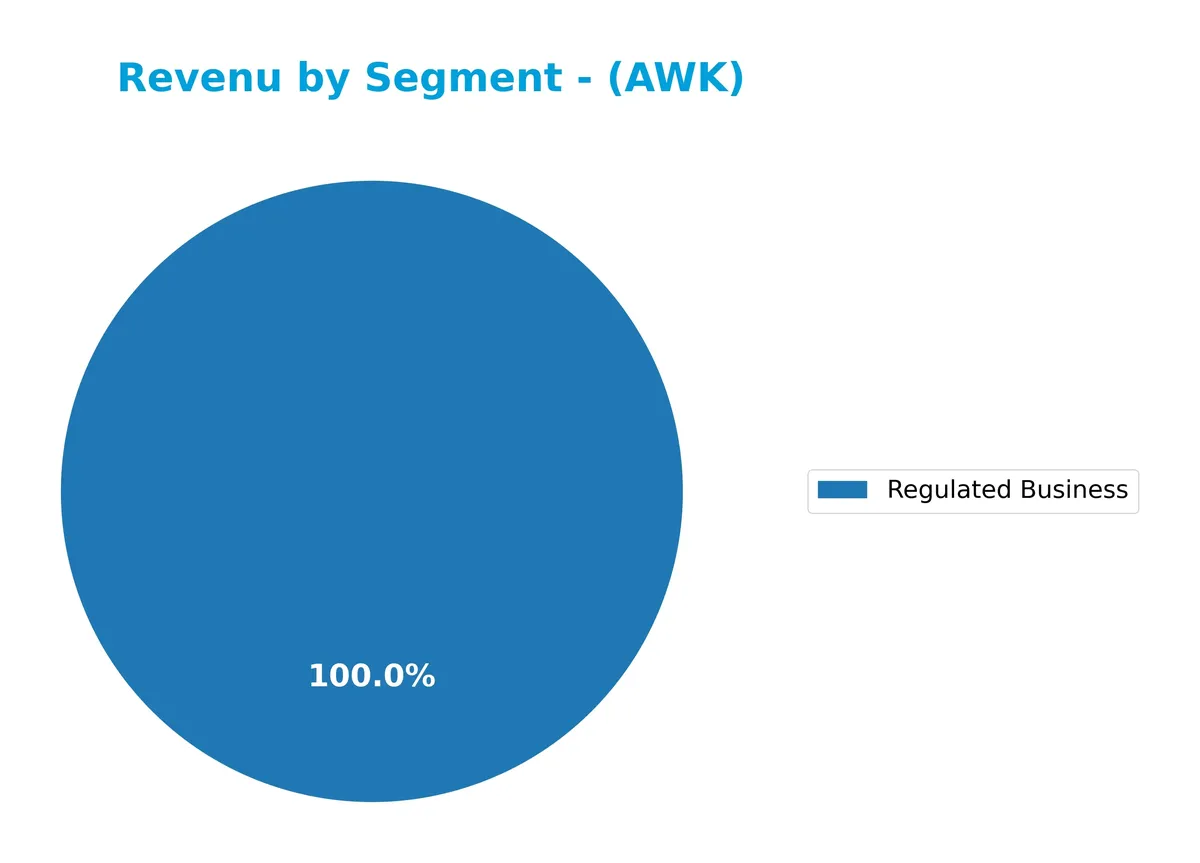
The regulated business consistently dominates revenue, reaching $4.7B in 2025, reflecting steady growth since 2013. Market based businesses show volatility, peaking near $563M in 2021 but absent in 2025 data, indicating possible segment reclassification or contraction. The 2025 figure suggests increased concentration risk, with reliance heavily skewed toward regulated operations driving the company’s financial stability.
Key Products & Brands
The table below outlines American Water Works Company’s main products and services:
| Product | Description |
|---|---|
| Regulated Business | Provides water and wastewater services to residential, commercial, industrial, and public sectors. Serves approximately 3.4M customers in 14 states. Includes operation of treatment plants, pumping stations, and related infrastructure. |
| Market Based Businesses | Offers water and wastewater services under market-driven contracts, including municipal facility management and other specialized water solutions. |
American Water Works focuses primarily on regulated water and wastewater services, delivering essential utilities to a broad customer base. Market based activities complement the core regulated operations, contributing a smaller portion of revenue.
Main Competitors
American Water Works Company, Inc. faces competition from 34 firms in the sector, with the table below listing the top 10 leaders by market capitalization:
| Competitor | Market Cap. |
|---|---|
| GE Vernova Inc. | 184B |
| NextEra Energy, Inc. | 169B |
| Constellation Energy Corporation | 114B |
| The Southern Company | 96B |
| Duke Energy Corporation | 91B |
| American Electric Power Company, Inc. | 62B |
| Sempra | 59B |
| Vistra Corp. | 56B |
| Dominion Energy, Inc. | 51B |
| Exelon Corporation | 44B |
American Water Works ranks 23rd among 34 competitors. Its market cap is roughly 14% of the leader’s scale, reflecting a smaller footprint. The company sits below both the $92.6B average of the top 10 and the $29.6B median in the sector. It is narrowly 1.44% behind its next closest rival, indicating a tight competitive gap just above it.
Comparisons with competitors
Check out how we compare the company to its competitors:
Does AWK have a competitive advantage?
American Water Works Company, Inc. does not present a competitive advantage as it is currently destroying value with a very unfavorable moat rating and declining ROIC. The company’s ROIC is significantly below its WACC, indicating inefficient use of invested capital and value erosion.
Looking forward, AWK operates in regulated water markets across 24 states, serving diverse customer segments and managing extensive infrastructure. Future opportunities could arise from expanding services or improving operational efficiency, but current financial metrics highlight challenges in sustaining profitability.
SWOT Analysis
This SWOT analysis highlights American Water Works Company, Inc.’s key factors shaping its strategic positioning and future prospects.
Strengths
- Strong net margin at 21.6%
- Large customer base serving 3.4M customers
- Regulated utility with stable cash flow
Weaknesses
- Negative ROIC indicates value destruction
- High debt-to-equity ratio at 1.47
- Unfavorable liquidity ratios (current and quick ratio at 0)
Opportunities
- Expanding water infrastructure needs
- Growing revenue with 9.7% annual growth
- Potential for operational efficiency improvements
Threats
- Regulatory changes impacting rates
- Rising operational costs eroding margins
- Competition from alternative water solutions
American Water’s core strength lies in stable cash flows from a regulated monopoly and solid net margins. However, value destruction and leverage pose serious risks. Strategic focus must balance growth investments and debt management to safeguard long-term shareholder value.
Stock Price Action Analysis
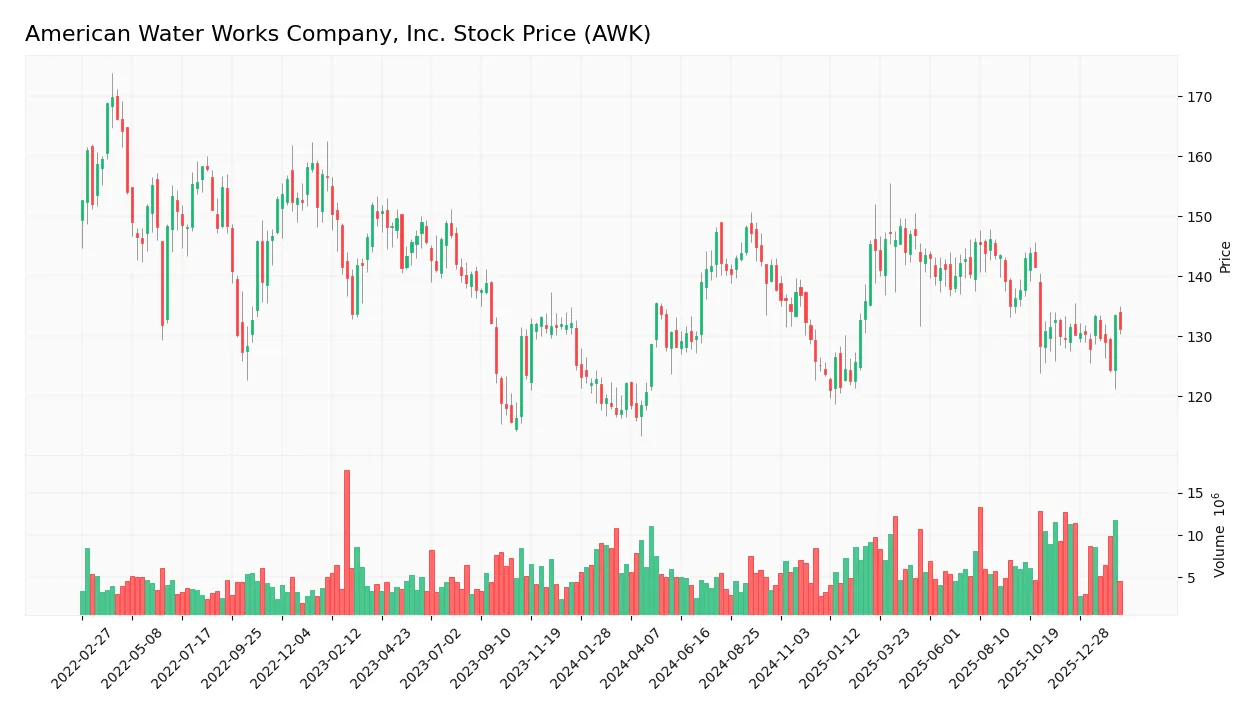
The following weekly chart illustrates American Water Works Company, Inc.’s stock price movements and key levels over the past 100 weeks:
Trend Analysis
Over the past 100 weeks, AWK’s price rose 7.32%, indicating a bullish trend with deceleration in momentum. The stock peaked at 148.4 and bottomed at 116.57. Recent weeks show a smaller 1.28% increase with a slight negative slope, suggesting a neutral near-term trend despite overall bullishness.
Volume Analysis
Trading volume has increased overall, with sellers dominating 52% of activity across the full period. In the recent 12 weeks, seller dominance intensified to 64%, indicating selling pressure. This suggests cautious investor sentiment and potential profit-taking amid recent price flattening.
Target Prices
Analysts set a clear target consensus for American Water Works Company, Inc., signaling moderate upside potential.
| Target Low | Target High | Consensus |
|---|---|---|
| 122 | 149 | 139.5 |
The target range reflects confidence in AWK’s steady growth, with an average expectation of 139.5, indicating favorable market sentiment.

Don’t Let Luck Decide Your Entry Point
Optimize your entry points with our advanced ProRealTime indicators. You’ll get efficient buy signals with precise price targets for maximum performance. Start outperforming now!
Analyst & Consumer Opinions
This section examines analyst ratings alongside consumer feedback to provide a comprehensive view of American Water Works Company, Inc. (AWK).
Stock Grades
Here are the latest verified stock grades for American Water Works Company, Inc. from recognized financial institutions:
| Grading Company | Action | New Grade | Date |
|---|---|---|---|
| Wells Fargo | Maintain | Equal Weight | 2026-01-20 |
| B of A Securities | Upgrade | Neutral | 2026-01-12 |
| Barclays | Maintain | Underweight | 2025-12-17 |
| Jefferies | Upgrade | Hold | 2025-11-05 |
| Barclays | Maintain | Underweight | 2025-10-21 |
| Argus Research | Maintain | Buy | 2025-08-14 |
| UBS | Maintain | Neutral | 2025-08-12 |
| Mizuho | Maintain | Neutral | 2025-08-01 |
| Wells Fargo | Maintain | Equal Weight | 2025-08-01 |
| UBS | Maintain | Neutral | 2025-07-11 |
Most firms maintain a neutral or cautious stance, with a few upgrades from underperform to hold or neutral. The consensus leans toward holding, reflecting moderate investor confidence.
Consumer Opinions
American Water Works Company, Inc. evokes mixed yet insightful reactions from its customer base, reflecting real-world service experiences.
| Positive Reviews | Negative Reviews |
|---|---|
| Reliable water supply with minimal outages. | Customer service response times can lag. |
| Consistent water quality meeting safety standards. | Billing system occasionally causes confusion. |
| Transparent communication during maintenance. | Limited online account management features. |
Overall, consumers praise American Water Works for dependable water quality and clear communication. However, they frequently cite slow customer support and billing issues as areas needing improvement.
Risk Analysis
Below is a summary of key risks facing American Water Works Company, Inc., highlighting their probability and potential impact:
| Category | Description | Probability | Impact |
|---|---|---|---|
| Financial Health | Negative ROIC (-87%) despite favorable WACC (5.63%) signals poor capital efficiency. | High | High |
| Liquidity | Current and quick ratios at 0 indicate severe short-term liquidity concerns. | High | High |
| Leverage | Debt-to-equity ratio of 1.47 suggests elevated financial risk and potential solvency pressure. | Medium | Medium |
| Interest Coverage | Negative interest coverage ratio highlights difficulty in servicing debt costs. | Medium | High |
| Market Valuation | Neutral P/E (22.91) and P/B (2.35) ratios imply fair valuation but limited upside. | Medium | Medium |
| Dividend Risk | Dividend yield at 2.49% is favorable but depends on stable cash flows and earnings. | Low | Medium |
The most critical risks stem from liquidity strain and poor capital returns, which historically in utilities can precede financial distress if not addressed. Recent unfavorable metrics warn investors to monitor debt servicing ability closely.
Should You Buy American Water Works Company, Inc.?
American Water Works appears to be a company with moderate profitability but a deteriorating competitive moat, reflecting declining value creation. While its leverage profile raises concerns, the overall B+ rating suggests a cautiously favorable investment profile amid operational challenges.
Strength & Efficiency Pillars
American Water Works Company, Inc. posts a solid net margin of 21.61%, showcasing operational profitability despite headwinds. Its return on equity stands at a modest 10.25%, reflecting moderate shareholder returns. However, the company destroys value with a ROIC of -87.38%, far below its WACC of 5.63%, indicating inefficiency in capital allocation. While margins remain a bright spot, the firm’s negative ROIC signals challenges in generating economic profit.
Weaknesses and Drawbacks
The absence of an Altman Z-Score prevents a full solvency assessment, but key leverage and liquidity metrics raise concerns. The debt-to-equity ratio at 1.47 signals heavy reliance on debt financing, increasing financial risk. Both current and quick ratios are zero, a red flag for liquidity management. Valuation metrics are neutral but lean toward caution, with a P/E of 22.91 and P/B of 2.35. Recent seller dominance (64.21% of volume) suggests short-term market pressure.
Our Final Verdict about American Water Works Company, Inc.
Without a definitive solvency score, caution is warranted. Despite a bullish long-term trend, the company’s value destruction and liquidity weaknesses temper enthusiasm. Recent seller dominance advises a wait-and-see approach for a better entry point. The investment case might appear attractive on operational margins but remains clouded by financial inefficiencies and market pressure.
Disclaimer: This content is for informational purposes only and does not constitute financial, investment, or other professional advice. Investing in financial markets involves a significant risk of loss, and past performance is not indicative of future results.
Additional Resources
- American Water Works (AWK) Q4 Earnings Lag Estimates – Yahoo Finance (Feb 18, 2026)
- AMERICAN WATER WORKS ($AWK) Releases Q4 2025 Earnings – Quiver Quantitative (Feb 18, 2026)
- AMERICAN WATER REPORTS STRONG 2025 RESULTS; AFFIRMS 2026 EPS GUIDANCE AND LONG-TERM TARGETS – PR Newswire (Feb 18, 2026)
- Decoding American Water Works Co Inc (AWK): A Strategic SWOT Ins – GuruFocus (Feb 19, 2026)
- American Water Works misses quarterly results estimates on higher expenses – marketscreener.com (Feb 18, 2026)
For more information about American Water Works Company, Inc., please visit the official website: amwater.com