Home > Analyses > Real Estate > American Tower Corporation
American Tower Corporation powers the invisible networks that connect millions daily. As a dominant global REIT specializing in communications real estate, it owns and operates roughly 219,000 sites. The company’s leadership in multi-tenant tower infrastructure drives innovation and reliable connectivity worldwide. Yet, with evolving technology and competitive pressures, I ask: do American Tower’s fundamentals still justify its premium valuation and future growth prospects?
Table of contents
Business Model & Company Overview
American Tower Corporation, founded in 1998 and headquartered in Boston, MA, stands as one of the largest global REITs. It dominates the specialty real estate sector through a vast ecosystem of approximately 219,000 communications sites. This portfolio forms the backbone of its core mission: enabling seamless wireless connectivity worldwide. The company’s scale and independence fuel its leadership in multitenant communications real estate.
American Tower’s revenue engine balances long-term leases with wireless carriers across the Americas, Europe, and Asia. Its recurring service model, anchored in infrastructure ownership, generates stable cash flows. This global footprint and diversified tenant base build a robust economic moat, positioning American Tower as a critical enabler of the telecommunications industry’s future.
Financial Performance & Fundamental Metrics
I analyze American Tower Corporation’s income statement, key financial ratios, and dividend payout policy to assess its operational efficiency and shareholder returns.
Income Statement
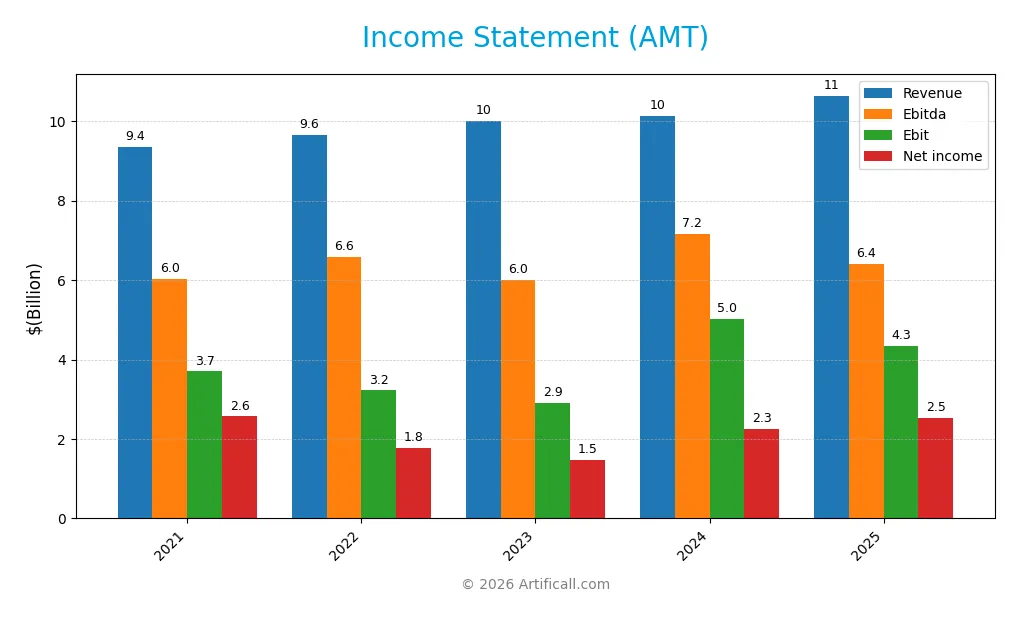
The table below summarizes American Tower Corporation’s key income statement items for fiscal years 2021 through 2025, providing a clear view of its financial performance.
| 2021 | 2022 | 2023 | 2024 | 2025 | |
|---|---|---|---|---|---|
| Revenue | 9.36B | 9.65B | 10.01B | 10.13B | 10.65B |
| Cost of Revenue | 2.68B | 2.57B | 2.56B | 2.57B | 2.80B |
| Operating Expenses | 3.54B | 4.34B | 4.33B | 3.04B | 2.96B |
| Gross Profit | 6.67B | 7.08B | 7.45B | 7.55B | 7.84B |
| EBITDA | 6.03B | 6.58B | 6.00B | 7.15B | 6.41B |
| EBIT | 3.70B | 3.22B | 2.92B | 5.03B | 4.35B |
| Interest Expense | 871M | 1.14B | 1.39B | 1.40B | 1.02B |
| Net Income | 2.57B | 1.77B | 1.48B | 2.25B | 2.53B |
| EPS | 5.69 | 3.83 | 3.18 | 4.83 | 5.40 |
| Filing Date | 2022-02-25 | 2023-02-23 | 2024-02-27 | 2025-02-25 | 2026-02-24 |
Income Statement Evolution
American Tower Corporation’s revenue grew 13.8% from 2021 to 2025, with a modest 5.1% increase in 2025 alone. Gross margin remained stable near 74%, reflecting consistent product profitability. However, net income declined slightly over the period by 1.5%, despite a 6.7% margin expansion in the latest year, signaling improved bottom-line efficiency despite slower earnings growth.
Is the Income Statement Favorable?
In 2025, AMT posted $10.6B revenue and $2.53B net income, yielding a 23.8% net margin, which is favorable compared to sector averages. EBIT margin at 40.9% remains strong, though EBIT declined 13.5% year-on-year. Interest expense accounts for 9.6% of revenue, a neutral factor. Overall, fundamentals show solid operating profitability and margin improvement, underpinning a generally favorable income statement.
Financial Ratios
The table below presents key financial ratios for American Tower Corporation (AMT) from 2021 to 2025, highlighting profitability, leverage, liquidity, and valuation metrics:
| Ratios | 2021 | 2022 | 2023 | 2024 | 2025 |
|---|---|---|---|---|---|
| Net Margin | 27% | 18% | 15% | 22% | 0% |
| ROE | 51% | 32% | 35% | 67% | 0% |
| ROIC | 4.3% | 4.0% | 4.7% | 7.0% | 0% |
| P/E | 51.4 | 55.4 | 67.8 | 38.0 | 0 |
| P/B | 26.0 | 17.5 | 24.0 | 25.3 | 0 |
| Current Ratio | 0.41 | 0.44 | 0.51 | 0.45 | 0.40 |
| Quick Ratio | 0.41 | 0.44 | 0.51 | 0.45 | 0.40 |
| D/E | 10.2 | 8.4 | 11.0 | 13.0 | 12.3 |
| Debt-to-Assets | 74% | 70% | 70% | 72% | 77% |
| Interest Coverage | 3.6 | 2.4 | 2.3 | 3.2 | 0 |
| Asset Turnover | 0.13 | 0.14 | 0.15 | 0.17 | 0 |
| Fixed Asset Turnover | 0.32 | 0.33 | 0.51 | 0.37 | 0 |
| Dividend Yield | 1.7% | 2.7% | 2.9% | 3.6% | 0% |
Evolution of Financial Ratios
Over the period, the Current Ratio declined from 0.51 in 2023 to 0.40 in 2025, indicating weakening liquidity. The Debt-to-Equity Ratio rose sharply to 12.31 in 2025, reflecting increased leverage. Return on Equity (ROE) dropped to zero in 2025, signaling a loss of profitability compared to previous years’ positive but fluctuating returns.
Are the Financial Ratios Favorable?
The 2025 ratios reveal unfavorable profitability, liquidity, and leverage metrics, with ROE and net margin both at zero and a high debt-to-assets ratio near 77%. Interest coverage stands neutral at 4.27, suggesting moderate ability to meet interest obligations. Despite some favorable market valuation indicators, the overall financial health appears unfavorable based on the majority of key ratios.
Shareholder Return Policy
American Tower Corporation maintains a consistent dividend policy, with dividend yields around 2.7% to 3.6% over recent years and payout ratios exceeding 100%, suggesting distributions sometimes surpass net income. The company has no reported share buyback programs.
The dividend coverage by free cash flow remains above 60%, yet high leverage and low liquidity ratios warrant caution. This dividend approach reflects a commitment to shareholder returns but carries risks related to sustainability amid financial leverage.
Score analysis
The following radar chart highlights key financial scores for American Tower Corporation:
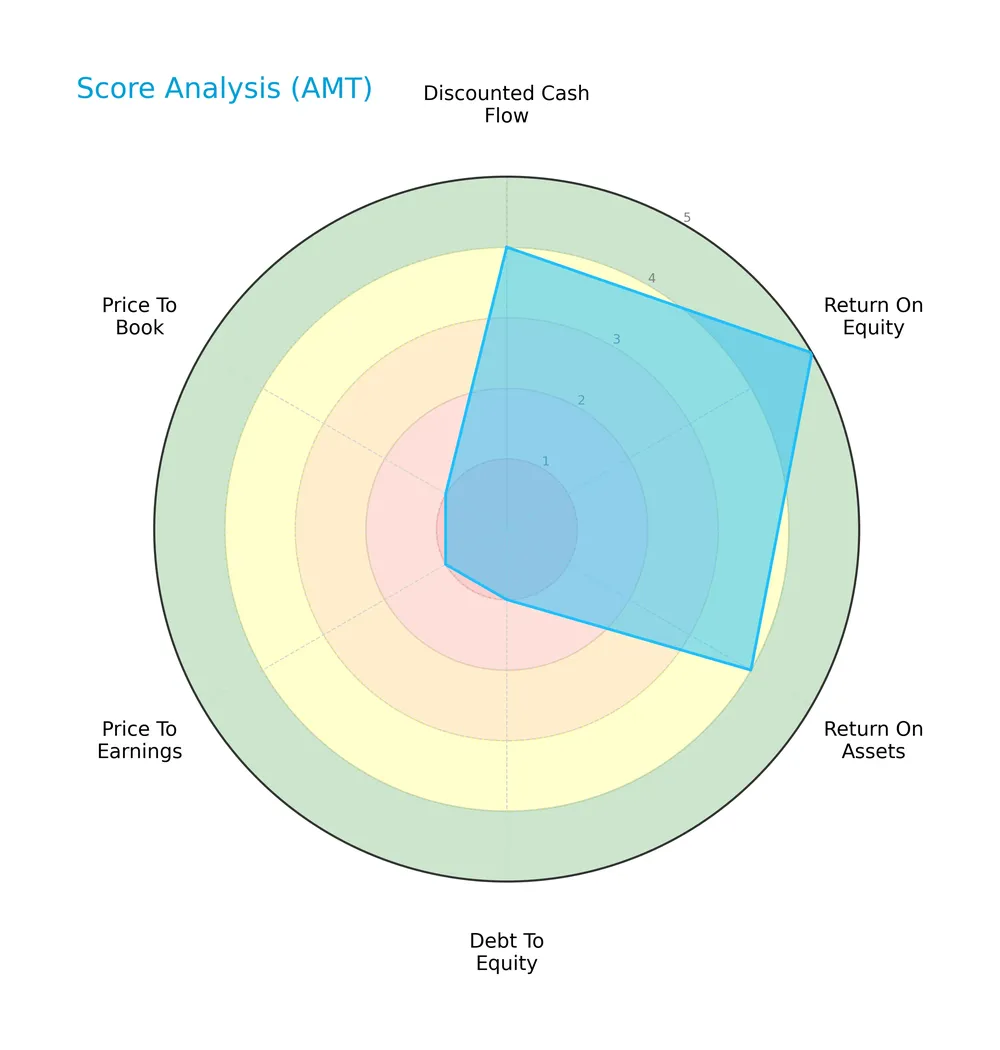
American Tower scores favorably on discounted cash flow (4) and return on assets (4). Its return on equity is very favorable at 5. However, debt-to-equity, price-to-earnings, and price-to-book ratios score very unfavorably at 1, signaling valuation and leverage concerns.
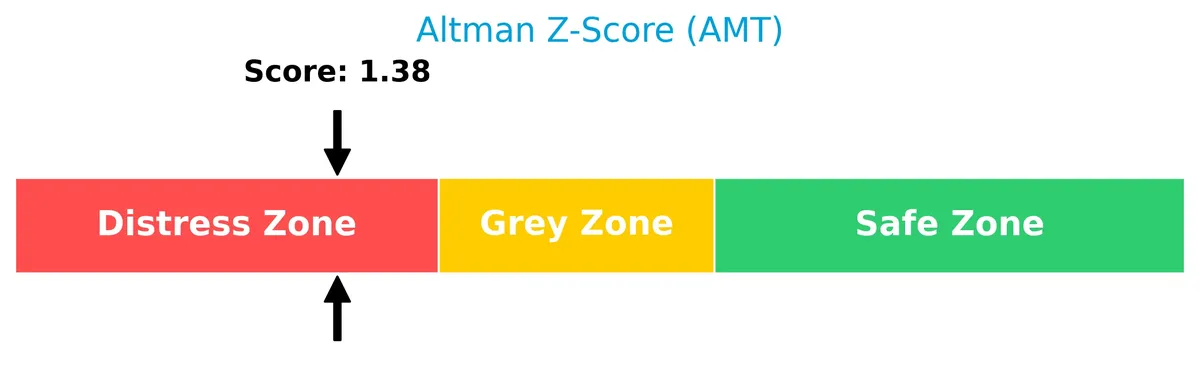
Analysis of the company’s bankruptcy risk
The Altman Z-Score places American Tower in the distress zone, indicating a heightened risk of financial distress and potential bankruptcy:
Is the company in good financial health?
This Piotroski diagram illustrates American Tower’s financial strength based on nine key criteria:

With a Piotroski score of 5, American Tower shows average financial health. While not weak, it lacks the robustness typical of stronger investment candidates.
Competitive Landscape & Sector Positioning
This section analyzes American Tower Corporation’s strategic positioning, revenue segments, and key products within the real estate sector. I will evaluate whether the company holds a competitive advantage compared to its main competitors.
Strategic Positioning
American Tower Corporation focuses primarily on property leasing within communications real estate, generating over $9.9B in property revenue in 2024. Its geographic exposure is diversified across the US ($5.4B), Latin America ($1.7B), Asia-Pacific, Europe, Africa, and data centers, reflecting a broad international footprint.
Revenue by Segment
This pie chart illustrates American Tower Corporation’s revenue breakdown by segment for fiscal year 2024, highlighting key business drivers and their relative contributions.
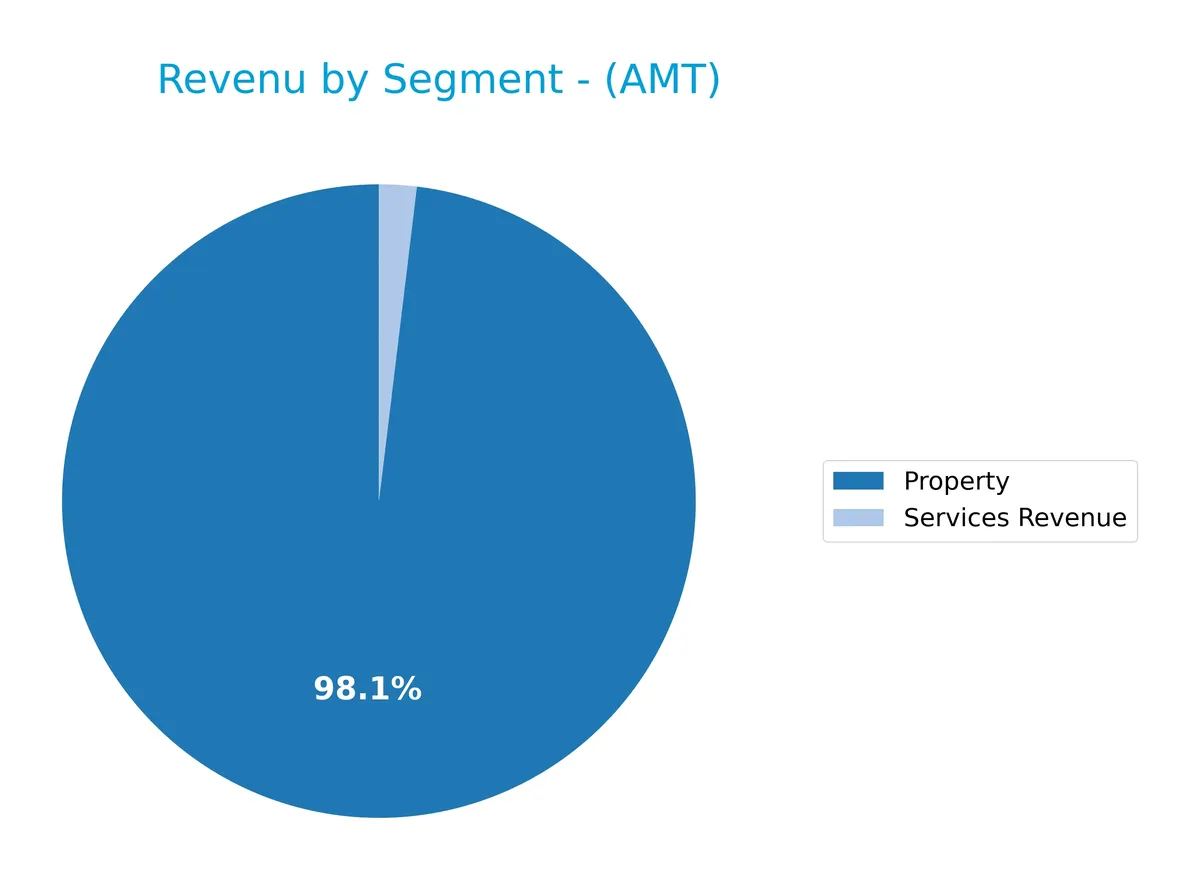
Property revenue dominates at $9.9B, reflecting stable core asset performance despite a slight decline from $11B in 2023. Services revenue, smaller at $194M, showed a rebound after prior volatility. Historically, Property drives AMT’s growth, but the recent slowdown signals potential concentration risks if diversification efforts lag. I observe that maintaining steady Property income remains critical amid evolving telecom infrastructure demands.
Key Products & Brands
American Tower Corporation’s revenue is primarily derived from property leasing and ancillary services, as shown below:
| Product | Description |
|---|---|
| Property | Leasing and management of approximately 219,000 communication sites worldwide. |
| Services Revenue | Network development and related services supporting property operations. |
American Tower’s core business centers on multitenant communications real estate. Property leasing dominates revenue, complemented by services that enhance network infrastructure. This dual stream supports stable cash flows typical in specialty REITs.
Main Competitors
American Tower Corporation operates in a sector with 6 competitors, with the table listing the top 6 leaders by market capitalization:
| Competitor | Market Cap. |
|---|---|
| American Tower Corporation | 81.8B |
| Equinix, Inc. | 74.5B |
| Crown Castle Inc. | 38.6B |
| Iron Mountain Incorporated | 24.6B |
| SBA Communications Corporation | 20.7B |
| Weyerhaeuser Company | 17.2B |
American Tower ranks 1st among its competitors with a market cap 9% above the next largest player. It stands significantly above both the average market cap of the top 10 (43B) and the sector median (31.6B). The company enjoys a clear lead, with no competitor above and a 20% gap to the closest rival below.
Comparisons with competitors
Check out how we compare the company to its competitors:
Does AMT have a competitive advantage?
American Tower Corporation does not currently present a competitive advantage, as its ROIC is below WACC by 6.36%, indicating value destruction and declining profitability over 2021-2025. This negative trend signals no excess capital for reinvestment and challenges in sustaining economic profits relative to peers.
Looking ahead, AMT’s extensive portfolio of approximately 219,000 communication sites across multiple regions, including the US, Latin America, and Asia-Pacific, offers opportunities to expand in data center properties and emerging markets. However, the company’s ability to translate these assets into improved returns remains uncertain given its profitability pressures.
SWOT Analysis
This analysis highlights American Tower Corporation’s key internal and external factors shaping its strategic outlook.
Strengths
- Leading global REIT with 219K communication sites
- Strong gross margin at 73.68%
- Favorable net margin growth of 6.73%
Weaknesses
- High debt-to-assets ratio at 76.91%
- Declining ROIC, destroying value
- Low liquidity ratios (0.4 current and quick ratios)
Opportunities
- Expanding data center property segment
- Growing international markets, especially Latin America
- Increasing demand for wireless infrastructure
Threats
- Intense competition in telecom real estate
- Regulatory risks across multiple countries
- Economic slowdown impacting tenant demand
American Tower’s robust asset base and margins support growth, but high leverage and declining capital efficiency raise caution. The company must leverage global expansion and technology trends while managing financial risks prudently.
Stock Price Action Analysis
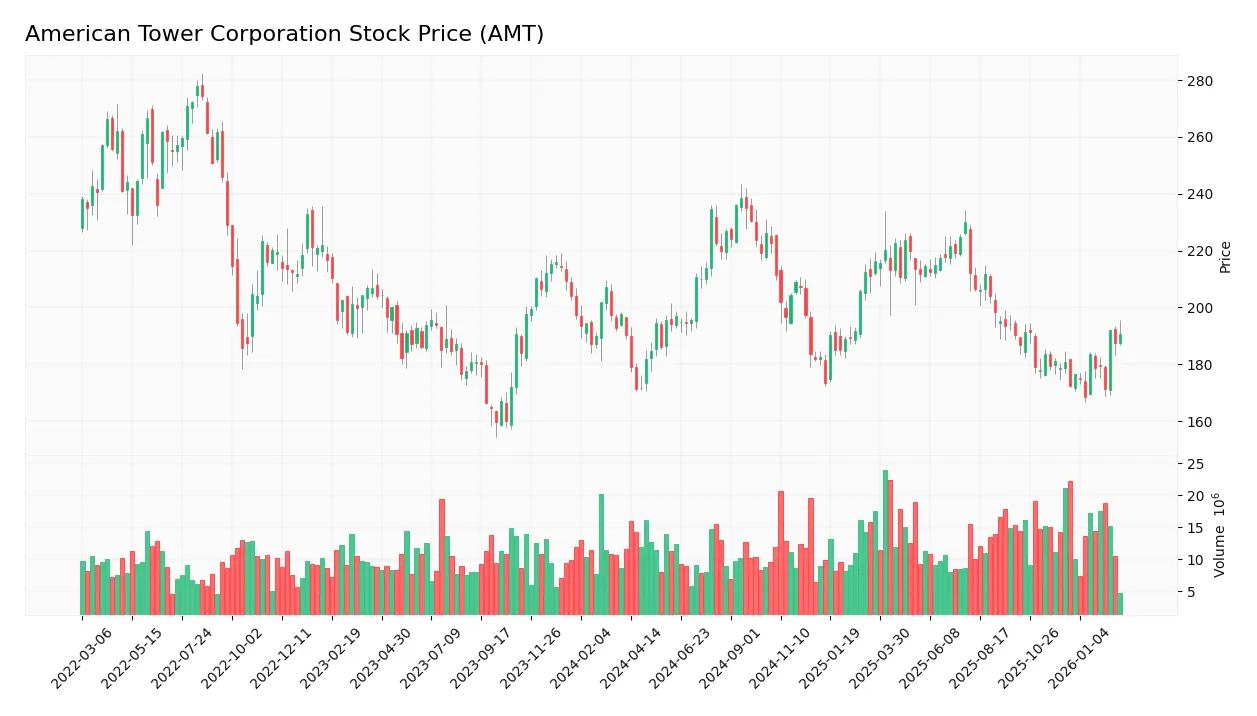
The following weekly chart illustrates American Tower Corporation’s stock price movements and volatility during the past year:
Trend Analysis
Over the past 12 months, the stock price increased by 0.22%, indicating a bullish trend with acceleration. The price ranged from a low of 168.51 to a high of 238.5. The standard deviation of 18.01 suggests notable volatility throughout the period.
Volume Analysis
Trading volume shows an increasing trend with total volume near 1.47B shares. Buyer activity accounts for 44.68%, indicating a seller-driven market overall. In the recent three months, buyer dominance is neutral at 49.7%, reflecting balanced investor sentiment and steady market participation.
Target Prices
Analysts show a confident target consensus for American Tower Corporation (AMT).
| Target Low | Target High | Consensus |
|---|---|---|
| 185 | 255 | 214.6 |
The target range between 185 and 255 reflects solid upside potential. The consensus at 214.6 suggests a moderate bullish outlook among analysts.

Don’t Let Luck Decide Your Entry Point
Optimize your entry points with our advanced ProRealTime indicators. You’ll get efficient buy signals with precise price targets for maximum performance. Start outperforming now!
Analyst & Consumer Opinions
This section examines the latest analyst grades and consumer feedback concerning American Tower Corporation’s market performance.
Stock Grades
Here are the latest verified analyst grades for American Tower Corporation, reflecting current market sentiment and rating trends:
| Grading Company | Action | New Grade | Date |
|---|---|---|---|
| UBS | Maintain | Buy | 2026-01-20 |
| Scotiabank | Maintain | Sector Outperform | 2026-01-14 |
| JP Morgan | Maintain | Overweight | 2026-01-12 |
| Mizuho | Maintain | Neutral | 2026-01-12 |
| BMO Capital | Downgrade | Market Perform | 2026-01-09 |
| RBC Capital | Maintain | Sector Perform | 2025-12-19 |
| Morgan Stanley | Maintain | Overweight | 2025-12-05 |
| Barclays | Downgrade | Equal Weight | 2025-12-01 |
| Barclays | Maintain | Overweight | 2025-11-17 |
| Wells Fargo | Maintain | Overweight | 2025-10-29 |
The consensus remains positive with a strong bias toward buying, though some recent downgrades suggest cautious sentiment shifts. Most analysts maintain overweight or outperform ratings, signaling confidence tempered by selective risk assessment.
Consumer Opinions
American Tower Corporation evokes strong reactions from its consumer base, reflecting its critical role in the telecom infrastructure space.
| Positive Reviews | Negative Reviews |
|---|---|
| Reliable network coverage enhances connectivity. | Customer service response times can lag. |
| Consistent uptime supports business operations. | Pricing for tower leasing feels high for smaller clients. |
| Strong commitment to infrastructure upgrades. | Some locations suffer from limited site availability. |
Overall, consumers praise American Tower for its reliability and infrastructure quality. However, pricing concerns and customer service delays surface as notable weaknesses.
Risk Analysis
Below is a summary of key risks facing American Tower Corporation, highlighting their likelihood and potential impact:
| Category | Description | Probability | Impact |
|---|---|---|---|
| Leverage Risk | Debt-to-equity ratio at 12.31 signals heavy reliance on debt | High | High |
| Liquidity Risk | Current ratio of 0.4 shows weak short-term financial buffer | High | Medium |
| Profitability | Zero net margin and ROE indicate earnings challenges | Medium | High |
| Bankruptcy Risk | Altman Z-Score at 1.38 places company in distress zone | Medium | Very High |
| Valuation Risk | Low price-to-earnings and price-to-book scores suggest undervaluation or market skepticism | Medium | Medium |
| Dividend Risk | Zero dividend yield raises concerns on shareholder returns | Medium | Medium |
| Interest Risk | Interest coverage ratio of 4.27 is adequate but not robust | Low | Medium |
Leverage and liquidity risks dominate due to the company’s 77% debt-to-assets ratio and a critically low current ratio. The Altman Z-Score confirms distress, raising bankruptcy concerns despite moderate profitability and decent interest coverage. Investors should weigh these financial vulnerabilities against the firm’s market position carefully.
Should You Buy American Tower Corporation?
American Tower Corporation appears to be a company with weakening profitability and a deteriorating competitive moat, as reflected by declining ROIC versus WACC. Despite a challenging leverage profile and liquidity concerns, the firm holds a moderate B rating, suggesting a mixed but cautiously watchful investment profile.
Strength & Efficiency Pillars
American Tower Corporation exhibits strong operational profitability with a gross margin of 73.68% and an EBIT margin of 40.85%. The net margin stands favorably at 23.76%, reflecting efficient cost management. Despite these operational strengths, the company shows no return on invested capital (ROIC) above its weighted average cost of capital (WACC) of 6.36%, signaling value destruction. Therefore, while operational margins are robust, American Tower currently fails to create economic value for shareholders.
Weaknesses and Drawbacks
The company is in financial distress, as indicated by an Altman Z-Score of 1.38, placing it in the Distress Zone and signaling a high bankruptcy risk. Leverage is alarmingly high, with a debt-to-equity ratio of 12.31 and debt constituting 76.91% of assets, undermining solvency. Liquidity ratios are critically weak, with a current ratio of 0.4, heightening short-term risk. Valuation metrics are also unfavorable, reflecting market skepticism toward the stock’s premium pricing amid these financial strains.
Our Final Verdict about American Tower Corporation
Despite operational strengths, American Tower’s profile is highly speculative due to its distressed financial health with a low Altman Z-Score of 1.38. This solvency risk overshadows profitability and growth potential, making the company too risky for conservative capital allocation. Investors might consider waiting for a clearer turnaround in financial stability before committing to long-term exposure.
Disclaimer: This content is for informational purposes only and does not constitute financial, investment, or other professional advice. Investing in financial markets involves a significant risk of loss, and past performance is not indicative of future results.
Additional Resources
- American Tower Corporation Reports Fourth Quarter and Full Year 2025 Financial Results – Business Wire (Feb 24, 2026)
- American Tower issues light 2026 guidance amid cost efficiency push; Q4 earnings beat (AMT:NYSE) – Seeking Alpha (Feb 24, 2026)
- American Tower’s Q4 AFFO & Revenues Beat Estimates, Rise Y/Y – TradingView (Feb 24, 2026)
- The Backbone of the Digital Era: A Deep-Dive into American Tower (AMT) – FinancialContent (Feb 24, 2026)
- Clearstead Advisors LLC Reduces Position in American Tower Corporation $AMT – MarketBeat (Feb 24, 2026)
For more information about American Tower Corporation, please visit the official website: americantower.com