Home > Analyses > Financial Services > American International Group, Inc.
American International Group, Inc. shapes global risk management by protecting businesses and individuals from uncertainty. Its diversified insurance portfolio spans commercial liability, property, and innovative life and retirement products. Renowned for underwriting expertise and broad market reach, AIG influences financial stability worldwide. As the insurance industry evolves, I ask: does AIG’s strong legacy and strategic positioning still justify its current valuation and growth prospects?

Table of contents
Business Model & Company Overview
American International Group, Inc., founded in 1919 and headquartered in New York City, stands as a leader in the diversified insurance industry. It delivers a comprehensive ecosystem of insurance products that serve commercial, institutional, and individual clients worldwide. Its core mission integrates risk management solutions ranging from general liability to specialized life and retirement products, underscoring its dominant market position.
The company’s revenue engine balances robust offerings across General Insurance and Life and Retirement segments. It generates value through a mix of commercial insurance, personal policies, annuities, and advisory services. Operating globally in the Americas, Europe, and Asia, it leverages a broad distribution network including agents, financial advisors, and banks. This diverse footprint and comprehensive product suite form a formidable economic moat shaping the future of insurance.
Financial Performance & Fundamental Metrics
I will analyze American International Group, Inc.’s income statement, key financial ratios, and dividend payout policy to assess its core financial health and shareholder returns.
Income Statement
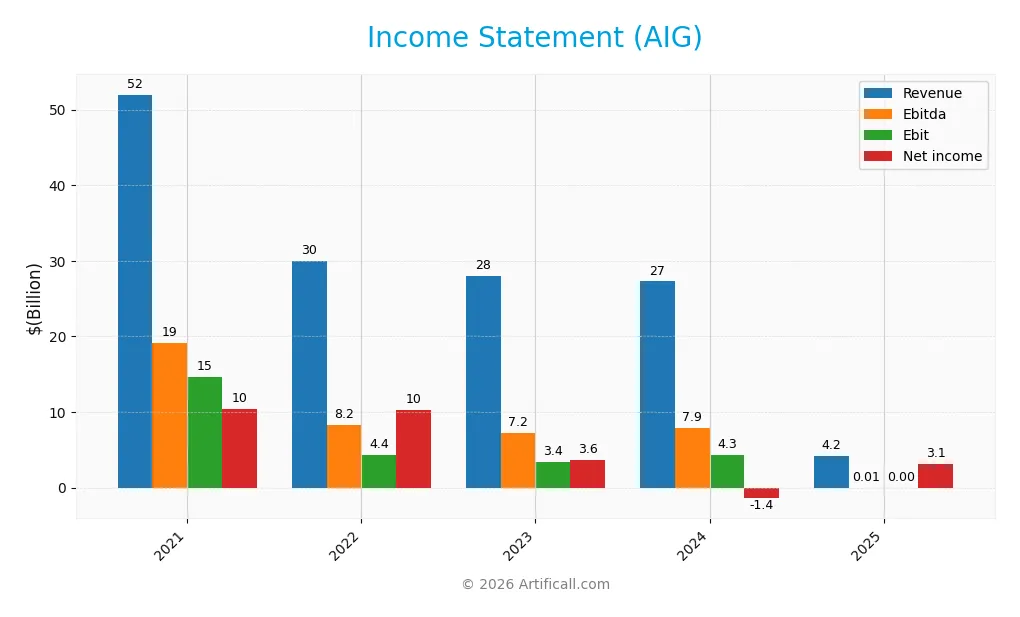
The table below summarizes American International Group, Inc. (AIG) income statement figures for fiscal years 2021 through 2025, reported in USD.
| 2021 | 2022 | 2023 | 2024 | 2025 | |
|---|---|---|---|---|---|
| Revenue | 51.98B | 29.98B | 27.96B | 27.27B | 4.22B |
| Cost of Revenue | 31.88B | 22.72B | 23.59B | 17.99B | 0 |
| Operating Expenses | 6.76B | 3.49B | 1.51B | 5.41B | 0 |
| Gross Profit | 20.11B | 7.26B | 4.37B | 9.28B | 0 |
| EBITDA | 19.19B | 8.24B | 7.22B | 7.93B | 5.48M |
| EBIT | 14.65B | 4.38B | 3.38B | 4.33B | 0 |
| Interest Expense | 1.31B | 603M | 516M | 462M | 0 |
| Net Income | 10.37B | 10.23B | 3.64B | -1.40B | 3.10B |
| EPS | 12.10 | 13.10 | 5.02 | 3.38 | 7.09 |
| Filing Date | 2022-02-17 | 2023-02-17 | 2024-02-14 | 2025-02-13 | 2026-02-12 |
Income Statement Evolution
From 2021 to 2025, AIG’s revenue contracted sharply, falling 92% overall, with a steep 85% drop in the last year. Net income declined 70% across the period but surged 1527% in 2025 due to improved net margins. Gross and EBIT margins deteriorated dramatically, hitting zero in 2025, signaling a significant shift in earnings composition.
Is the Income Statement Favorable?
The 2025 income statement shows a net margin of 73%, an unusually high figure driven by non-traditional income items rather than core operations. Revenue and gross profit collapsed, reflecting unfavorable fundamentals. Despite strong EPS growth and stable interest expense, overall income quality appears weak. The global evaluation rates the statement as unfavorable, signaling caution.
Financial Ratios
The table below summarizes key financial ratios for American International Group, Inc. (AIG) over the past five fiscal years:
| Ratios | 2021 | 2022 | 2023 | 2024 | 2025 |
|---|---|---|---|---|---|
| Net Margin | 20% | 34% | 13% | -5% | 73% |
| ROE | 16% | 25% | 8% | -3% | 8% |
| ROIC | 2% | 9% | 11% | 9% | 11% |
| P/E | 4.7 | 4.8 | 13.4 | -31.4 | 15.6 |
| P/B | 0.74 | 1.20 | 1.07 | 1.04 | 1.18 |
| Current Ratio | 0 | 0 | 0 | 0 | 9.8 |
| Quick Ratio | 0 | 0 | 0 | 0 | 9.8 |
| D/E | 0.46 | 0.66 | 0.24 | 0.21 | 0.22 |
| Debt-to-Assets | 5.1% | 5.2% | 2.0% | 5.5% | 5.6% |
| Interest Coverage | 10.2 | 6.2 | 5.5 | 8.4 | 0 |
| Asset Turnover | 0.09 | 0.06 | 0.05 | 0.17 | 0.03 |
| Fixed Asset Turnover | 0 | 0 | 0 | 0 | 0 |
| Dividend Yield | 2.3% | 2.1% | 2.1% | 2.3% | 2.0% |
Evolution of Financial Ratios
From 2021 to 2025, AIG’s Return on Equity (ROE) showed volatility, peaking above 24% in 2022 but falling to 7.5% by 2025, indicating a weakening trend in shareholder returns. The Current Ratio dramatically increased in 2025 to 9.83, a sign of exceptional liquidity, while the Debt-to-Equity Ratio steadily declined, suggesting improved leverage management. Profitability saw instability, with net margins swinging from negative in 2024 to a very strong 73.45% in 2025.
Are the Financial Ratios Favorable?
In 2025, AIG presents a mixed picture. Profitability metrics are generally favorable: net margin is strong at 73.45%, and Return on Invested Capital (ROIC) at 11.1% exceeds the weighted average cost of capital (WACC) of 5.84%. Liquidity is uneven, with a high Current Ratio flagged as unfavorable, contrasting with a favorable Quick Ratio. Leverage is well controlled, with a low Debt-to-Equity ratio of 0.22 and debt to assets at 5.6%. However, asset turnover and interest coverage ratios raise red flags, reflecting efficiency and financial risk concerns. Overall, more than half of the ratios are favorable, supporting a cautiously positive view.
Shareholder Return Policy
American International Group, Inc. maintains a dividend payout ratio around 31.5% with a steady dividend per share increase, yielding about 2%. The company supports shareholder returns through consistent dividends and share buybacks, funded comfortably by free cash flow.
This disciplined policy balances payout and capital preservation, reducing risk of unsustainable distributions. By aligning dividends with cash generation, AIG appears to support sustainable long-term shareholder value creation.
Score analysis
The radar chart below visualizes American International Group, Inc.’s key financial scores across valuation, profitability, and leverage metrics:
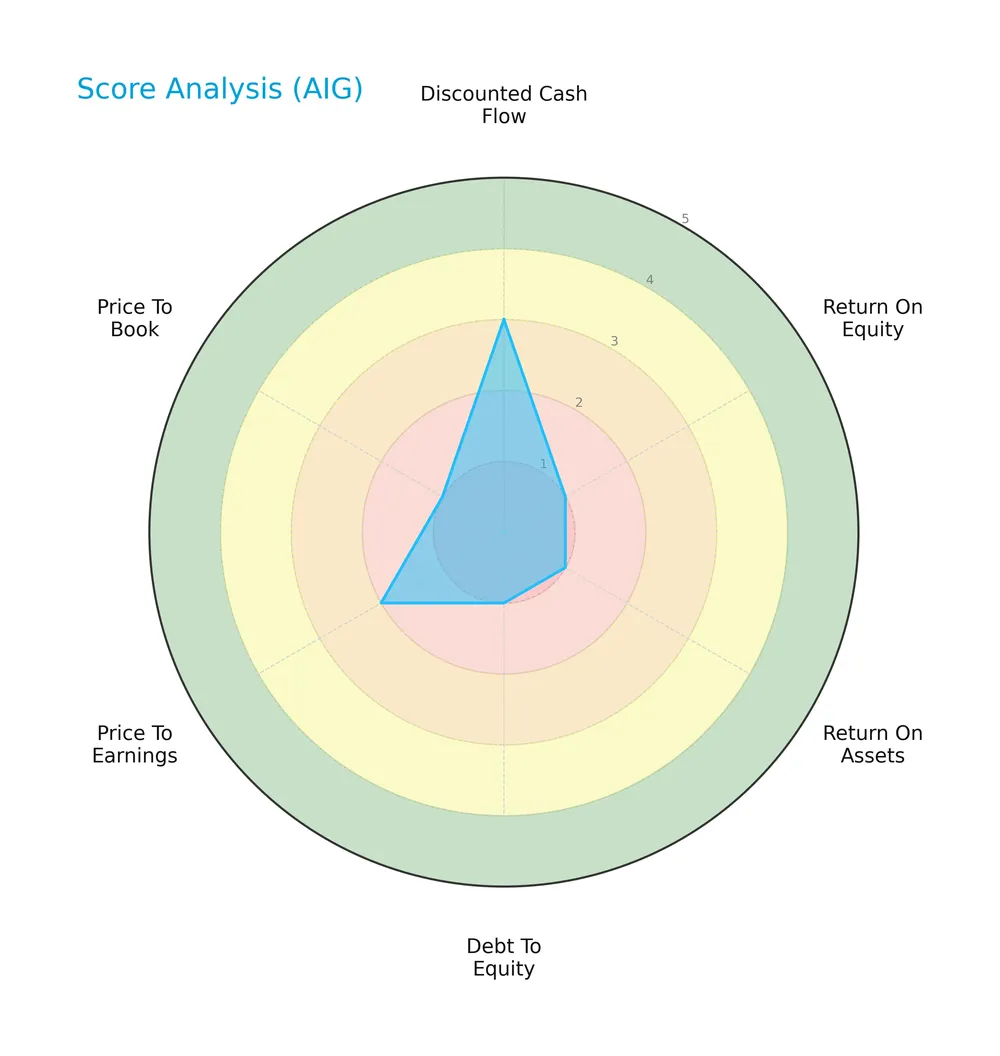
The company scores moderately on discounted cash flow (3) but poorly on return on equity (1) and assets (1). Leverage and valuation metrics are very unfavorable, with debt-to-equity and price-to-book scores at 1, and price-to-earnings at 2.
Analysis of the company’s bankruptcy risk
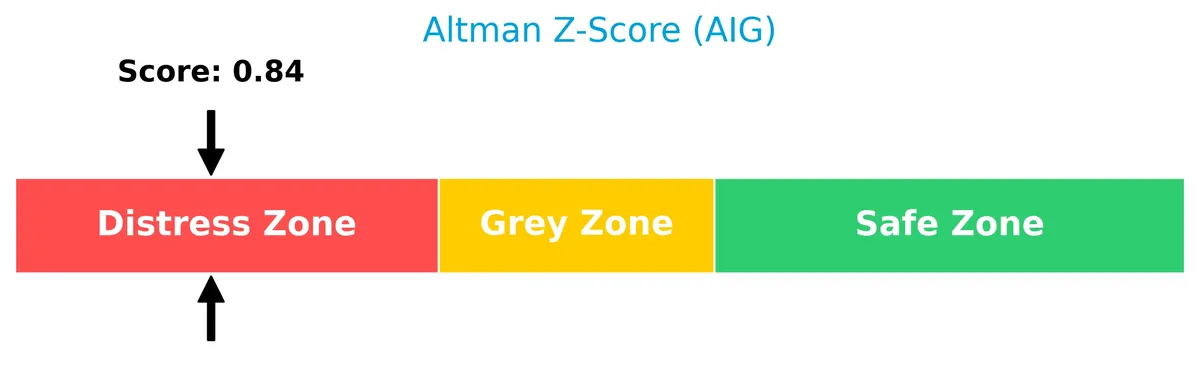
American International Group, Inc. is currently in the distress zone based on its Altman Z-Score, indicating a high risk of financial distress and potential bankruptcy:
Is the company in good financial health?
The Piotroski Score diagram below illustrates American International Group, Inc.’s financial health assessment:

With a Piotroski Score of 5, the company shows average financial strength. This score suggests mixed signals in profitability, leverage, liquidity, and operational efficiency.
Competitive Landscape & Sector Positioning
This sector analysis will explore American International Group, Inc.’s strategic positioning, revenue streams, and product portfolio. I will examine its main competitors and assess key competitive advantages. The goal is to determine whether AIG holds a sustainable edge over its peers.
Strategic Positioning
American International Group, Inc. maintains a diversified insurance portfolio across General Insurance and Life and Retirement segments. Its geographic exposure balances North America and international markets, with revenues near $27.7B and $14.1B respectively in 2025, reflecting broad commercial and personal insurance coverage.
Revenue by Segment
The pie chart illustrates American International Group, Inc.’s revenue distribution by segment for fiscal year 2025, highlighting key business drivers and financial structure.
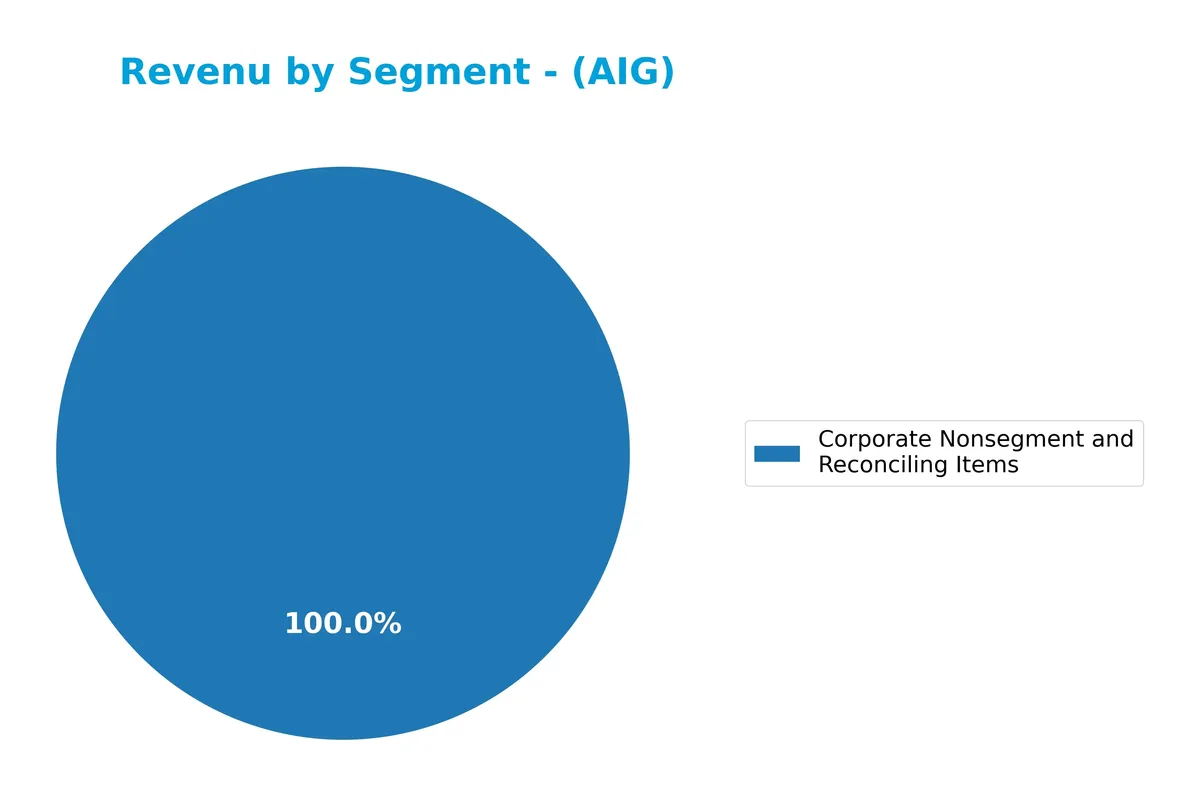
In 2025, the General Insurance Segment dominates with $27.7B, reflecting its role as the core revenue engine. Corporate Nonsegment and Reconciling Items contribute a modest $73M, showing limited impact. The absence of Life and Retirement figures this year signals a strategic shift or reporting change. Overall, revenue concentration in General Insurance remains strong, but investors should monitor potential risks in segment diversification.
Key Products & Brands
The table below outlines American International Group, Inc.’s core insurance and financial product offerings:
| Product | Description |
|---|---|
| General Insurance Segment | Provides commercial liability, property, casualty, workers’ compensation, aerospace, political risk, trade credit, marine insurance. |
| Professional Liability | Covers directors and officers, mergers and acquisitions, employment practices, cyber risk, kidnap and ransom, and errors and omissions. |
| Personal Insurance | Includes auto, homeowners, umbrella, yacht, fine art, collections, personal accident, extended warranty, and travel insurance. |
| Life and Retirement Segment | Offers variable, index, fixed annuities, retail mutual funds, term and universal life insurance, pension risk transfer annuities. |
| Financial Planning Services | Provides advisory, record-keeping, plan administration, compliance services, and guaranteed investment contracts. |
American International Group’s product mix combines broad commercial insurance with diversified personal and life insurance offerings. The firm leverages multi-channel distribution to serve institutional and individual clients globally.
Main Competitors
The sector includes 5 competitors, with the table below showing the top 5 leaders by market capitalization:
| Competitor | Market Cap. |
|---|---|
| Berkshire Hathaway Inc. | 1.07T |
| American International Group, Inc. | 45.5B |
| The Hartford Financial Services Group, Inc. | 38.2B |
| Arch Capital Group Ltd. | 34.9B |
| Principal Financial Group, Inc. | 20.1B |
American International Group ranks 2nd among its competitors. Its market cap is just 4.0% of the leader’s massive 1.07T valuation. The company sits below the average market cap of the top 10 in its sector but remains above the sector median. It holds a wide 2421.3% gap over the closest competitor above.
Comparisons with competitors
Check out how we compare the company to its competitors:
Does AIG have a competitive advantage?
American International Group, Inc. exhibits a clear competitive advantage, as evidenced by its ROIC exceeding WACC by 5.26%, indicating value creation and efficient capital use. The company shows a strong upward ROIC trend of 518%, confirming growing profitability and a sustainable economic moat.
Looking ahead, AIG’s broad insurance product portfolio across North America and international markets supports future opportunities. Continued innovation in specialty insurance lines and expansion in emerging markets could further strengthen its competitive position in a challenging industry.
SWOT Analysis
This SWOT analysis highlights American International Group, Inc.’s key strategic factors impacting its market position and growth potential.
Strengths
- strong market presence in North America and international markets
- favorable ROIC above WACC indicating value creation
- diversified insurance product portfolio
Weaknesses
- declining revenue trend over recent years
- low Altman Z-Score signals financial distress risk
- weak asset turnover and interest coverage ratios
Opportunities
- expanding digital insurance platforms
- growing demand for specialty insurance products
- potential to improve operational efficiency
Threats
- intense competition in insurance sector
- regulatory changes impacting underwriting
- economic downturn affecting premium growth
AIG’s strengths in diversification and value creation support resilience. However, revenue declines and financial distress risk require strategic focus on efficiency and innovation to capitalize on emerging opportunities.
Stock Price Action Analysis
The weekly chart below illustrates American International Group, Inc.’s stock price movement over the last 100 weeks, highlighting key price levels and volatility:
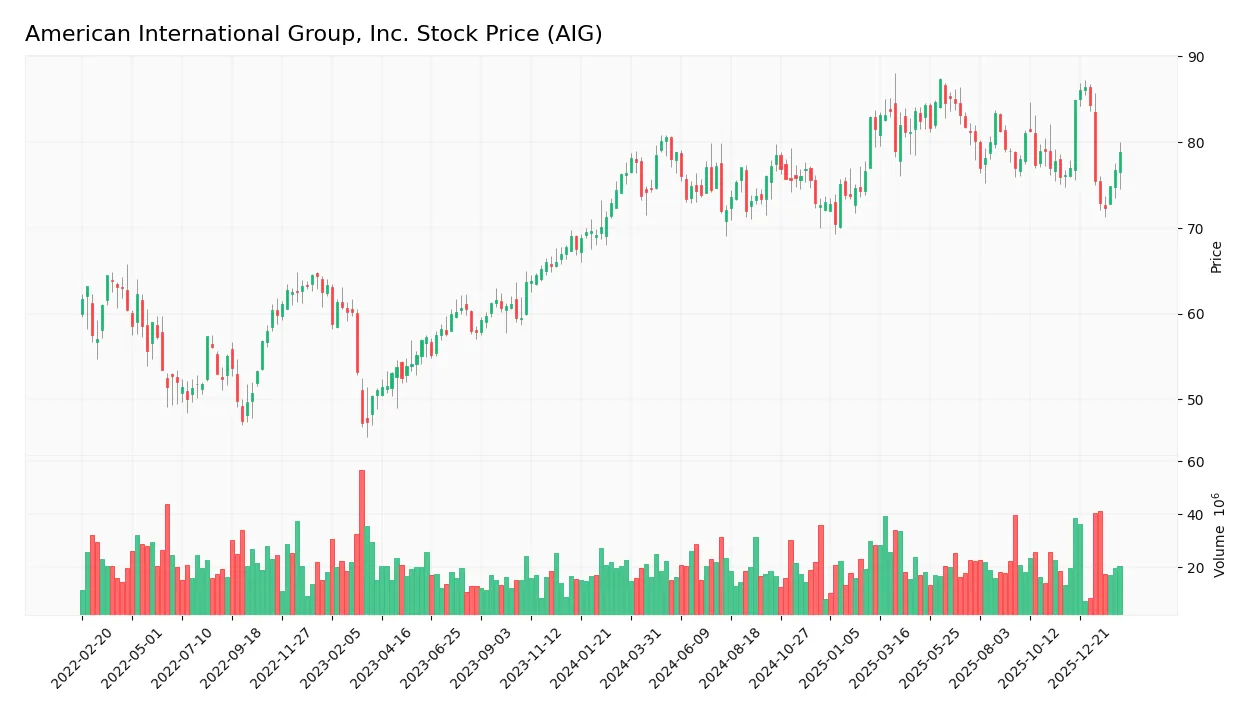
Trend Analysis
Over the past 12 months, AIG’s stock rose 3.17%, indicating a bullish trend. The price reached a high of 87.34 and a low of 70.5, with volatility measured by a 3.97% standard deviation. However, the trend shows deceleration, signaling slowing momentum despite gains.
Volume Analysis
Trading volume has increased notably, with buyer volume at 1.73B versus seller volume at 1.08B over the recent three months. Buyers dominate with 61.61% share, suggesting strong investor interest and positive market participation during this period.
Target Prices
Analysts set a clear target consensus for AIG, reflecting cautious optimism.
| Target Low | Target High | Consensus |
|---|---|---|
| 77 | 95 | 85.25 |
The target range indicates moderate upside potential, with a consensus around $85, suggesting steady confidence in AIG’s recovery and growth prospects.

Don’t Let Luck Decide Your Entry Point
Optimize your entry points with our advanced ProRealTime indicators. You’ll get efficient buy signals with precise price targets for maximum performance. Start outperforming now!
Analyst & Consumer Opinions
This section reviews analyst ratings and consumer feedback to provide insights on American International Group, Inc.’s market perception.
Stock Grades
Here are the latest verified analyst grades for American International Group, Inc. (AIG) from reputable firms:
| Grading Company | Action | New Grade | Date |
|---|---|---|---|
| Piper Sandler | Maintain | Overweight | 2026-02-12 |
| Keefe, Bruyette & Woods | Maintain | Outperform | 2026-02-12 |
| Cantor Fitzgerald | Maintain | Neutral | 2026-01-14 |
| Wells Fargo | Maintain | Equal Weight | 2026-01-13 |
| Barclays | Maintain | Equal Weight | 2026-01-08 |
| Keefe, Bruyette & Woods | Maintain | Outperform | 2026-01-06 |
| Piper Sandler | Maintain | Overweight | 2025-12-22 |
| TD Cowen | Maintain | Hold | 2025-12-16 |
| Barclays | Downgrade | Equal Weight | 2025-12-05 |
| Goldman Sachs | Maintain | Neutral | 2025-11-20 |
The grades show a consistent pattern of cautious optimism, with most firms maintaining overweight or outperform stances. Recent downgrades to equal weight suggest some tempered expectations amid mixed market signals.
Consumer Opinions
Consumers express a mix of appreciation and frustration toward American International Group, Inc. (AIG), reflecting its complex market position.
| Positive Reviews | Negative Reviews |
|---|---|
| Reliable claims processing with timely responses. | Customer service can be slow and unhelpful. |
| Competitive pricing on insurance products. | Policy terms sometimes lack clarity. |
| Strong financial backing gives peace of mind. | Website interface feels outdated and difficult to navigate. |
Overall, customers praise AIG’s financial stability and competitive pricing. However, recurring complaints about customer service delays and unclear policy details suggest areas needing urgent improvement.
Risk Analysis
Below is a summary table outlining key risks facing American International Group, Inc. (AIG) along with their probability and potential impact:
| Category | Description | Probability | Impact |
|---|---|---|---|
| Financial Health | Altman Z-Score of 0.84 places AIG in the distress zone, indicating high bankruptcy risk. | High | Severe |
| Profitability | Low ROE of 7.53% despite favorable net margin, reflecting inefficient capital use. | Medium | Moderate |
| Liquidity | Unusually high current ratio (9.83) signals potential asset misallocation or operational issues. | Medium | Moderate |
| Debt & Coverage | Interest coverage is zero, raising concerns about ability to service debt under stress. | High | Severe |
| Market Volatility | Beta of 0.598 suggests lower market sensitivity but limits upside in strong bull markets. | Low | Low |
| Valuation | Neutral P/E (15.62) and favorable P/B (1.18) imply reasonable valuation but mixed sentiment. | Medium | Moderate |
The most pressing risks for AIG are its distressed financial health and zero interest coverage, both red flags for credit risk. Despite a strong net margin and reasonable valuation, persistent operational inefficiencies and capital allocation concerns warrant caution. Historically, insurance firms with such financial stress face heightened vulnerability during economic downturns. I advise close monitoring of liquidity and debt servicing metrics before committing capital.
Should You Buy American International Group, Inc.?
American International Group, Inc. appears to be delivering improving value creation with a durable competitive moat supported by growing ROIC above WACC. Despite a manageable leverage profile, its overall rating of C- suggests caution due to weak profitability and financial distress signals.
Strength & Efficiency Pillars
American International Group, Inc. posts a strong net margin of 73.45%, signaling operational profitability. Its return on invested capital (ROIC) stands at 11.1%, comfortably above the weighted average cost of capital (WACC) at 5.84%, confirming that the company is a clear value creator. Despite a modest return on equity (ROE) of 7.53%, the growing ROIC trend and favorable capital allocation demonstrate a sustainable competitive advantage and improving profitability.
Weaknesses and Drawbacks
The company is in financial distress, evidenced by an Altman Z-Score of 0.84, placing it firmly in the distress zone with a high bankruptcy risk. This alarming signal overshadows other metrics. Moreover, unfavorable leverage metrics such as an abnormally high current ratio of 9.83 raise concerns about asset utilization efficiency. Valuation ratios are mixed, with a neutral P/E of 15.62 but a favorable P/B of 1.18. Interest coverage is zero, highlighting potential difficulties in meeting debt obligations.
Our Final Verdict about American International Group, Inc.
Despite operational profitability and clear value creation, the distress zone Altman Z-Score signals critical solvency risk. This risk renders the investment profile highly speculative and too risky for conservative capital. Investors should weigh these financial health concerns heavily against any apparent operational strengths before considering exposure to AIG.
Disclaimer: This content is for informational purposes only and does not constitute financial, investment, or other professional advice. Investing in financial markets involves a significant risk of loss, and past performance is not indicative of future results.
Additional Resources
- American International Group, Inc. $AIG Shares Sold by ProShare Advisors LLC – MarketBeat (Feb 12, 2026)
- AMERICAN INTERNATIONAL GROUP, INC. SEC 10-K Report – TradingView (Feb 12, 2026)
- American International Group stock price target lowered to $88 by Piper Sandler – Investing.com (Feb 12, 2026)
- Here’s What Key Metrics Tell Us About American International Group (AIG) Q4 Earnings – Yahoo Finance (Feb 10, 2026)
- Keefe, Bruyette & Woods Raises Price Target for AIG to $97 | AIG Stock News – GuruFocus (Feb 12, 2026)
For more information about American International Group, Inc., please visit the official website: aig.com