Home > Analyses > Financial Services > American Express Company
American Express transforms how millions manage payments and travel worldwide. Its iconic charge and credit cards drive commerce and loyalty across consumer and business segments. Known for innovation and premium service, Amex commands a stronghold in financial credit services. As competition intensifies and digital payments evolve, I ask: does American Express’s robust brand and diversified portfolio still justify its lofty valuation and growth ambitions?

Table of contents
Business Model & Company Overview
American Express Company, founded in 1850 and headquartered in New York City, stands as a dominant force in the financial services industry. It delivers a cohesive ecosystem of charge and credit payment cards, network services, and travel-related offerings. Its integrated approach spans consumer, commercial, and merchant segments, creating a seamless experience across payments, expense management, and loyalty programs.
The company’s revenue engine balances transaction fees, financing products, and recurring services worldwide. It leverages a strategic presence across the Americas, Europe, and Asia to serve consumers, small businesses, and large corporations. This multi-faceted model fuels a durable competitive advantage grounded in brand strength, extensive merchant networks, and innovative fraud prevention tools.
Financial Performance & Fundamental Metrics
I analyze American Express Company’s income statement, key financial ratios, and dividend payout policy to assess its overall financial health and shareholder value.
Income Statement
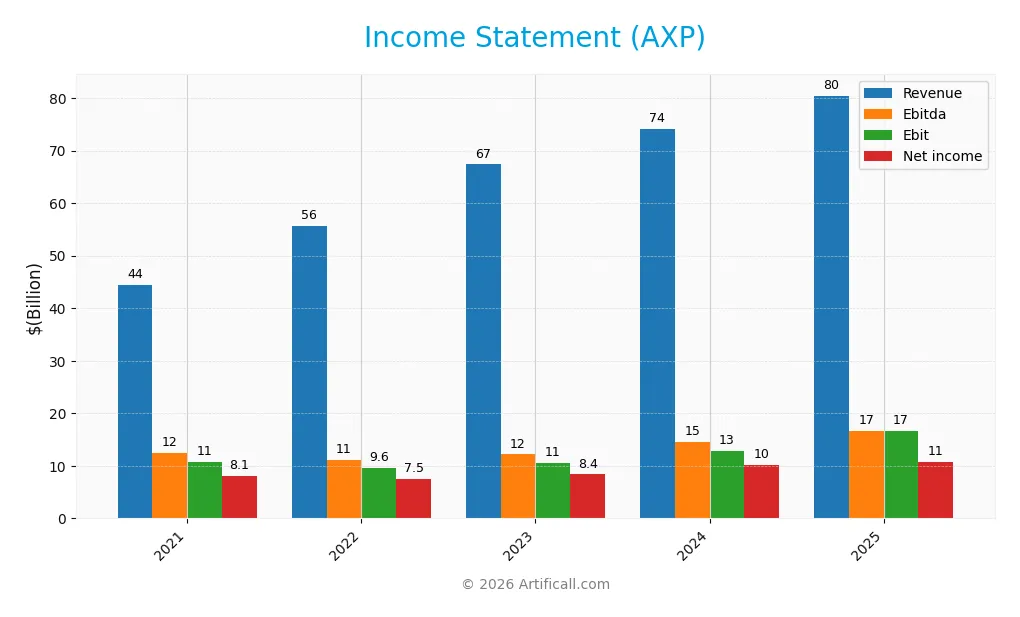
This table summarizes American Express Company’s annual income statement figures for 2021 through 2025 in USD, reflecting revenue, expenses, profits, and earnings per share.
| 2021 | 2022 | 2023 | 2024 | 2025 | |
|---|---|---|---|---|---|
| Revenue | 44.4B | 55.6B | 67.4B | 74.2B | 80.5B |
| Cost of Revenue | -136M | 4.9B | 11.8B | 13.4B | 29.9B |
| Operating Expenses | 33.9B | 41.1B | 45.1B | 47.9B | 34.0B |
| Gross Profit | 44.6B | 50.7B | 55.6B | 60.8B | 50.6B |
| EBITDA | 12.4B | 11.2B | 12.2B | 14.6B | 16.6B |
| EBIT | 10.7B | 9.6B | 10.5B | 12.9B | 16.6B |
| Interest Expense | 1.3B | 2.8B | 6.8B | 8.3B | 2.8B |
| Net Income | 8.1B | 7.5B | 8.4B | 10.1B | 10.8B |
| EPS | 10.03 | 9.85 | 11.23 | 14.04 | 15.4 |
| Filing Date | 2022-02-11 | 2023-02-10 | 2024-02-09 | 2025-02-07 | 2026-02-06 |
Income Statement Evolution
American Express’s revenue rose steadily from $44.4B in 2021 to $80.5B in 2025, an 81% increase. Net income grew 34% over the period, though net margin declined by 26%, reflecting some margin pressure. Gross profit expanded initially but dipped 17% in the last year, signaling cost shifts. Operating expenses grew in line with revenue, supporting margin stability.
Is the Income Statement Favorable?
In 2025, fundamentals remain favorable despite mixed signals. The gross margin holds at 62.85%, and EBIT margin improved to 20.64%. Interest expense is well-controlled at 3.49% of revenue. Net margin slipped slightly to 13.39%, but EPS increased nearly 10%. Overall, 79% of key metrics are positive, indicating a strong income statement foundation.
Financial Ratios
The table below presents key financial ratios for American Express Company (AXP) from 2021 to 2025, providing insight into profitability, efficiency, liquidity, leverage, and shareholder returns:
| Ratios | 2021 | 2022 | 2023 | 2024 | 2025 |
|---|---|---|---|---|---|
| Net Margin | 18% | 14% | 12% | 14% | 13% |
| ROE | 36% | 30% | 30% | 33% | 32% |
| ROIC | 8.8% | 7.2% | 7.2% | 8.7% | 4.3% |
| P/E | 16.0 | 14.8 | 16.4 | 20.9 | 23.9 |
| P/B | 5.8 | 4.5 | 4.9 | 7.0 | 7.7 |
| Current Ratio | 0.27 | 0.31 | 0.33 | 0.26 | 80.0 |
| Quick Ratio | 0.27 | 0.31 | 0.33 | 0.26 | 80.0 |
| D/E | 1.85 | 1.78 | 1.75 | 1.69 | 1.73 |
| Debt-to-Assets | 22% | 19% | 19% | 19% | 19% |
| Interest Coverage | 8.3 | 3.5 | 1.5 | 1.6 | 5.9 |
| Asset Turnover | 0.24 | 0.24 | 0.26 | 0.27 | 0.27 |
| Fixed Asset Turnover | 8.9 | 10.7 | 11.4 | 12.0 | 0.0 |
| Dividend Yield | 1.1% | 1.4% | 1.3% | 0.9% | 0.9% |
Evolution of Financial Ratios
Return on Equity (ROE) has remained robust around 30%, reflecting strong profitability. The Current Ratio shows extreme volatility, peaking at 79.97 in 2025, which is atypical. Debt-to-Equity Ratio hovered near 1.7, indicating sustained leverage. Profit margins maintained stability, with net margin near 13%, highlighting consistent bottom-line performance.
Are the Financial Ratios Fovorable?
In 2025, profitability is favorable with a 32.19% ROE and 13.39% net margin. Liquidity appears mixed; an abnormally high current ratio contrasts with a favorable quick ratio. Leverage is unfavorable due to a 1.73 debt-to-equity ratio, but interest coverage at 5.91 is strong. Market valuation metrics like P/E and P/B ratios are neutral to unfavorable, resulting in a slightly unfavorable overall ratio profile.
Shareholder Return Policy
American Express maintains a consistent dividend payout ratio near 21%, with dividend per share rising from $1.84 in 2021 to $3.27 in 2025. The annual dividend yield averages around 1%, supported by free cash flow coverage and balanced share buyback programs.
This payout strategy aligns with sustainable long-term value creation, as dividends remain well-covered by operating cash flow. Moderate leverage and disciplined capital allocation mitigate risks of excessive distributions or overreliance on repurchases in the current market environment.
Score analysis
Here is a radar chart illustrating key financial metric scores for American Express Company:
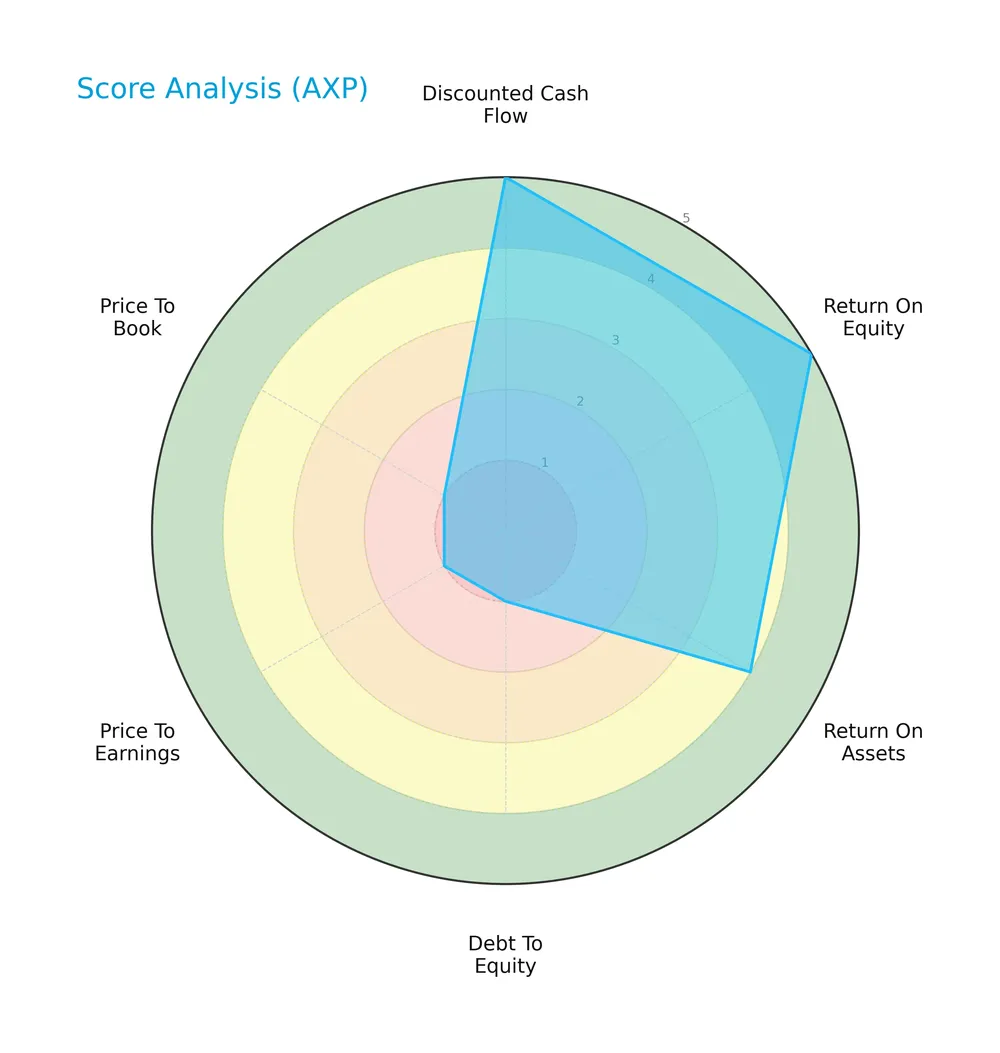
The firm scores very favorably in discounted cash flow and return on equity, with favorable return on assets. However, debt-to-equity, price-to-earnings, and price-to-book ratios score very unfavorably, indicating valuation and leverage concerns.
Analysis of the company’s bankruptcy risk
The Altman Z-Score places the company in the distress zone, signaling a heightened risk of financial distress and potential bankruptcy:

Is the company in good financial health?
This Piotroski diagram highlights the company’s financial strength assessment:

With a strong Piotroski score of 7, the company demonstrates solid financial health, reflecting good profitability, efficiency, and leverage metrics despite some risks.
Competitive Landscape & Sector Positioning
This analysis examines American Express Company’s strategic positioning within the financial services sector. It explores revenue by segment, key products, and main competitors. I will assess whether American Express maintains a competitive advantage over its rivals in this dynamic industry.
Strategic Positioning
American Express concentrates its portfolio in financial services, focusing on payment cards, commercial services, and merchant network services. Geographically, it remains heavily US-centric, with over 50B in US revenue, while steadily expanding in EMEA, JAPA, and LACC regions, reflecting balanced but US-dominant exposure.
Revenue by Segment
This pie chart illustrates American Express’s revenue distribution by segment for fiscal year 2024, highlighting the contribution of each business unit to total sales.

American Express’s 2024 revenue centers on Global Consumer Services Group at $31.4B, showing steady growth and dominance. Global Commercial Services follows with $15.9B, reflecting solid expansion in business services. International Card Services and Global Merchant and Network Services contribute $11.5B and $7.5B respectively, indicating geographic and transactional diversification. The 2024 data reveals a firm concentration in consumer services with accelerating revenue, underscoring its strategic core.
Key Products & Brands
American Express’s main product segments and their core offerings are outlined below:
| Product | Description |
|---|---|
| Global Consumer Services Group | Provides charge and credit payment card products primarily to consumers, supported by travel and lifestyle services. |
| Global Commercial Services | Offers payment and financing solutions to small businesses, mid-sized companies, and large corporations. |
| Global Merchant and Network Services | Manages merchant acquisition, payment processing, servicing, settlement, and fraud prevention for merchants. |
| International Card Services | Delivers credit and charge card products and services outside the U.S., including customer loyalty programs. |
American Express generates most revenue from consumer and commercial card services, complemented by merchant network operations and international offerings. This diversified product suite supports a broad customer base globally.
Main Competitors
There are 6 competitors in total, with the table below showing the top 6 leaders by market capitalization:
| Competitor | Market Cap. |
|---|---|
| Visa Inc. | 672.3B |
| Mastercard Incorporated | 505.7B |
| American Express Company | 260.1B |
| Capital One Financial Corporation | 157.6B |
| PayPal Holdings, Inc. | 54.4B |
| Synchrony Financial | 32.1B |
American Express ranks 3rd among its main competitors. Its market cap is 37% of Visa’s, the sector leader. The company sits below the average market cap of the top 10 but above the sector median. It has a 104% market cap gap with Mastercard, its closest rival above.
Comparisons with competitors
Check out how we compare the company to its competitors:
Does American Express have a competitive advantage?
American Express currently lacks a competitive advantage, as its ROIC falls below WACC by 3.74%, indicating value destruction and declining profitability over 2021-2025. The firm’s economic moat is rated very unfavorable, reflecting challenges in sustaining excess returns in its credit services segment.
Looking ahead, American Express’s broad product portfolio—spanning payment cards, merchant services, and travel—offers growth avenues in global markets like EMEA and JAPA. Continued innovation in digital payments and customer loyalty programs may present new opportunities to improve profitability and regain competitive footing.
SWOT Analysis
This SWOT analysis highlights American Express’s key internal and external factors to inform strategic decisions.
Strengths
- strong brand loyalty
- diversified global presence
- favorable net margin of 13.4%
Weaknesses
- declining ROIC below WACC
- high debt-to-equity ratio at 1.73
- unfavorable asset turnover of 0.27
Opportunities
- expanding international markets
- growth in digital payments
- partnerships with merchants and fintechs
Threats
- intense competition in credit services
- regulatory risks
- economic downturns affecting consumer spending
American Express’s strengths in brand and profitability support resilience, but value destruction signals urgent need to improve capital efficiency. Strategic focus should prioritize operational efficiency and debt management while leveraging global growth and digital innovation.
Stock Price Action Analysis
The following weekly chart illustrates American Express Company’s stock price movement and volatility over the past 12 months:

Trend Analysis
Over the past 12 months, AXP’s stock price increased by 64.4%, indicating a strong bullish trend. The highest price reached 382.56 and the lowest was 218.2. The trend shows deceleration despite high volatility (std deviation 45.81), suggesting momentum is slowing.
Volume Analysis
Trading volume for AXP is decreasing overall, with buyers accounting for 63.2% historically. However, recent volume shows a slight seller dominance at 42.8% buyer share, indicating cautious sentiment and reduced market participation since late 2025.
Target Prices
Analysts set a clear target consensus for American Express Company (AXP), reflecting moderate optimism.
| Target Low | Target High | Consensus |
|---|---|---|
| 295 | 425 | 375.17 |
The target range from 295 to 425 signals confidence in AXP’s growth potential, with a consensus near 375 suggesting solid upside relative to current levels.

Don’t Let Luck Decide Your Entry Point
Optimize your entry points with our advanced ProRealTime indicators. You’ll get efficient buy signals with precise price targets for maximum performance. Start outperforming now!
Analyst & Consumer Opinions
This section examines recent grades and consumer feedback to evaluate American Express Company’s market perception and customer sentiment.
Stock Grades
Here are the latest verified stock grades from leading financial institutions for American Express Company:
| Grading Company | Action | New Grade | Date |
|---|---|---|---|
| JP Morgan | Maintain | Neutral | 2026-02-02 |
| Truist Securities | Maintain | Buy | 2026-02-02 |
| BTIG | Maintain | Sell | 2026-02-02 |
| JP Morgan | Maintain | Neutral | 2026-01-12 |
| TD Cowen | Maintain | Hold | 2026-01-08 |
| Barclays | Maintain | Equal Weight | 2026-01-06 |
| Truist Securities | Maintain | Buy | 2025-12-22 |
| Wells Fargo | Maintain | Overweight | 2025-12-17 |
| Freedom Capital Markets | Upgrade | Hold | 2025-10-24 |
| Wells Fargo | Maintain | Overweight | 2025-10-20 |
The grades show a stable consensus with most firms maintaining their previous assessments. Buy and hold ratings dominate, while sell opinions remain limited, reflecting a broadly cautious but constructive outlook.
Consumer Opinions
American Express consistently earns praise and criticism that reveal key aspects of its customer experience.
| Positive Reviews | Negative Reviews |
|---|---|
| Rewards programs offer excellent value. | High annual fees deter occasional users. |
| Customer service is responsive and helpful. | Some users report difficulty resolving disputes. |
| Card benefits, such as travel perks, stand out. | Limited acceptance compared to Visa or Mastercard. |
Consumers admire American Express for its premium rewards and strong service. However, the high fees and acceptance issues remain common complaints. This mix suggests a brand favored by loyal, frequent users but less appealing to casual spenders.
Risk Analysis
Below is a summary of key risks affecting American Express Company (AXP), highlighting their likelihood and potential impact:
| Category | Description | Probability | Impact |
|---|---|---|---|
| Financial Health | Altman Z-Score at 1.53 signals distress zone, risk of default | High | High |
| Leverage | High debt-to-equity ratio of 1.73 increases financial risk | Medium | Medium |
| Profitability | ROIC at 4.35% below WACC of 8.09% suggests value destruction | Medium | Medium |
| Valuation | Elevated PB ratio at 7.68 indicates overvaluation concerns | Medium | Medium |
| Liquidity | Extremely high current ratio (79.97) unusual, may signal issues | Low | Low |
| Market Volatility | Beta of 1.13 implies sensitivity to market swings | Medium | Medium |
| Dividend Yield | Low dividend yield (0.88%) may reduce income appeal | Low | Low |
The most critical risk is the Altman Z-score firmly in the distress zone, implying elevated bankruptcy risk despite a strong Piotroski score of 7. High leverage and weak ROIC relative to WACC confirm financial strain. Valuation metrics warn of premium pricing that may limit upside. I remain cautious given these red flags amid cyclical credit service headwinds.
Should You Buy American Express Company?
American Express appears to exhibit robust profitability but suffers from a very unfavorable moat, indicating value erosion. Despite substantial leverage and a distress-level Altman Z-Score, its overall B rating and strong Piotroski score suggest moderate financial resilience.
Strength & Efficiency Pillars
American Express Company delivers solid operational efficiency with a net margin of 13.39% and return on equity (ROE) of 32.19%, signaling robust profitability. The company maintains favorable gross (62.85%) and EBIT margins (20.64%), reflecting controlled costs and pricing power. However, its return on invested capital (ROIC) at 4.35% trails the weighted average cost of capital (WACC) of 8.09%, indicating the firm is currently shedding value rather than creating it. Margins remain a bright spot amid these challenges, underscoring operational competence.
Weaknesses and Drawbacks
AXP is in financial distress, with an Altman Z-Score of 1.53 placing it in the “Distress Zone,” signaling a heightened bankruptcy risk. This solvency concern overshadows other metrics. The company also faces valuation headwinds with a price-to-book ratio of 7.68 and a price-to-earnings of 23.86, suggesting an expensive market multiple. Leverage is elevated, with a debt-to-equity ratio of 1.73, indicating reliance on debt financing. Additionally, a current ratio of 0.80 raises liquidity concerns, increasing short-term financial risk.
Our Final Verdict about American Express Company
Despite operational strengths in margin management and a strong Piotroski score of 7, the company’s low Altman Z-Score of 1.53 places it in financial distress. This solvency risk makes American Express a highly speculative investment and too risky for conservative capital. Investors may want to exercise caution until the balance sheet stabilizes, especially given current market pressures and valuation premiums.
Disclaimer: This content is for informational purposes only and does not constitute financial, investment, or other professional advice. Investing in financial markets involves a significant risk of loss, and past performance is not indicative of future results.
Additional Resources
- Truist Maintains Buy Rating on American Express (AXP) Citing Rising Growth Costs Following Q4 Results – Yahoo Finance (Feb 06, 2026)
- American Express Reports Full-Year and Fourth-Quarter 2025 Financial Results – American Express (Jan 30, 2026)
- Insider Selling: American Express (NYSE:AXP) Insider Sells 23,385 Shares of Stock – MarketBeat (Feb 06, 2026)
- Could Buying American Express (AXP) Today Set You Up for Life? – The Motley Fool (Feb 04, 2026)
- Palmetto Grain Brokerage – – Palmetto Grain Brokerage (Feb 05, 2026)
For more information about American Express Company, please visit the official website: americanexpress.com