Home > Analyses > Utilities > American Electric Power Company, Inc.
American Electric Power Company, Inc. powers millions of homes and businesses, quietly fueling daily life across the United States. As a dominant player in the regulated electric sector, AEP operates an extensive network spanning generation, transmission, and distribution. Its diverse energy mix blends traditional and renewable sources, reflecting a commitment to innovation and reliability. The pressing question for investors: does AEP’s solid foundation still support its current valuation and future growth prospects?
Table of contents
Business Model & Company Overview
American Electric Power Company, Inc., founded in 1906 and based in Columbus, Ohio, stands as a dominant player in the regulated electric sector. It integrates generation, transmission, and distribution into a cohesive energy ecosystem. The company leverages a diverse energy mix—coal, natural gas, nuclear, hydro, solar, and wind—to serve retail and wholesale customers across the United States.
Its revenue engine balances vertically integrated utilities with transmission and marketing segments, generating stable cash flows. AEP’s strategic footprint spans key U.S. markets, enabling it to optimize supply and demand efficiently. This scale and integration form a robust economic moat, solidifying its role in shaping America’s electric utility future.
Financial Performance & Fundamental Metrics
I analyze American Electric Power Company, Inc.’s income statement, key financial ratios, and dividend payout policy to assess its core financial health and shareholder value.
Income Statement
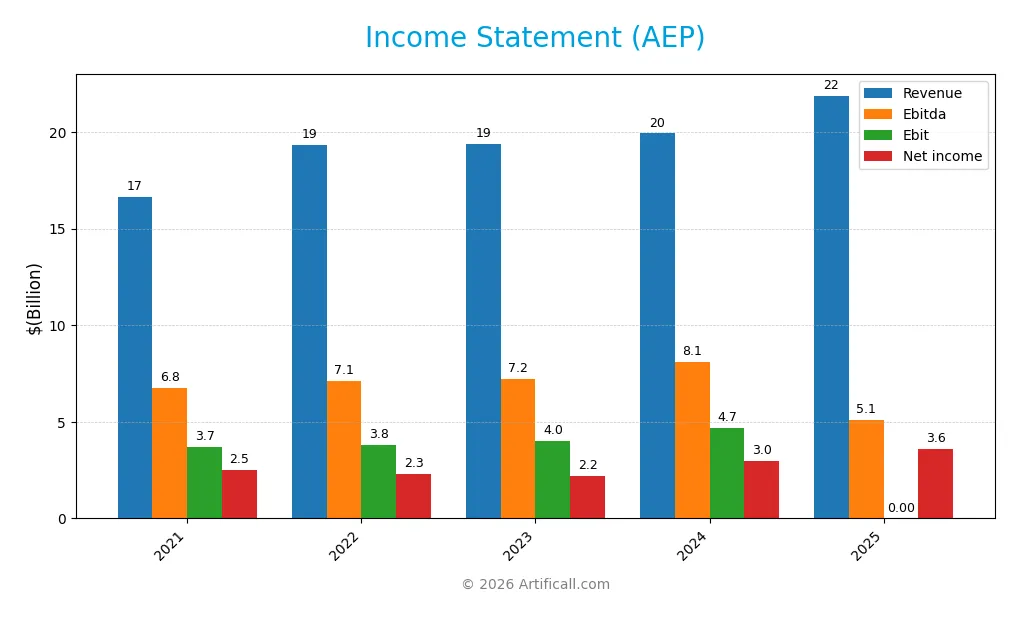
Below is the income statement summary for American Electric Power Company, Inc. over the past five fiscal years, highlighting key profitability and cost metrics.
| 2021 | 2022 | 2023 | 2024 | 2025 | |
|---|---|---|---|---|---|
| Revenue | 16.6B | 19.3B | 19.4B | 19.9B | 21.9B |
| Cost of Revenue | 11.9B | 14.4B | 13.8B | 13.6B | 0 |
| Operating Expenses | 1.4B | 1.5B | 1.5B | 1.6B | 0 |
| Gross Profit | 4.7B | 4.9B | 5.6B | 6.4B | 0 |
| EBITDA | 6.8B | 7.1B | 7.2B | 8.1B | 5.1B |
| EBIT | 3.7B | 3.8B | 4.0B | 4.7B | 0 |
| Interest Expense | 1.2B | 1.4B | 1.8B | 1.9B | 2.0B |
| Net Income | 2.5B | 2.3B | 2.2B | 3.0B | 3.6B |
| EPS | 4.97 | 4.51 | 4.26 | 5.60 | 6.66 |
| Filing Date | 2022-02-24 | 2023-02-23 | 2024-02-26 | 2025-02-13 | 2026-02-12 |
Income Statement Evolution
American Electric Power’s revenue rose steadily by 9.8% in 2025, continuing a five-year growth trend of 31.6%. Net income grew 10.3% year-over-year, reaching $3.6B, up 44.5% since 2021. Net margin improved to 16.4%, reflecting enhanced profitability despite an unfavorable gross margin trend and flat EBIT margins in the latest year.
Is the Income Statement Favorable?
The 2025 income statement shows solid fundamentals. Interest expense consumed 9.3% of revenue, a favorable level supporting net income growth. Earnings per share jumped 19.4% to $6.66, driven by efficient cost controls. Despite the absence of reported gross profit and EBIT figures in 2025, overall metrics indicate a favorable operating performance and margin expansion over the period.
Financial Ratios
The table below summarizes key financial ratios for American Electric Power Company, Inc. (AEP) from 2021 to 2025, providing insight into profitability, valuation, liquidity, leverage, and efficiency:
| Ratios | 2021 | 2022 | 2023 | 2024 | 2025 |
|---|---|---|---|---|---|
| Net Margin | 15.0% | 11.9% | 11.4% | 14.9% | 16.4% |
| ROE | 11.1% | 9.7% | 8.7% | 11.0% | 11.5% |
| ROIC | 3.9% | 3.9% | 4.5% | 5.0% | -54.6% |
| P/E | 17.9 | 21.1 | 19.1 | 16.5 | 16.6 |
| P/B | 2.0 | 2.0 | 1.7 | 1.8 | 1.9 |
| Current Ratio | 0.63 | 0.51 | 0.53 | 0.44 | 0 |
| Quick Ratio | 0.55 | 0.41 | 0.36 | 0.31 | 0 |
| D/E | 1.63 | 1.74 | 1.73 | 1.70 | 0.14 |
| Debt-to-Assets | 42% | 45% | 45% | 44% | 0% |
| Interest Coverage | 2.7 | 2.4 | 2.3 | 2.6 | -2.6 |
| Asset Turnover | 0.19 | 0.21 | 0.20 | 0.19 | 0 |
| Fixed Asset Turnover | 0.25 | 0.26 | 0.25 | 0.24 | 0 |
| Dividend Yield | 3.4% | 3.4% | 4.2% | 3.9% | 3.4% |
Evolution of Financial Ratios
American Electric Power’s Return on Equity (ROE) showed mild fluctuations, peaking near 11.55% in 2025. The Current Ratio remained weak, hitting zero in 2025, indicating liquidity challenges. Debt-to-Equity ratio improved significantly, dropping to 0.14 in 2025 from over 1.6 in prior years. Profitability margins saw steady improvement, with net margin rising to 16.43%.
Are the Financial Ratios Favorable?
In 2025, profitability indicated strength with a favorable net margin and dividend yield at 3.36%. However, liquidity ratios like Current and Quick Ratios were unfavorable, raising red flags on short-term solvency. Leverage metrics, including Debt-to-Equity and Debt-to-Assets, were favorable, reflecting controlled debt levels. ROIC was deeply negative, signaling inefficiencies in capital use. Overall, ratios skew slightly unfavorable, cautioning investors.
Shareholder Return Policy
American Electric Power Company, Inc. maintains a consistent dividend payout, with a 2025 payout ratio around 56% and a 3.36% annual yield. Dividends per share have steadily increased, supported by strong free cash flow coverage and moderate share buybacks.
The payout aligns with sustainable value creation, balancing shareholder returns and reinvestment. Risks include potential pressure if free cash flow declines, but current metrics suggest disciplined capital allocation supporting long-term shareholder interests.
Score analysis
Below is a radar chart illustrating the company’s key financial scores across several valuation and performance metrics:
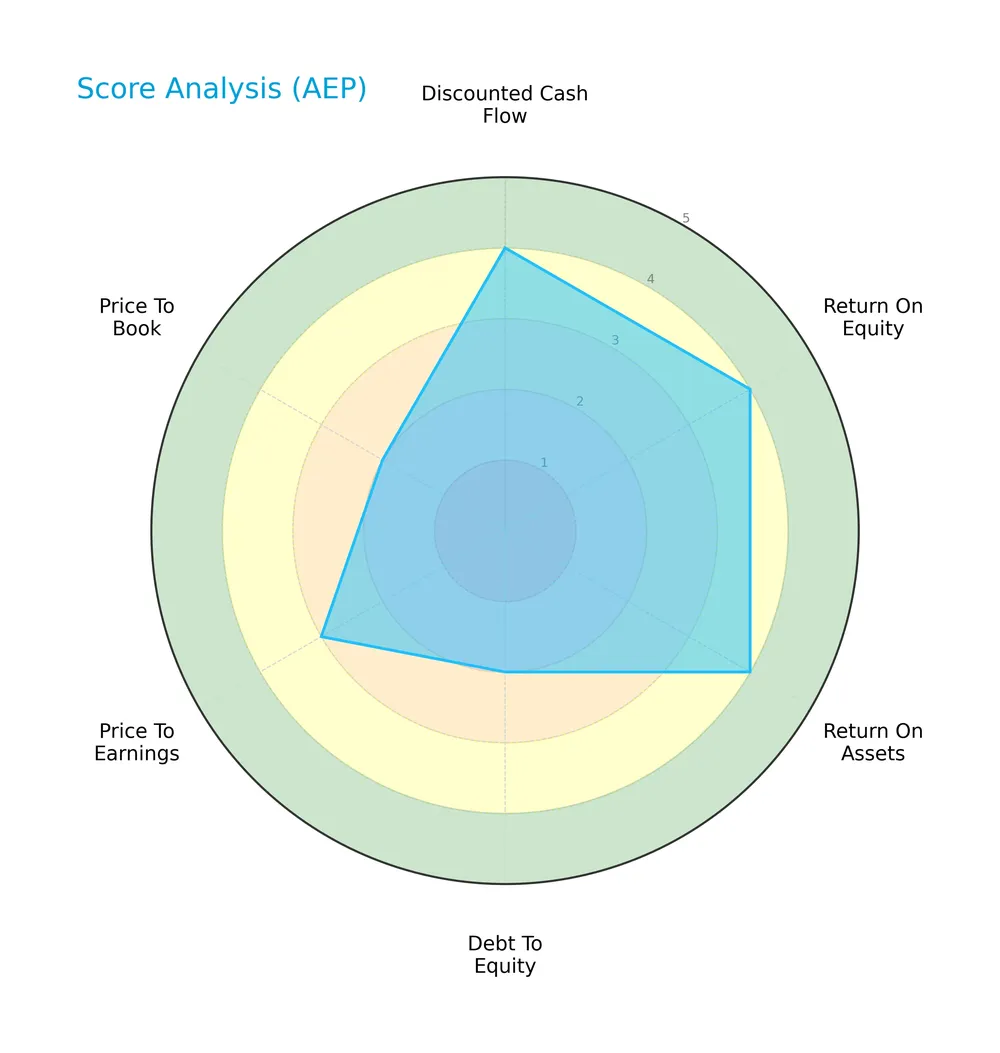
The company scores favorably on discounted cash flow, return on equity, and return on assets, each rated 4. However, its debt-to-equity and price-to-book ratios are less favorable at 2, signaling potential leverage and valuation concerns. Price-to-earnings stands moderate at 3.
Analysis of the company’s bankruptcy risk
The Altman Z-Score places the company in the distress zone, indicating a high risk of bankruptcy based on its current financial ratios:

Is the company in good financial health?
This Piotroski diagram summarizes the company’s financial health based on nine criteria evaluating profitability, liquidity, and efficiency:

With a Piotroski Score of 6, the company shows average financial strength, suggesting moderate health but room for improvement in operational or financial efficiency.
Competitive Landscape & Sector Positioning
This analysis examines American Electric Power Company, Inc.’s strategic positioning within the regulated electric sector. We will review its revenue streams, key products, and main competitors. I will assess whether AEP holds a competitive advantage over peers in this utility industry.
Strategic Positioning
American Electric Power Company, Inc. focuses on a vertically integrated utility model with diversified generation sources and strong transmission and distribution revenues totaling over 6B in 2025. Its U.S.-centric operations emphasize regulated electric utilities with stable, broad-based product exposure.
Revenue by Segment
This pie chart illustrates American Electric Power Company, Inc.’s revenue distribution by segment for the fiscal year 2025, highlighting the primary business drivers.
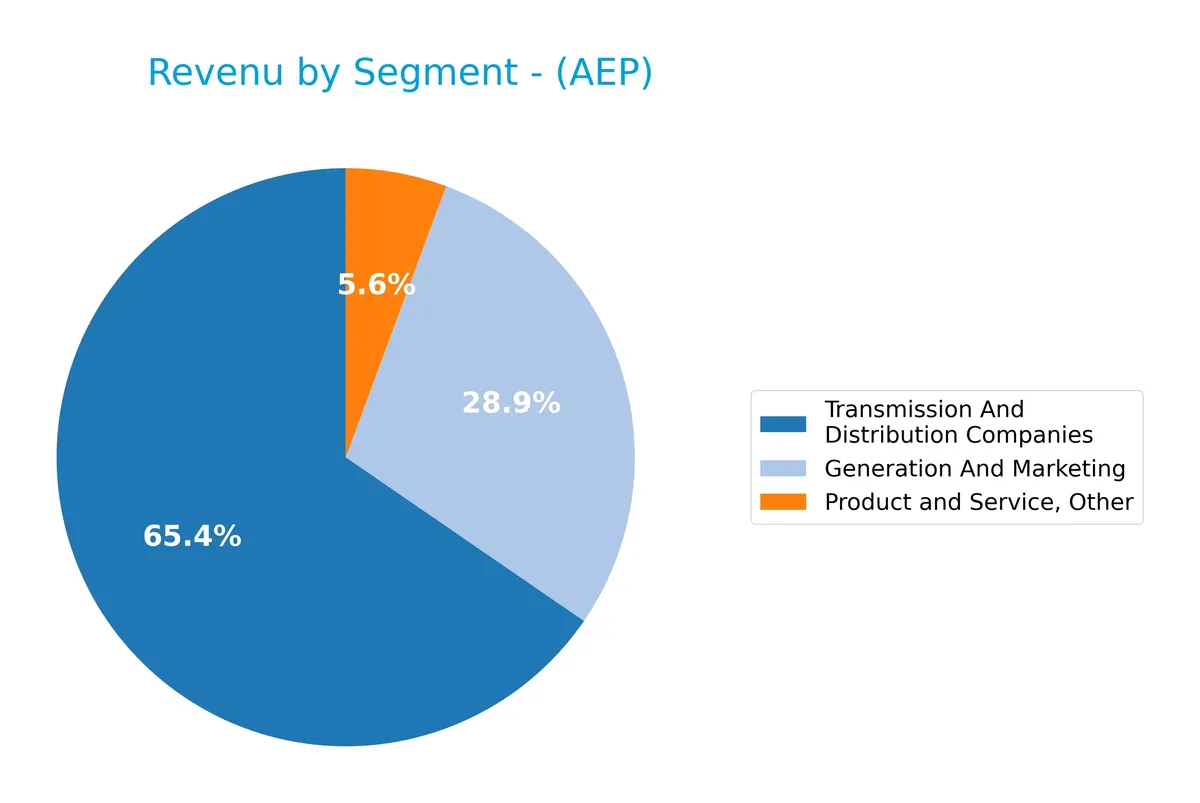
In 2025, Transmission and Distribution Companies dominate with $6.1B, reflecting steady growth and core utility strength. Generation and Marketing contributed $2.7B, showing acceleration versus prior years. Product and Service, Other at $526M remains a smaller but stable segment. The revenue mix underscores AEP’s reliance on regulated transmission, with Generation growing faster, signaling a potential shift towards diversified energy sources.
Key Products & Brands
The table below details American Electric Power Company’s principal products and brands by segment and function:
| Product | Description |
|---|---|
| Generation and Marketing | Produces electricity using coal, natural gas, nuclear, hydro, solar, wind, and other energy sources. |
| Transmission And Distribution Companies | Manages transmission and distribution infrastructure supplying retail and wholesale customers. |
| AEP Transmission Holdco | Operates transmission assets focused on delivering electricity across regional networks. |
| Vertically Integrated Utilities | Combines generation, transmission, and distribution services within regulated utility territories. |
| Product and Service, Other | Includes ancillary products and services related to electric power supply and marketing activities. |
American Electric Power’s portfolio spans generation to retail delivery, emphasizing regulated utilities and diversified energy sources. This integrated structure supports steady revenue streams across market cycles.
Main Competitors
The Utilities sector includes 23 competitors, with the table below showing the top 10 leaders by market capitalization:
| Competitor | Market Cap. |
|---|---|
| NextEra Energy, Inc. | 169B |
| The Southern Company | 96B |
| Duke Energy Corporation | 91B |
| American Electric Power Company, Inc. | 62B |
| Dominion Energy, Inc. | 51B |
| Exelon Corporation | 44B |
| Xcel Energy Inc. | 44B |
| Entergy Corporation | 42B |
| Public Service Enterprise Group Incorporated | 40B |
| Consolidated Edison, Inc. | 36B |
American Electric Power Company, Inc. ranks 4th among 23 competitors. Its market cap is 40.15% of the leader, NextEra Energy, Inc. The company stands above both the average market cap of the top 10 (67.5B) and the sector median (34B). It also maintains a significant 34.95% gap above its nearest competitor.
Comparisons with competitors
Check out how we compare the company to its competitors:
Does AEP have a competitive advantage?
American Electric Power Company, Inc. shows no competitive advantage as its ROIC significantly underperforms WACC, indicating value destruction and declining profitability. The company’s overall moat status is very unfavorable.
Looking ahead, AEP operates across diverse energy sources and markets, including retail and wholesale electricity. This broad presence offers potential growth opportunities through new energy projects and expanded transmission capabilities.
SWOT Analysis
This SWOT analysis highlights American Electric Power Company, Inc.’s key strategic factors to guide investor decisions.
Strengths
- strong revenue growth
- favorable net margin
- stable dividend yield
Weaknesses
- declining ROIC
- unfavorable liquidity ratios
- interest coverage concerns
Opportunities
- expanding renewable energy portfolio
- increasing demand for clean power
- regulatory support for grid modernization
Threats
- regulatory risks
- commodity price volatility
- competition from alternative energy providers
AEP’s strengths in revenue and net margin underpin its stable dividend, but value destruction and liquidity issues raise caution. The company must leverage clean energy trends while managing regulatory and market risks to sustain long-term growth.
Stock Price Action Analysis
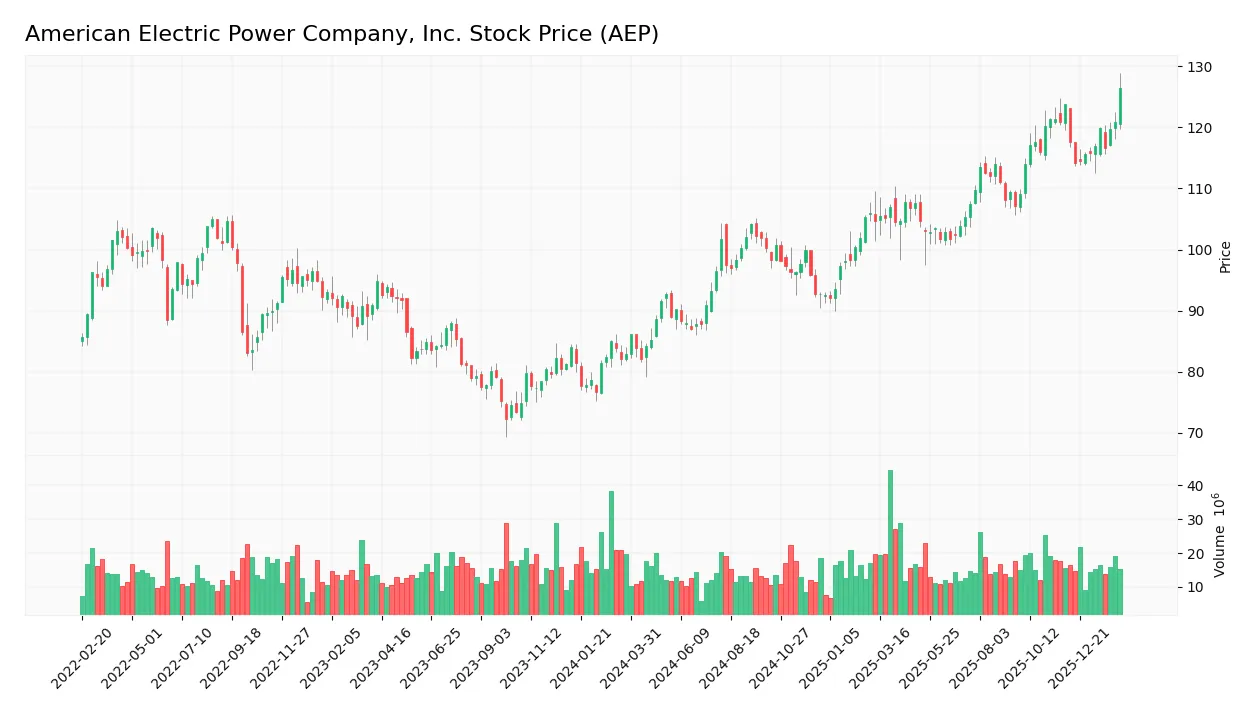
The weekly stock chart for American Electric Power Company, Inc. (AEP) highlights price movements over the past 100 weeks, illustrating significant trends and volatility patterns:
Trend Analysis
Over the past 100 weeks, AEP’s stock price rose by 52.42%, indicating a strong bullish trend with accelerating momentum. The price fluctuated between a low of 82.1 and a high of 126.43, with a volatility level shown by a 10.58 standard deviation. Recent weeks show a mild 2.15% increase, signaling a continuing but decelerated bullish trend.
Volume Analysis
Trading volume over the last three months increased, driven predominantly by buyers who accounted for 76.02% of activity. This strong buyer dominance suggests robust investor confidence and heightened market participation, reinforcing the positive trend in price action.
Target Prices
Analysts set a clear target price consensus for American Electric Power Company, Inc.
| Target Low | Target High | Consensus |
|---|---|---|
| 107 | 140 | 128.36 |
The target range reflects moderate optimism, with analysts expecting upside potential near 10% from current levels.

Don’t Let Luck Decide Your Entry Point
Optimize your entry points with our advanced ProRealTime indicators. You’ll get efficient buy signals with precise price targets for maximum performance. Start outperforming now!
Analyst & Consumer Opinions
This section examines analyst ratings and consumer feedback to assess American Electric Power Company, Inc.’s market perception and reputation.
Stock Grades
Here are the latest verified analyst grades for American Electric Power Company, Inc. from established financial institutions:
| Grading Company | Action | New Grade | Date |
|---|---|---|---|
| Barclays | Maintain | Equal Weight | 2026-01-22 |
| Wells Fargo | Maintain | Overweight | 2026-01-20 |
| B of A Securities | Downgrade | Neutral | 2026-01-12 |
| UBS | Maintain | Sell | 2025-12-17 |
| JP Morgan | Maintain | Neutral | 2025-12-12 |
| Jefferies | Upgrade | Buy | 2025-11-17 |
| Citigroup | Maintain | Neutral | 2025-10-31 |
| BMO Capital | Downgrade | Market Perform | 2025-10-30 |
| Scotiabank | Maintain | Sector Perform | 2025-10-30 |
| Evercore ISI Group | Maintain | Outperform | 2025-10-30 |
The overall trend shows a mixed stance with several firms maintaining neutral or hold-equivalent ratings, while a few upgrades and downgrades reflect moderate divergence. The consensus leans toward a buy, supported by 18 buy ratings against 15 holds and only 1 sell.
Consumer Opinions
American Electric Power Company, Inc. (AEP) garners mixed consumer sentiment, reflecting its vital role yet operational challenges.
| Positive Reviews | Negative Reviews |
|---|---|
| Reliable electricity supply with minimal outages. | Customer service response times are slow. |
| Competitive pricing compared to regional peers. | Occasional billing errors frustrate consumers. |
| Strong commitment to renewable energy projects. | Infrastructure upgrades cause frequent disruptions. |
Overall, consumers appreciate AEP’s reliability and green initiatives. However, complaints about customer service and billing inconsistencies recur, signaling areas needing improvement.
Risk Analysis
Below is a concise summary of key risks American Electric Power Company, Inc. faces, highlighting likelihood and impact:
| Category | Description | Probability | Impact |
|---|---|---|---|
| Financial Stability | Altman Z-Score in distress zone (1.05) signals high bankruptcy risk. | High | Severe |
| Liquidity | Current and quick ratios at zero indicate critical short-term liquidity issues. | High | Severe |
| Profitability | ROIC at -54.56% well below WACC of 6.42%, suggesting value destruction. | Medium | High |
| Debt Management | Favorable debt-to-equity ratio (0.14) but weak interest coverage (-0.0). | Medium | Moderate |
| Market Volatility | Beta of 0.623 indicates low price volatility relative to market. | Low | Low |
The most pressing concerns are liquidity and financial distress risks. The zero liquidity ratios and Altman Z-Score below 1.8 are red flags historically tied to default in regulated utilities. Despite a stable dividend yield of 3.36%, capital allocation inefficiency, as seen in the negative ROIC, may erode long-term shareholder value.
Should You Buy American Electric Power Company, Inc.?
American Electric Power appears to be managing a challenging leverage profile with substantial debt concerns. Despite moderate profitability and operational efficiency, its competitive moat seems very unfavorable due to declining value creation. The overall B+ rating suggests cautious optimism.
Strength & Efficiency Pillars
American Electric Power Company, Inc. posts a solid net margin of 16.43%, reflecting effective cost control and pricing power. Its return on equity of 11.55% is moderate but stable, supporting shareholder value. The company benefits from a favorable weighted average cost of capital at 6.42%. However, a deeply negative ROIC of -54.56% signals operational inefficiency. Since ROIC is well below WACC, the firm is currently a value destroyer rather than a creator.
Weaknesses and Drawbacks
AEP is in financial distress with an Altman Z-Score of 1.05, placing it squarely in the distress zone and signaling a substantial bankruptcy risk. Liquidity concerns are critical, as both current and quick ratios stand at zero, indicating potential short-term solvency issues. Despite low debt-to-equity at 0.14, the interest coverage ratio is negative, flagging difficulties meeting interest obligations. Valuation metrics appear neutral but do not offset the solvency warning.
Our Final Verdict about American Electric Power Company, Inc.
Despite a favorable net margin and bullish stock trend, the Altman Z-Score exposes significant solvency risk, making AEP a highly speculative investment. Operational strengths may exist, but the financial distress signal dominates the risk profile. Conservative investors should consider the company’s profile too risky, awaiting clearer signs of financial stability before commitment.
Disclaimer: This content is for informational purposes only and does not constitute financial, investment, or other professional advice. Investing in financial markets involves a significant risk of loss, and past performance is not indicative of future results.
Additional Resources
- AEP expands spending plan as it doubles data center electricity demand deals – Reuters (Feb 12, 2026)
- American Electric Power (AEP) Exceeds Earnings Expectations and Boosts Dividend – GuruFocus (Feb 12, 2026)
- AMERICAN ELECTRIC POWER CO ($AEP) Releases Q4 2025 Earnings – Quiver Quantitative (Feb 12, 2026)
- American Electric Power Q4 Earnings Call Highlights – Yahoo Finance (Feb 12, 2026)
- American Electric Power (NASDAQ:AEP) Reaches New 52-Week High Following Strong Earnings – MarketBeat (Feb 12, 2026)
For more information about American Electric Power Company, Inc., please visit the official website: aep.com