Home > Analyses > Utilities > Ameren Corporation
Ameren Corporation powers millions across the Midwest, shaping how communities access energy daily. It dominates the regulated electric and natural gas markets with a balanced mix of coal, nuclear, and renewables. Known for operational reliability and steady innovation, Ameren sustains essential infrastructure while evolving toward cleaner energy. As the utility sector faces transformative pressures, I ask: does Ameren’s solid foundation and strategic direction justify its current valuation and growth prospects?

Table of contents
Business Model & Company Overview
Ameren Corporation, founded in 1881 and headquartered in St. Louis, Missouri, stands as a dominant player in the regulated electric utility sector. Its integrated ecosystem spans electric generation, transmission, and distribution, alongside natural gas services across multiple segments, including Ameren Missouri and Ameren Illinois. Ameren blends traditional coal, nuclear, and natural gas with renewable sources like wind and solar to meet diverse customer needs. This cohesive approach supports residential, commercial, and industrial clients with reliable energy solutions.
Ameren’s revenue engine balances rate-regulated electric and natural gas operations, generating steady cash flows from its diversified portfolio. The company’s footprint in the U.S. Midwest anchors its strategic presence in critical markets. Its regulated business model ensures predictability amid energy transitions. Ameren’s economic moat stems from its regulated status and multi-source generation, positioning it to shape the evolving utility landscape and secure long-term value for stakeholders.
Financial Performance & Fundamental Metrics
I analyze Ameren Corporation’s income statement, key financial ratios, and dividend payout policy to assess its profitability, efficiency, and shareholder returns.
Income Statement
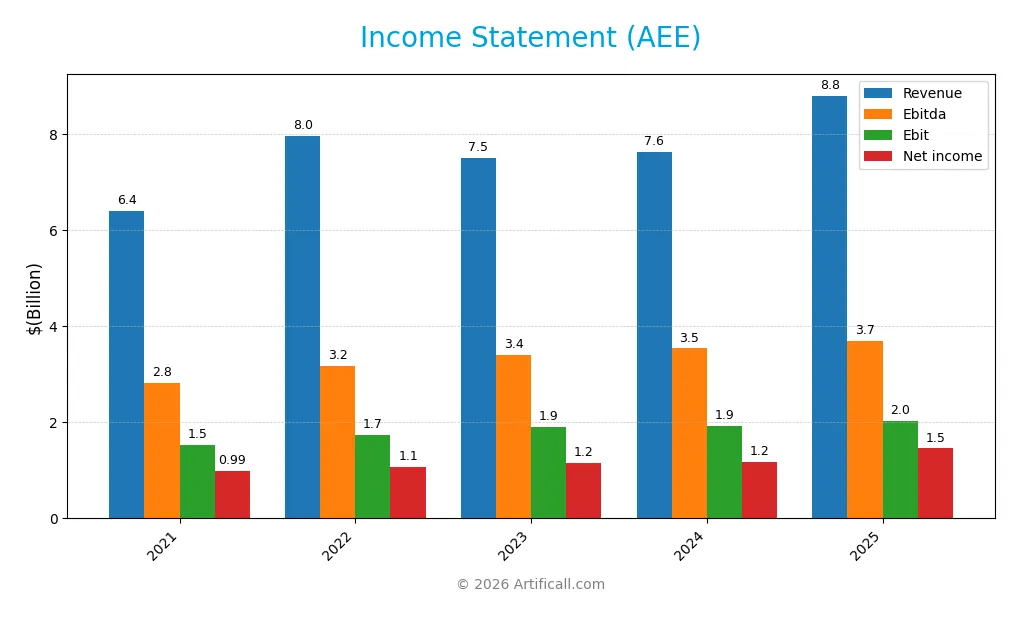
This table displays Ameren Corporation’s key income statement figures for fiscal years 2021 through 2025, reflecting revenue, expenses, profitability, and earnings per share.
| 2021 | 2022 | 2023 | 2024 | 2025 | |
|---|---|---|---|---|---|
| Revenue | 6.39B | 7.96B | 7.50B | 7.62B | 8.80B |
| Cost of Revenue | 3.40B | 4.61B | 4.03B | 3.97B | 6.20B |
| Operating Expenses | 1.66B | 1.83B | 1.91B | 2.14B | 577M |
| Gross Profit | 2.99B | 3.34B | 3.47B | 3.65B | 2.60B |
| EBITDA | 2.81B | 3.18B | 3.41B | 3.54B | 3.69B |
| EBIT | 1.54B | 1.74B | 1.91B | 1.93B | 2.03B |
| Interest Expense | 383M | 486M | 566M | 663M | 776M |
| Net Income | 990M | 1.07B | 1.15B | 1.18B | 1.46B |
| EPS | 3.86 | 4.16 | 4.38 | 4.43 | 5.38 |
| Filing Date | 2022-02-23 | 2023-02-22 | 2024-02-29 | 2025-02-18 | 2026-02-18 |
Income Statement Evolution
Ameren Corporation’s revenue rose 37.6% from 2021 to 2025, with a 15.4% increase in the latest year. Net income grew 47.1% overall and 23.2% in the past two years. Despite a 28.7% drop in gross profit last year, the company maintained stable and favorable margins, including a 16.6% net margin in 2025, reflecting consistent profitability.
Is the Income Statement Favorable?
In 2025, Ameren posted $8.8B revenue and $1.46B net income, achieving a 16.6% net margin, favorable by industry standards. EBIT margin stood at 23.0%, supported by disciplined operating expenses growing in line with revenue. Interest expense remains moderate at 8.8% of revenue. Overall, the fundamentals show strong earnings growth and profitability, though the recent gross profit decline deserves monitoring.
Financial Ratios
The table below presents key financial ratios for Ameren Corporation (AEE) over the fiscal years 2021 to 2025, offering insight into profitability, liquidity, leverage, and market valuation:
| Ratios | 2021 | 2022 | 2023 | 2024 | 2025 |
|---|---|---|---|---|---|
| Net Margin | 15.5% | 13.5% | 15.4% | 15.5% | 16.5% |
| ROE | 10.2% | 10.2% | 10.2% | 9.8% | 10.9% |
| ROIC | 3.4% | 3.6% | 3.5% | 3.3% | 4.0% |
| P/E | 23.0 | 21.4 | 16.5 | 20.1 | 18.6 |
| P/B | 2.35 | 2.19 | 1.68 | 1.96 | 2.02 |
| Current Ratio | 0.70 | 0.79 | 0.65 | 0.66 | 0.66 |
| Quick Ratio | 0.49 | 0.59 | 0.43 | 0.44 | 0.46 |
| D/E | 1.40 | 1.44 | 1.45 | 1.55 | 1.48 |
| Debt-to-Assets | 38.1% | 39.8% | 40.4% | 41.9% | 40.9% |
| Interest Coverage | 3.48 | 3.12 | 2.75 | 2.29 | 2.61 |
| Asset Turnover | 0.18 | 0.21 | 0.18 | 0.17 | 0.18 |
| Fixed Asset Turnover | 0.22 | 0.25 | 0.22 | 0.21 | 0.22 |
| Dividend Yield | 2.5% | 2.7% | 3.5% | 3.0% | 2.8% |
Evolution of Financial Ratios
Ameren Corporation’s Return on Equity (ROE) showed modest improvement, rising from about 9.76% in 2024 to 10.86% in 2025. The Current Ratio remained persistently low, around 0.66, signaling tight liquidity. Debt-to-Equity Ratio stayed elevated near 1.48, reflecting consistent leverage. Profit margins showed stable but modest growth, with net margin improving to 16.55%.
Are the Financial Ratios Favorable?
Profitability ratios are mixed: net margin and dividend yield are favorable at 16.55% and 2.84%, respectively, while ROE and P/E ratio are neutral. Liquidity ratios, including current and quick ratios, are unfavorable, indicating potential short-term liquidity risks. Leverage is high with an unfavorable debt-to-equity ratio of 1.48, and asset turnover ratios suggest efficiency challenges. Overall, the financial ratios present a slightly unfavorable profile.
Shareholder Return Policy
Ameren Corporation maintains a consistent dividend payout ratio near 53%, with dividends per share rising from $2.20 in 2021 to $2.84 in 2025. The annual dividend yield averaged around 2.8%, supported by steady share buybacks, though free cash flow coverage remains negative, indicating potential distribution risk.
The company’s payout aligns with its stable net profit margin of about 16%, but negative free cash flow per share and capital expenditure exceeding operating cash flow suggest caution. This distribution strategy balances shareholder returns and reinvestment, yet the sustainability depends on improving cash generation relative to capital spending.
Score analysis
The following radar chart presents key financial scores for Ameren Corporation, highlighting strengths and weaknesses across valuation and profitability metrics:
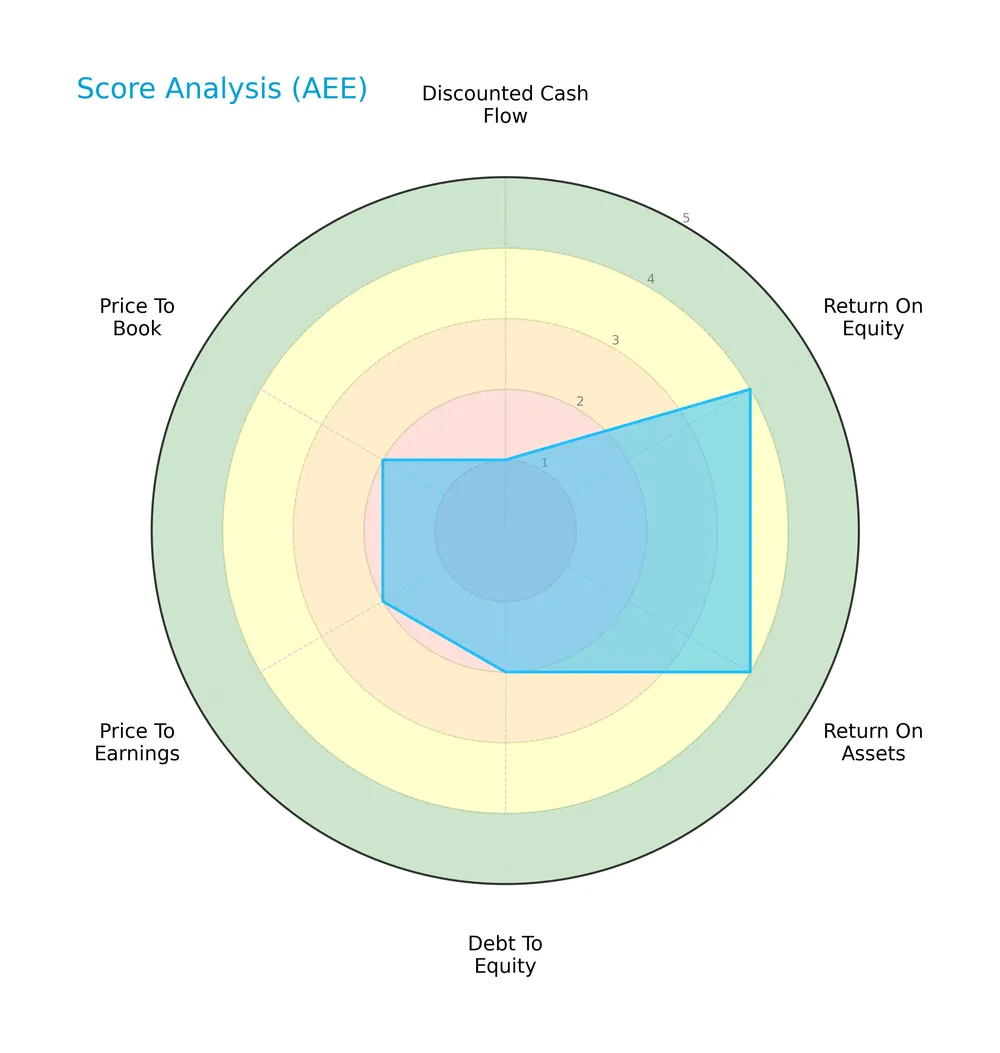
Ameren scores well on return on equity and assets, reflecting solid profitability. However, its discounted cash flow, debt-to-equity, price-to-earnings, and price-to-book scores indicate unfavorable valuation and leverage concerns.
Analysis of the company’s bankruptcy risk
Ameren’s Altman Z-Score places it in the distress zone, signaling a high risk of financial distress and potential bankruptcy:

Is the company in good financial health?
The Piotroski Score diagram illustrates Ameren’s moderate financial health status:

With a Piotroski Score of 5, Ameren shows average financial strength, neither clearly strong nor weak, indicating a balanced but cautious outlook on its financial condition.
Competitive Landscape & Sector Positioning
This section analyzes Ameren Corporation’s strategic positioning, revenue segments, key products, and main competitors. I will assess whether Ameren holds a competitive advantage within the regulated electric utility sector.
Strategic Positioning
Ameren concentrates primarily on regulated electric generation and natural gas distribution in the US, with electricity revenues at $7.7B and natural gas at $1.1B in 2025. Its operations span Missouri and Illinois through four segments, reflecting geographic focus and sector specialization.
Revenue by Segment
This pie chart illustrates Ameren Corporation’s revenue breakdown by segment for fiscal year 2025, highlighting the company’s primary income sources.
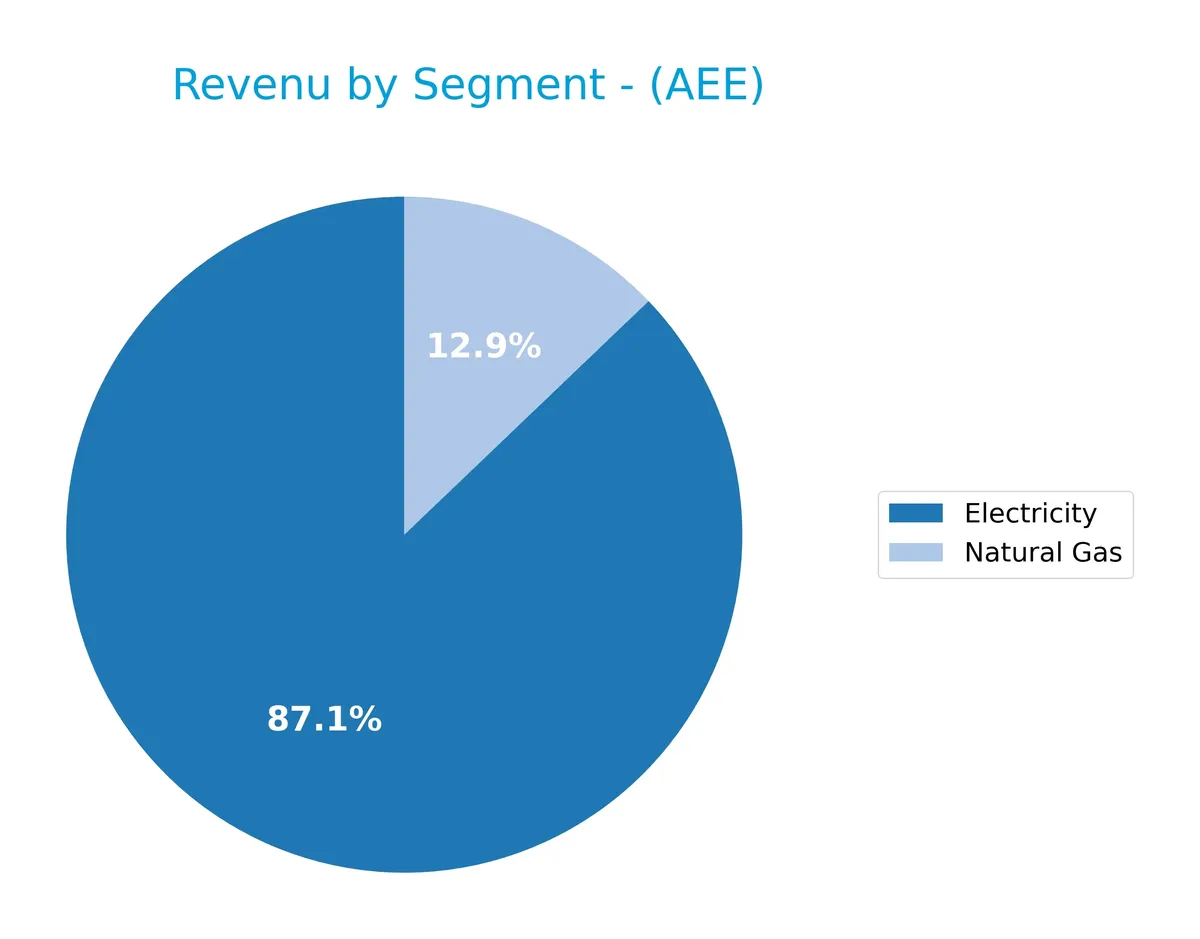
Electricity dominates Ameren’s revenue with $7.7B in 2025, showing steady growth since 2021. Natural Gas contributes $1.1B, remaining relatively stable. The trend reflects the company’s solid utility focus, with electricity as the main driver. The 2025 acceleration in electricity revenue signals stronger demand or pricing power, though reliance on two segments suggests moderate concentration risk.
Key Products & Brands
The following table outlines Ameren Corporation’s core products and brands with their brief descriptions:
| Product | Description |
|---|---|
| Electricity | Rate-regulated electric generation, transmission, and distribution primarily via coal, nuclear, natural gas, and renewable sources. |
| Natural Gas | Rate-regulated natural gas distribution and transmission services to residential, commercial, and industrial customers. |
| Ameren Missouri | Subsidiary segment focused on electric and natural gas services in Missouri. |
| Ameren Illinois Electric Distribution | Segment delivering electric distribution services in Illinois. |
| Ameren Illinois Natural Gas | Segment managing natural gas distribution and transmission in Illinois. |
| Ameren Transmission | Segment responsible for electric transmission operations. |
Ameren’s product portfolio centers on regulated electricity and natural gas services across Missouri and Illinois. Its diversified generation mix includes traditional and renewable sources, reflecting a balanced approach in energy supply.
Main Competitors
There are 23 competitors in the Regulated Electric industry; the table lists the top 10 leaders by market capitalization:
| Competitor | Market Cap. |
|---|---|
| NextEra Energy, Inc. | 169B |
| The Southern Company | 96B |
| Duke Energy Corporation | 91B |
| American Electric Power Company, Inc. | 62B |
| Dominion Energy, Inc. | 51B |
| Exelon Corporation | 44B |
| Xcel Energy Inc. | 44B |
| Entergy Corporation | 42B |
| Public Service Enterprise Group Incorporated | 40B |
| Consolidated Edison, Inc. | 36B |
Ameren Corporation ranks 13th among 23 competitors in the sector. It holds 17.4% of the market cap of the leader, NextEra Energy. Ameren is below both the average market cap of the top 10 (67.5B) and the sector median (34B). The company is 16.22% smaller than the next competitor above it, reflecting a moderate gap in scale.
Comparisons with competitors
Check out how we compare the company to its competitors:
Does Ameren have a competitive advantage?
Ameren currently lacks a strong competitive advantage as its ROIC falls below WACC, indicating value destruction despite growing profitability. This signals challenges in efficiently deploying capital compared to peers.
Looking ahead, Ameren’s regulated electric and natural gas segments, combined with renewable energy expansion, offer growth opportunities. These could enhance its market position if capital efficiency improves over time.
SWOT Analysis
This SWOT analysis highlights Ameren Corporation’s strategic position and key challenges to inform investment decisions.
Strengths
- Stable regulated utility business
- Diverse energy generation including renewables
- Consistent revenue and net income growth
Weaknesses
- ROIC below WACC, indicating value destruction
- Low liquidity ratios (current and quick)
- High debt-to-equity ratio
Opportunities
- Growing demand for clean energy
- Potential regulatory support for renewables
- Expansion in transmission infrastructure
Threats
- Regulatory risks and rate pressures
- Commodity price volatility
- Economic slowdown impacting demand
Ameren’s stable regulated model and renewable investments provide a solid base. However, its value destruction and liquidity concerns require caution. Strategic focus should emphasize improving capital efficiency and leveraging renewable growth while managing debt and regulatory risks.
Stock Price Action Analysis
The weekly stock chart of Ameren Corporation (AEE) highlights recent price momentum and volatility patterns over the past 12 months:
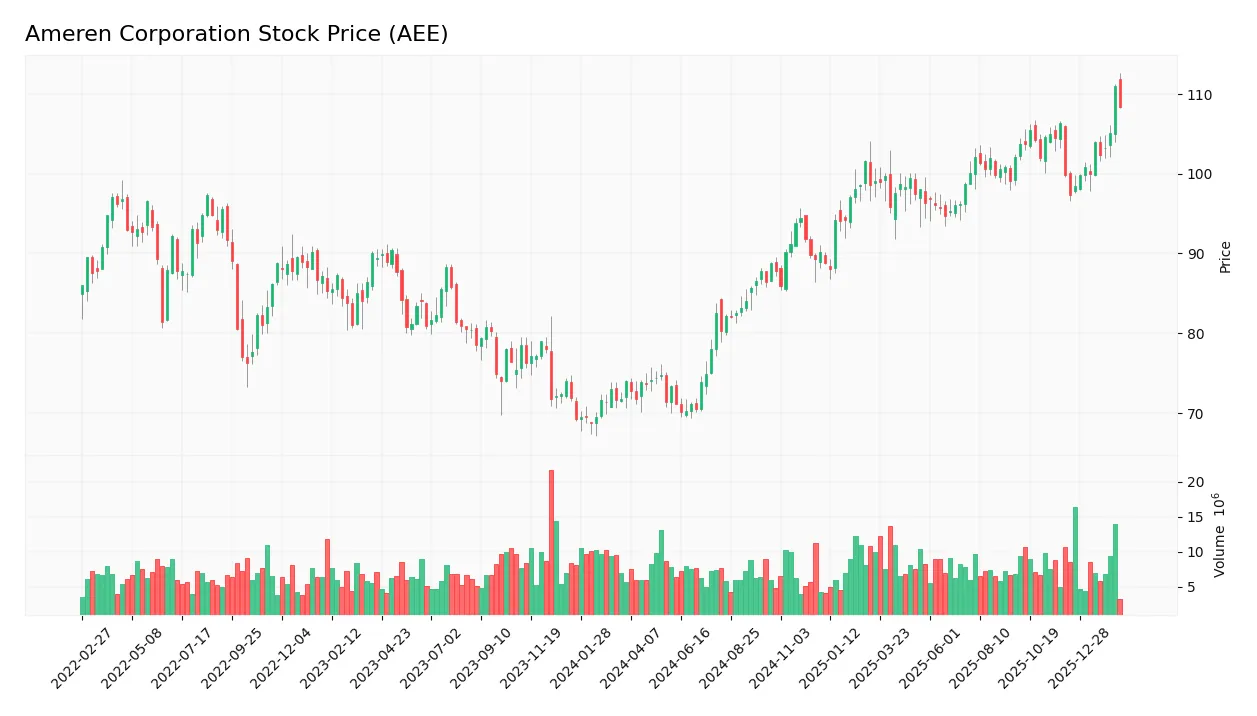
Trend Analysis
Over the past 12 months, AEE’s stock price increased by 46.44%, signaling a clear bullish trend with acceleration. The price ranged from a low of 70.12 to a high of 110.97, reflecting significant upward momentum. Volatility remains elevated, with a standard deviation of 10.96.
Volume Analysis
In the last three months, trading volume shows a decreasing trend despite buyer dominance at 63%. Buyers account for a majority of trades, suggesting sustained investor confidence but potentially waning participation. This signals cautious optimism with lower market engagement.
Target Prices
Analysts set a clear target consensus for Ameren Corporation, reflecting moderate upside potential.
| Target Low | Target High | Consensus |
|---|---|---|
| 104 | 120 | 112.75 |
The target range suggests steady growth expectations, with a consensus price indicating confidence in Ameren’s stability and sector positioning.

Don’t Let Luck Decide Your Entry Point
Optimize your entry points with our advanced ProRealTime indicators. You’ll get efficient buy signals with precise price targets for maximum performance. Start outperforming now!
Analyst & Consumer Opinions
This section examines Ameren Corporation’s recent analyst ratings alongside key consumer feedback to gauge market sentiment.
Stock Grades
Here is a concise overview of the latest verified stock grades for Ameren Corporation from leading financial institutions:
| Grading Company | Action | New Grade | Date |
|---|---|---|---|
| BMO Capital | Maintain | Outperform | 2026-02-13 |
| Wells Fargo | Maintain | Overweight | 2026-02-13 |
| Wells Fargo | Maintain | Overweight | 2026-01-20 |
| Barclays | Maintain | Equal Weight | 2026-01-15 |
| JP Morgan | Maintain | Neutral | 2026-01-15 |
| UBS | Maintain | Buy | 2025-12-17 |
| Keybanc | Downgrade | Sector Weight | 2025-12-12 |
| Mizuho | Maintain | Outperform | 2025-10-27 |
| Morgan Stanley | Maintain | Equal Weight | 2025-10-22 |
| Barclays | Maintain | Equal Weight | 2025-10-21 |
The consensus reflects a stable outlook with most firms maintaining current ratings. The grades cluster around moderate positive views, with a slight tilt toward hold and overweight positions.
Consumer Opinions
Ameren Corporation draws mixed reactions from its customer base, reflecting evolving expectations in the energy sector.
| Positive Reviews | Negative Reviews |
|---|---|
| Reliable power supply with minimal outages | Customer service response times often slow |
| Transparent billing and clear communication | High electricity rates compared to some competitors |
| Commitment to sustainability and clean energy projects | Occasional billing errors reported |
Overall, consumers appreciate Ameren’s reliability and environmental initiatives. However, slow customer service and pricing remain notable pain points that could impact long-term satisfaction.
Risk Analysis
The table below summarizes key risks facing Ameren Corporation, highlighting their likelihood and potential impact:
| Category | Description | Probability | Impact |
|---|---|---|---|
| Financial Health | Altman Z-Score at 0.96 signals distress zone, indicating potential bankruptcy risk | High | High |
| Liquidity | Current ratio of 0.66 and quick ratio of 0.46 show weak short-term liquidity | Medium | Medium |
| Leverage | Debt-to-equity ratio of 1.48 suggests elevated financial leverage | Medium | Medium |
| Profitability | ROIC at 4.01% below WACC of 5.23% indicates value destruction | Medium | High |
| Valuation | PE and PB ratios neutral but price-based scores unfavorable, signaling valuation risk | Medium | Medium |
| Market Volatility | Beta of 0.59 implies below-market volatility but still some sensitivity to market swings | Low | Low |
Ameren’s most pressing risks stem from its distress-level Altman Z-Score and unfavorable returns on invested capital. These factors raise red flags about financial stability and long-term value creation. The company’s tight liquidity and high leverage compound vulnerability during economic downturns. Investors must weigh these headwinds carefully against the utility’s stable dividend yield and moderate market volatility.
Should You Buy Ameren Corporation?
Ameren appears to be in a slight value destruction phase despite improving profitability and operational efficiency. Its leverage profile signals substantial risk, aligning with a distress-zone Altman Z-Score. Overall, the firm suggests a moderate investment profile rated B-.
Strength & Efficiency Pillars
Ameren Corporation shows solid operational profitability with a net margin of 16.55% and an EBIT margin of 23.03%. The company’s return on equity stands at a neutral 10.86%, reflecting moderate shareholder returns. However, its return on invested capital (ROIC) of 4.01% falls below the weighted average cost of capital (WACC) of 5.23%, indicating that Ameren currently destroys value despite improving profitability trends. This suggests operational strength but challenges in capital efficiency.
Weaknesses and Drawbacks
The company is in financial distress, with an Altman Z-Score of 0.96, signaling a high bankruptcy risk. Leverage remains elevated, with a debt-to-equity ratio of 1.48 and weak liquidity, as the current ratio is only 0.66. These figures highlight Ameren’s vulnerability to adverse market conditions and refinancing risks. Valuation metrics are neutral but on the expensive side, with a P/E of 18.55 and P/B of 2.02, which may limit upside amid financial uncertainty.
Our Final Verdict about Ameren Corporation
Despite operational profitability and a bullish long-term price trend, Ameren’s solvency risk, evidenced by its distressed Altman Z-Score, makes the stock highly speculative. The company may appear attractive from an earnings growth perspective, but the elevated bankruptcy risk warrants caution. Investors seeking stability might find this profile too risky for conservative capital allocation at present.
Disclaimer: This content is for informational purposes only and does not constitute financial, investment, or other professional advice. Investing in financial markets involves a significant risk of loss, and past performance is not indicative of future results.
Additional Resources
- Decoding Ameren Corp (AEE): A Strategic SWOT Insight – GuruFocus (Feb 19, 2026)
- Ameren Corporation (AEE): A Bull Case Theory – Yahoo Finance (Feb 04, 2026)
- Ameren Corporation Just Beat Earnings Expectations: Here’s What Analysts Think Will Happen Next – simplywall.st (Feb 14, 2026)
- Ameren Corporation (NYSE:AEE) Q4 2025 Earnings Call Transcript – Insider Monkey (Feb 13, 2026)
- Ameren Corporation increases quarterly cash dividend by 5.6 percent, marking 13 consecutive years of growth – PR Newswire (Feb 06, 2026)
For more information about Ameren Corporation, please visit the official website: ameren.com