Home > Analyses > Consumer Cyclical > Amcor plc
Amcor plc transforms everyday experiences by delivering innovative packaging solutions that safeguard food, beverages, and personal care products worldwide. As a global powerhouse in flexible and rigid packaging, Amcor’s cutting-edge designs and commitment to sustainability set industry standards and influence consumer markets across continents. With a robust presence and a reputation for quality, the key question for investors is whether Amcor’s solid fundamentals and market leadership continue to support its growth trajectory and justify its current valuation.

Table of contents
Business Model & Company Overview
Amcor plc, founded in 2018 and headquartered in Zürich, Switzerland, stands as a global leader in the packaging & containers industry. With a workforce of 41K employees, it delivers an integrated ecosystem through its two main segments: Flexibles and Rigid Packaging. These segments serve diverse sectors, from food and beverage to medical and personal care, underlining its core mission to provide innovative packaging solutions worldwide.
The company’s revenue engine is driven by a balanced mix of flexible film products and rigid containers, catering to markets across the Americas, Europe, Latin America, Africa, and Asia Pacific. Amcor’s direct sales force ensures strong customer relationships and recurring demand. This broad geographic footprint and product diversity form a robust competitive advantage, positioning Amcor to shape the future of sustainable packaging globally.
Financial Performance & Fundamental Metrics
This section provides a detailed analysis of Amcor plc’s income statement, key financial ratios, and dividend payout policy to guide investment decisions.
Income Statement
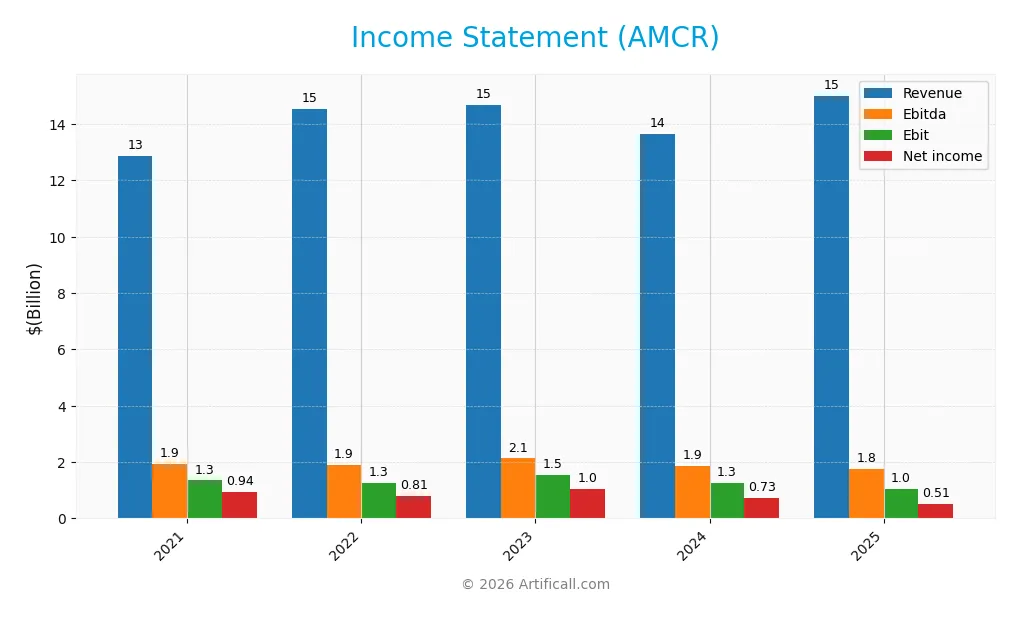
The following table presents Amcor plc’s key income statement figures for the fiscal years 2021 through 2025, reported in USD.
| 2021 | 2022 | 2023 | 2024 | 2025 | |
|---|---|---|---|---|---|
| Revenue | 12.9B | 14.5B | 14.7B | 13.6B | 15.0B |
| Cost of Revenue | 10.1B | 11.7B | 12.0B | 10.9B | 12.2B |
| Operating Expenses | 1.4B | 1.6B | 1.2B | 1.5B | 1.8B |
| Gross Profit | 2.7B | 2.8B | 2.7B | 2.7B | 2.8B |
| EBITDA | 1.9B | 1.9B | 2.1B | 1.9B | 1.8B |
| EBIT | 1.3B | 1.3B | 1.5B | 1.3B | 1.0B |
| Interest Expense | 153M | 159M | 290M | 348M | 396M |
| Net Income | 939M | 805M | 1.0B | 730M | 511M |
| EPS | 3.00 | 2.65 | 3.55 | 2.55 | 1.60 |
| Filing Date | 2021-08-24 | 2022-08-18 | 2023-08-17 | 2024-08-16 | 2025-08-15 |
Income Statement Evolution
Between 2021 and 2025, Amcor plc’s revenue demonstrated a positive trend, growing overall by 16.7% with a 10.04% increase in the latest year. However, net income declined significantly by 45.58% over the period and dropped 36.38% year-on-year. Gross margin remained stable at a neutral 18.88%, while EBIT and net margins showed declines, reflecting margin pressure despite revenue expansion.
Is the Income Statement Favorable?
For fiscal 2025, Amcor reported revenue of 15B USD, up 10% from 2024, yet net income fell to 511M USD, a 36% decrease. EBIT margin stood at 6.97% and net margin at 3.4%, both evaluated as neutral. Interest expense improved favorably to 2.64% of revenue. Despite revenue growth, operating expenses grew proportionally, and net margin contraction signals challenges in profitability, resulting in an overall unfavorable income statement evaluation.
Financial Ratios
The following table presents key financial ratios for Amcor plc over the fiscal years 2021 to 2025, offering a snapshot of profitability, valuation, liquidity, leverage, and efficiency metrics:
| Ratios | 2021 | 2022 | 2023 | 2024 | 2025 |
|---|---|---|---|---|---|
| Net Margin | 7.30% | 5.53% | 7.13% | 5.35% | 3.40% |
| ROE | 19.71% | 19.72% | 26.03% | 18.81% | 4.36% |
| ROIC | 8.01% | 7.26% | 10.11% | 8.05% | 2.64% |
| P/E | 18.93 | 23.38 | 13.98 | 18.92 | 28.58 |
| P/B | 3.73 | 4.61 | 3.64 | 3.56 | 1.25 |
| Current Ratio | 1.21 | 1.15 | 1.19 | 1.17 | 1.21 |
| Quick Ratio | 0.75 | 0.67 | 0.69 | 0.69 | 0.71 |
| D/E | 1.42 | 1.71 | 1.79 | 1.85 | 1.28 |
| Debt-to-Assets | 39.28% | 40.07% | 42.40% | 43.49% | 40.49% |
| Interest Coverage | 8.63 | 7.79 | 5.20 | 3.49 | 2.55 |
| Asset Turnover | 0.75 | 0.83 | 0.86 | 0.83 | 0.40 |
| Fixed Asset Turnover | 3.00 | 3.46 | 3.42 | 3.15 | 1.61 |
| Dividend Yield | 4.17% | 3.89% | 4.93% | 5.23% | 5.79% |
Evolution of Financial Ratios
Return on Equity (ROE) for Amcor plc declined significantly from 26.0% in 2023 to 4.36% in 2025, indicating a marked decrease in profitability. The Current Ratio remained relatively stable around 1.2, reflecting consistent short-term liquidity. Meanwhile, the Debt-to-Equity Ratio increased from 1.79 in 2023 to 1.28 in 2025, showing a moderate reduction in leverage but still at elevated levels.
Are the Financial Ratios Fovorable?
In 2025, Amcor’s profitability ratios, including net margin (3.4%) and ROE (4.36%), are unfavorable, indicating weaker earnings generation. Liquidity, with a current ratio of 1.21, is neutral but quick ratio is unfavorable at 0.71, suggesting some short-term liquidity constraints. Leverage remains high with a debt-to-equity ratio of 1.28, classified as unfavorable, while asset turnover at 0.4 is also unfavorable. Market valuation ratios show mixed signals: price-to-book is favorable at 1.25, but price-to-earnings is unfavorable at 28.58. Overall, the financial ratios are slightly unfavorable.
Shareholder Return Policy
Amcor plc maintains a consistent dividend policy with a payout ratio above 100% in 2025, supported by a 5.79% annual dividend yield and a stable dividend per share trend around $2.65. The dividend payments are nearly covered by free cash flow, but the high payout ratio suggests potential sustainability risks.
The company also engages in share buybacks, complementing its shareholder returns. While this distribution strategy offers attractive yields, the elevated payout ratio and leverage levels require monitoring to ensure long-term value creation remains sustainable for shareholders.
Score analysis
The following radar chart presents an overview of Amcor plc’s key financial scores and valuation metrics:

Amcor plc shows a favorable discounted cash flow score of 4 and price-to-book score of 4, indicating attractive valuation metrics. However, profitability scores such as return on equity and return on assets are moderate at 2, while the debt-to-equity score is very unfavorable at 1, reflecting higher leverage risk.
Analysis of the company’s bankruptcy risk
Amcor plc’s Altman Z-Score places it in the distress zone, signaling a high probability of financial distress and potential bankruptcy risk:

Is the company in good financial health?
The Piotroski Score diagram provides insight into Amcor plc’s financial strength based on profitability, leverage, and efficiency criteria:

With a Piotroski Score of 4, Amcor plc is considered to have average financial health, reflecting moderate strength but leaving room for improvement in key areas.
Competitive Landscape & Sector Positioning
This sector analysis will examine Amcor plc’s strategic positioning, revenue by segment, key products, main competitors, and competitive advantages. I will assess whether Amcor holds a competitive edge over its peers in the packaging and containers industry.
Strategic Positioning
Amcor plc operates a diversified product portfolio with a dominant Flexibles segment generating $10.9B and a Rigid Packaging segment at $4.1B in FY2025. Geographically, it maintains broad exposure across North America ($7.2B), Europe ($4.3B), Latin America ($1.8B), and Asia Pacific ($1.7B), reflecting a balanced global footprint.
Revenue by Segment
The pie chart illustrates Amcor plc’s revenue distribution across its Flexibles and Rigid Packaging segments for the fiscal year 2025.
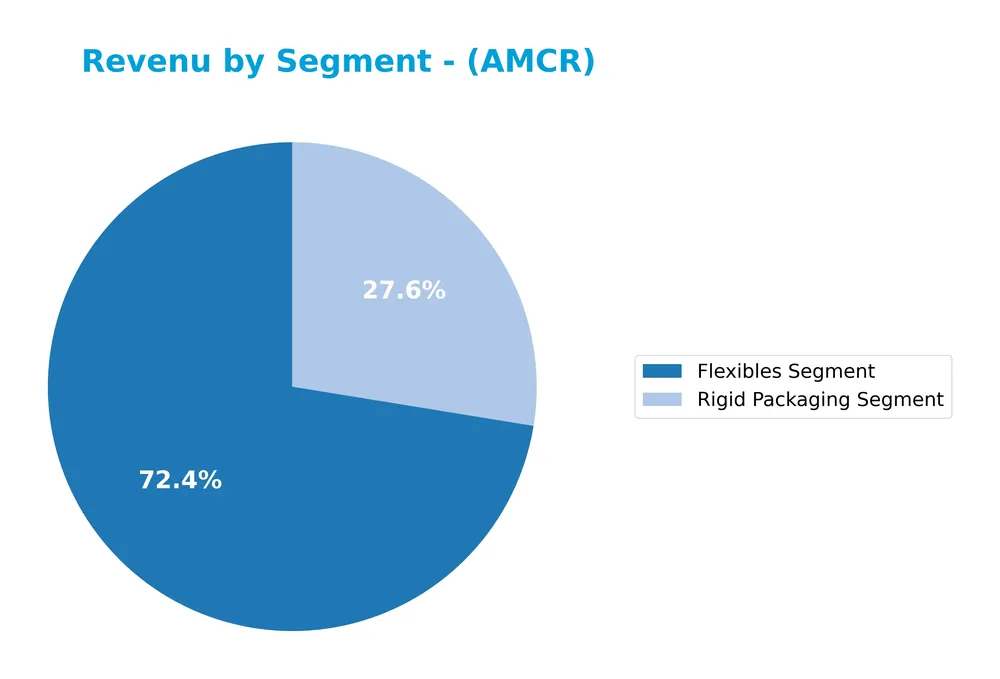
In 2025, the Flexibles Segment remains the dominant revenue driver with $10.9B, showing steady growth from $10.3B in 2024. The Rigid Packaging Segment also increased significantly to $4.1B from $3.3B the previous year, indicating a strong rebound. Overall, the business shows a balanced expansion, with both segments contributing to revenue growth, reducing concentration risk and suggesting healthy diversification.
Key Products & Brands
The following table summarizes Amcor plc’s key products and brands across its main packaging segments:
| Product | Description |
|---|---|
| Flexibles Segment | Flexible and film packaging products for food and beverage, medical and pharmaceutical, fresh produce, snack food, personal care, and other industries. |
| Rigid Packaging Segment | Rigid containers for beverages and food products, including carbonated soft drinks, water, juices, sports drinks, milk-based beverages, spirits, beer, sauces, dressings, spreads, personal care items, and plastic caps for various applications. |
Amcor plc operates primarily through two packaging segments: Flexibles, which offers versatile film packaging solutions, and Rigid Packaging, providing durable containers and caps for a broad range of consumables. These segments serve multiple global industries.
Main Competitors
There are 5 competitors in the Packaging & Containers industry; below are the top 5 leaders by market capitalization:
| Competitor | Market Cap. |
|---|---|
| International Paper Company | 21.25B |
| Smurfit Westrock Plc | 20.68B |
| Amcor plc | 19.41B |
| Packaging Corporation of America | 18.99B |
| Ball Corporation | 14.30B |
Amcor plc ranks 3rd among its competitors, with a market cap approximately 96.2% that of the leader, International Paper Company. The company stands above both the average market cap of the top 10 competitors (18.9B) and the sector median (19.4B). Its market cap is just 1.15% below the next competitor above, reflecting a narrow gap at the higher end of the sector.
Comparisons with competitors
Check out how we compare the company to its competitors:
Does AMCR have a competitive advantage?
Amcor plc currently does not present a competitive advantage, as its return on invested capital (ROIC) is significantly below its weighted average cost of capital (WACC), indicating value destruction and declining profitability. The company’s overall moat status is very unfavorable, reflecting challenges in sustaining excess returns over the period 2021-2025.
Looking ahead, Amcor operates in multiple geographic markets including North America, Europe, Latin America, and Asia Pacific, with steady revenue growth in these regions. Its two main segments, Flexibles and Rigid Packaging, cover a broad range of industries such as food, beverage, and personal care, offering potential opportunities for market expansion and new product development.
SWOT Analysis
This SWOT analysis highlights the key internal and external factors affecting Amcor plc’s current business environment and strategic outlook.
Strengths
- diversified global presence
- strong market position in packaging
- stable dividend yield of 5.79%
Weaknesses
- declining profitability and EPS growth
- unfavorable net margin and ROE
- moderate financial distress risk (Altman Z-score 1.07)
Opportunities
- expanding demand in emerging markets
- innovation in sustainable packaging
- potential cost optimization and operational improvements
Threats
- rising raw material costs
- intense competition in packaging industry
- regulatory pressures on plastic use
Amcor’s global footprint and dividend appeal are solid strengths, yet the company faces profitability challenges and financial risks that require cautious management. The strategy should focus on leveraging market opportunities while aggressively addressing cost structure and innovation to mitigate external threats.
Stock Price Action Analysis
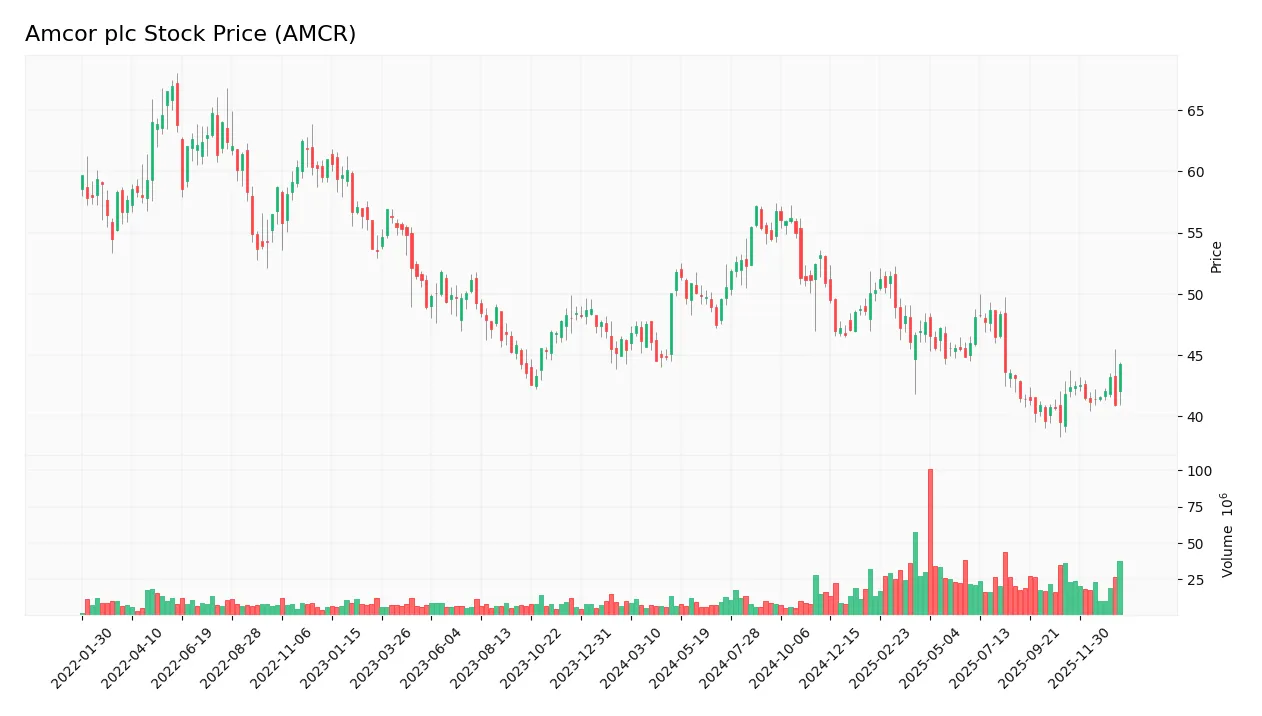
The weekly stock chart of Amcor plc (AMCR) over the last 12 months displays price fluctuations marked by a recent rebound from lows to higher levels:
Trend Analysis
Over the past 12 months, AMCR’s stock price declined by 2.57%, indicating a bearish trend with accelerating downward momentum. The price ranged between a high of 57.2 and a low of 39.5, with volatility reflected by a standard deviation of 4.41. A more recent period shows a 5.81% price increase, signaling a short-term rebound.
Volume Analysis
Trading volume has been increasing, with a total of 2.01B shares traded over the year. Buyer volume accounts for 48.01%, slightly below seller volume. However, in the recent 2.5-month period, strong buyer dominance emerged with 76.38% of volume, suggesting heightened investor interest and bullish participation during this rebound phase.
Target Prices
Analysts present a clear target price consensus for Amcor plc, reflecting moderate upside potential.
| Target High | Target Low | Consensus |
|---|---|---|
| 16.5 | 9 | 11.53 |
The target prices suggest that analysts expect Amcor’s stock to trade between $9 and $16.5, with an average consensus of $11.53, indicating cautious optimism.

Don’t Let Luck Decide Your Entry Point
Optimize your entry points with our advanced ProRealTime indicators. You’ll get efficient buy signals with precise price targets for maximum performance. Start outperforming now!
Analyst & Consumer Opinions
This section examines recent analyst ratings and consumer feedback to provide insight into Amcor plc’s market perception.
Stock Grades
Here is the latest overview of Amcor plc’s stock grades from well-known financial institutions:
| Grading Company | Action | New Grade | Date |
|---|---|---|---|
| Wells Fargo | Maintain | Overweight | 2026-01-20 |
| Baird | Upgrade | Outperform | 2026-01-07 |
| Truist Securities | Maintain | Buy | 2026-01-06 |
| Wells Fargo | Maintain | Overweight | 2025-10-15 |
| Baird | Maintain | Neutral | 2025-08-15 |
| Wells Fargo | Maintain | Overweight | 2025-07-18 |
| Truist Securities | Maintain | Buy | 2025-07-11 |
| UBS | Upgrade | Buy | 2025-06-26 |
| Truist Securities | Maintain | Buy | 2025-04-22 |
| Macquarie | Upgrade | Outperform | 2024-11-27 |
The consensus among these reputable analysts leans toward a positive outlook, with frequent upgrades and multiple “Buy” and “Outperform” ratings. The trend suggests sustained confidence in Amcor’s market position over the past 18 months.
Consumer Opinions
Consumer sentiment about Amcor plc reflects a mix of appreciation for product innovation and concerns over environmental impact.
| Positive Reviews | Negative Reviews |
|---|---|
| “Amcor’s packaging solutions are reliable and durable.” | “The company needs to improve its sustainability efforts.” |
| “Innovative designs that meet modern consumer needs.” | “Customer service response times can be slow.” |
| “Good value for the quality offered.” | “Some products are priced higher compared to competitors.” |
Overall, consumers praise Amcor for its innovative and reliable packaging, though environmental concerns and pricing remain common points of criticism.
Risk Analysis
Below is a summary table highlighting the key risks associated with Amcor plc, focusing on their probability and potential impact:
| Category | Description | Probability | Impact |
|---|---|---|---|
| Financial Health | Altman Z-Score indicates high bankruptcy risk; company in distress zone (score: 1.07). | High | High |
| Profitability | Low net margin (3.4%), ROE (4.36%), and ROIC (2.64%) suggest weak profitability. | High | Medium |
| Leverage | High debt-to-equity ratio (1.28) and unfavorable debt-to-equity score increase financial risk. | High | Medium |
| Liquidity | Quick ratio at 0.71 is unfavorable, indicating potential short-term liquidity issues. | Medium | Medium |
| Market Valuation | Elevated P/E ratio (28.58) flags possible overvaluation risk amid moderate growth. | Medium | Medium |
| Operational Efficiency | Low asset turnover (0.4) indicates inefficient use of assets. | Medium | Medium |
| Dividend Sustainability | Dividend yield is moderate (5.79%), but profitability challenges may threaten payouts. | Medium | Medium |
The most pressing concerns are Amcor’s distressed financial health as per the Altman Z-Score and its weak profitability metrics, which pose significant risks. Despite a favorable weighted average cost of capital and decent price-to-book ratio, the elevated leverage and liquidity constraints could affect stability. Investors should monitor debt levels and operational efficiency closely.
Should You Buy Amcor plc?
Amcor plc appears to be facing substantial leverage challenges and declining operational efficiency, suggesting a profile of value destruction and a very unfavorable competitive moat. Despite moderate profitability signals, the overall B- rating reflects cautious investor sentiment amid financial distress risks.
Strength & Efficiency Pillars
Amcor plc exhibits moderate profitability with a net margin of 3.4% and a return on equity of 4.36%, reflecting limited efficiency in generating shareholder returns. The return on invested capital (ROIC) stands at 2.64%, below its weighted average cost of capital (WACC) at 4.96%, indicating the company is not a value creator but rather shedding value. Financial health metrics reveal some concerns: an Altman Z-Score of 1.07 places Amcor in the distress zone, while the Piotroski Score of 4 suggests average financial strength, pointing to cautious operational stability.
Weaknesses and Drawbacks
Amcor faces notable challenges, including a high debt-to-equity ratio of 1.28, which is very unfavorable and raises leverage risks amid modest liquidity reflected by a quick ratio of 0.71. The valuation appears stretched with a price-to-earnings (P/E) ratio of 28.58, indicating premium pricing relative to earnings. Market pressure is evident from a bearish overall stock trend with a 2.57% price decline, despite a recent strong buyer dominance at 76.38%, which may signal short-term volatility and investor hesitation.
Our Verdict about Amcor plc
Amcor’s long-term fundamental profile appears unfavorable due to declining profitability and financial distress indicators. Despite recent buyer dominance and a short-term positive trend, the prevailing bearish momentum and underlying financial weaknesses suggest a cautious stance. Investors might view this as a wait-and-see scenario, awaiting clearer signs of sustained recovery before considering meaningful exposure to the stock.
Disclaimer: This content is for informational purposes only and does not constitute financial, investment, or other professional advice. Investing in financial markets involves a significant risk of loss, and past performance is not indicative of future results.
Additional Resources
- Amcor (AMCR) Seen Delivering “Competitive” Growth into FY27, Baird Turns Bullish – Yahoo Finance (Jan 12, 2026)
- What you need to know ahead of Amcor’s earnings release – MSN (Jan 22, 2026)
- Should Amcor’s (AMCR) Reverse Stock Split Reshape Investor Perceptions of Its Capital Structure Strategy? – simplywall.st (Jan 22, 2026)
- Amcor completes 1-for-5 reverse stock split – Investing.com (Jan 15, 2026)
- Amcor: An Undervalued Dividend Aristocrat For Income Growth Investors (AMCR) – Seeking Alpha (Jan 12, 2026)
For more information about Amcor plc, please visit the official website: amcor.com