Home > Analyses > Technology > Ambarella, Inc.
Ambarella powers the eyes of the future with its cutting-edge semiconductor solutions. Its system-on-a-chip designs drive high-definition video and AI vision in automotive safety, security cameras, and drones. Renowned for innovation and low power consumption, Ambarella shapes multiple fast-growing industries. As the semiconductor sector evolves rapidly, I ask: does Ambarella’s current valuation still reflect its growth potential and operational fundamentals?

Table of contents
Business Model & Company Overview
Ambarella, Inc., founded in 2004 and headquartered in Santa Clara, California, commands a leading role in the semiconductor industry. It delivers a core business focused on semiconductor solutions that integrate HD and ultra HD video compression, image processing, and AI-driven computer vision on a single chip. This cohesive ecosystem powers automotive cameras, security systems, robotics, and consumer devices, making Ambarella a pivotal player in video technology innovation.
The company’s revenue engine balances system-on-a-chip hardware with embedded AI software, selling primarily to original design and equipment manufacturers. Ambarella’s global footprint spans the Americas, Europe, and Asia, enabling diverse end-market penetration. Its competitive advantage stems from its low-power, high-performance designs that create a robust economic moat and position it to shape the future of intelligent video applications worldwide.
Financial Performance & Fundamental Metrics
I analyze Ambarella, Inc.’s income statement, key financial ratios, and dividend payout policy to assess its profitability, efficiency, and shareholder returns.
Income Statement
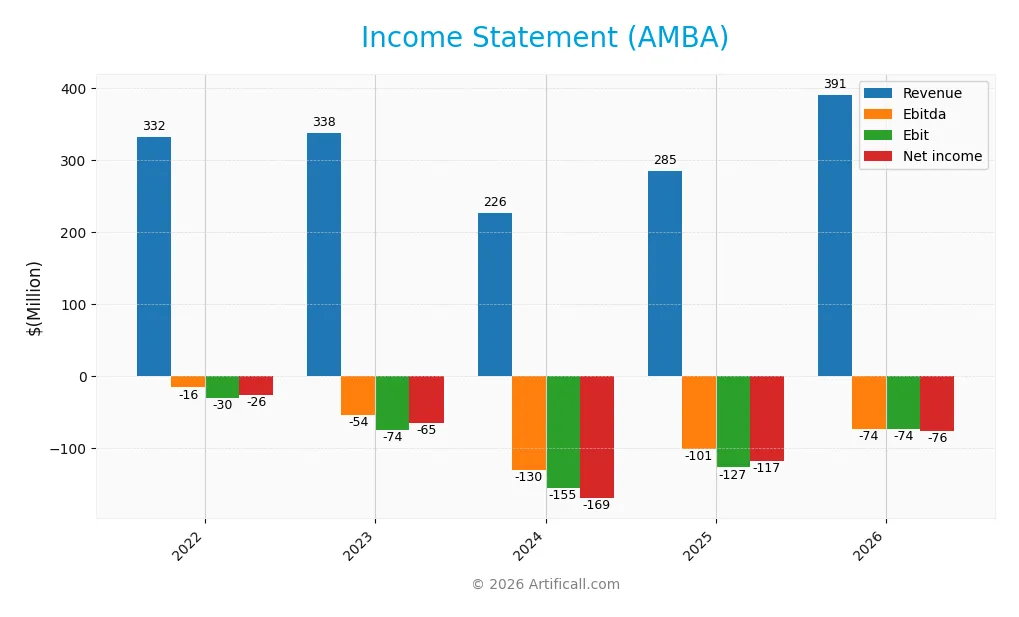
The table below summarizes Ambarella, Inc.’s key income statement metrics for fiscal years 2022 through 2026, presented in USD.
| 2022 | 2023 | 2024 | 2025 | 2026 | |
|---|---|---|---|---|---|
| Revenue | 332M | 338M | 226M | 285M | 391M |
| Cost of Revenue | 124M | 129M | 90M | 113M | 159M |
| Operating Expenses | 238M | 283M | 291M | 299M | 314M |
| Gross Profit | 208M | 209M | 137M | 172M | 231M |
| EBITDA | -16M | -54M | -130M | -101M | -74M |
| EBIT | -30M | -74M | -155M | -127M | -74M |
| Interest Expense | 0 | 0 | 0 | 0 | 0 |
| Net Income | -26M | -65M | -169M | -117M | -76M |
| EPS | -0.72 | -1.70 | -4.25 | -2.84 | -1.78 |
| Filing Date | 2022-04-01 | 2023-03-31 | 2024-03-29 | 2025-03-28 | 2026-03-23 |
Income Statement Evolution
Ambarella’s revenue grew 18% overall from 2022 to 2026, with a strong 37% jump in the last year. Gross profit increased in line, maintaining a favorable 59% gross margin. However, net income declined sharply over the period, pushing net margins further negative despite recent improvements. Operating expenses rose proportionally with revenue growth.
Is the Income Statement Favorable?
In 2026, revenue reached $391M with a solid 59% gross margin, signaling efficient production costs. Yet, operating income remained negative at -$83M, reflecting high R&D and SG&A expenses. Net margin was -19%, an improvement but still unfavorable. Overall, fundamentals show revenue strength but persistent profitability challenges, balancing favorable growth against ongoing losses.
Financial Ratios
The table below summarizes Ambarella, Inc.’s key financial ratios for fiscal years 2022 through 2026, highlighting profitability, leverage, liquidity, and valuation metrics:
| Ratios | 2022 | 2023 | 2024 | 2025 | 2026 |
|---|---|---|---|---|---|
| Net Margin | -7.96% | -19.37% | -74.81% | -41.12% | -19.42% |
| ROE | -4.83% | -10.79% | -30.26% | -20.86% | -12.75% |
| ROIC | -4.75% | -10.80% | -26.58% | -21.96% | -13.25% |
| P/E | -194.10 | -52.71 | -12.37 | -27.05 | -36.05 |
| P/B | 9.37 | 5.69 | 3.74 | 5.64 | 4.60 |
| Current Ratio | 2.99 | 3.65 | 3.38 | 2.65 | 2.31 |
| Quick Ratio | 2.48 | 3.16 | 3.03 | 2.36 | 2.01 |
| D/E | 0.02 | 0.01 | 0.01 | 0.01 | 0.02 |
| Debt-to-Assets | 1.78% | 1.22% | 0.81% | 0.76% | 1.68% |
| Interest Coverage | 0 | 0 | 0 | 0 | 0 |
| Asset Turnover | 0.50 | 0.48 | 0.34 | 0.41 | 0.49 |
| Fixed Asset Turnover | 15.61 | 16.75 | 14.44 | 19.96 | 16.51 |
| Dividend Yield | 0 | 0 | 0 | 0 | 0 |
Evolution of Financial Ratios
From 2022 to 2026, Ambarella’s Return on Equity (ROE) consistently declined, reaching -12.75% in 2026, signaling deteriorating profitability. The Current Ratio showed a downward trend but remained above 2.3, indicating solid liquidity. The Debt-to-Equity Ratio stayed remarkably low and stable near 0.02, reflecting minimal leverage and conservative capital structure.
Are the Financial Ratios Favorable?
In 2026, profitability ratios like net margin (-19.42%) and ROE (-12.75%) were unfavorable, highlighting ongoing losses. Liquidity ratios, including current (2.31) and quick ratios (2.01), were favorable, demonstrating strong short-term financial health. Low debt measures, such as debt-to-equity (0.02) and debt-to-assets (1.68%), also rated favorably. However, asset turnover (0.49) and interest coverage (0) remained weak. Overall, 57% of key ratios were unfavorable, indicating a cautious financial position.
Shareholder Return Policy
Ambarella, Inc. does not pay dividends, reflecting net losses and a focus on reinvestment. The company’s free cash flow supports internal funding, while share buybacks are not reported. This strategy aligns with a growth phase prioritizing long-term shareholder value creation.
Score analysis
The following radar chart highlights Ambarella, Inc.’s key financial metric scores for a comprehensive view:
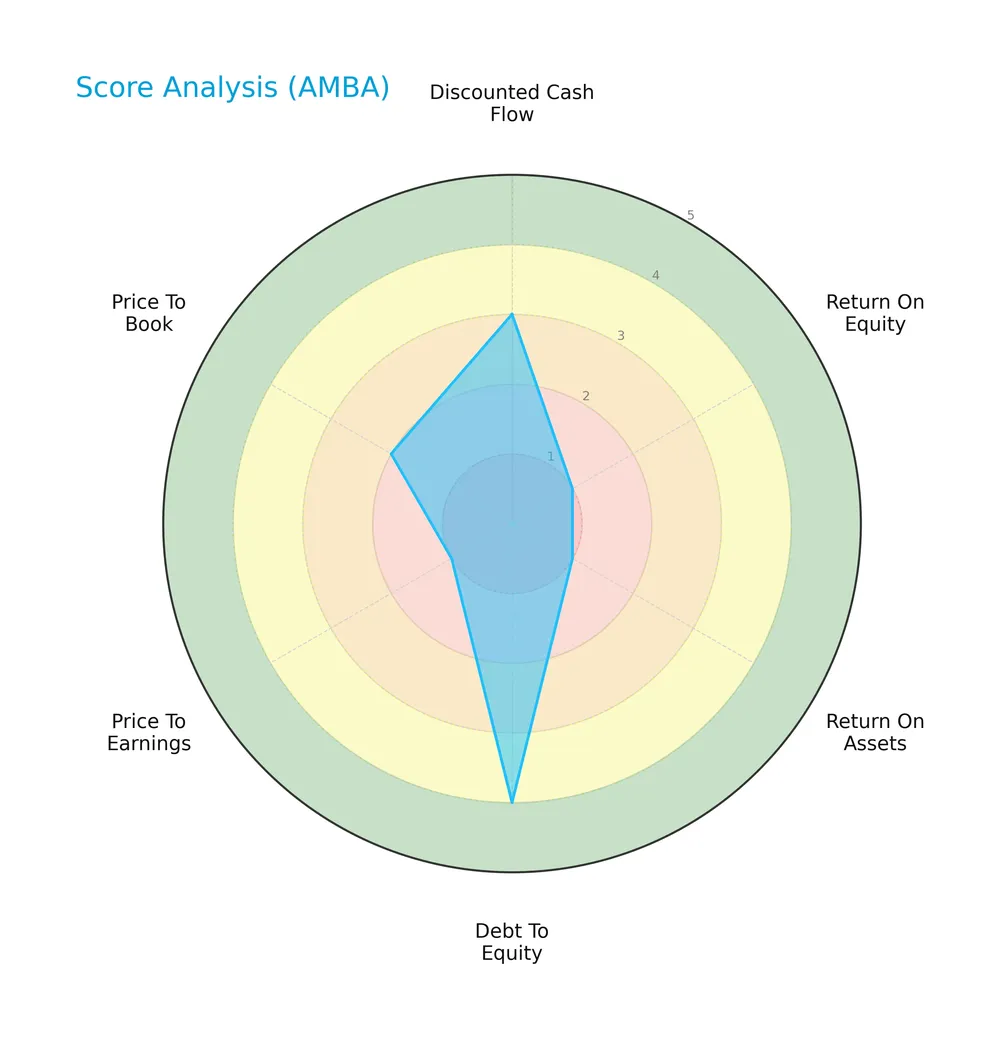
Ambarella shows a moderate discounted cash flow score but struggles with very unfavorable returns on equity and assets. Its debt-to-equity score is favorable, yet valuation metrics like price-to-earnings and price-to-book remain weak.
Analysis of the company’s bankruptcy risk
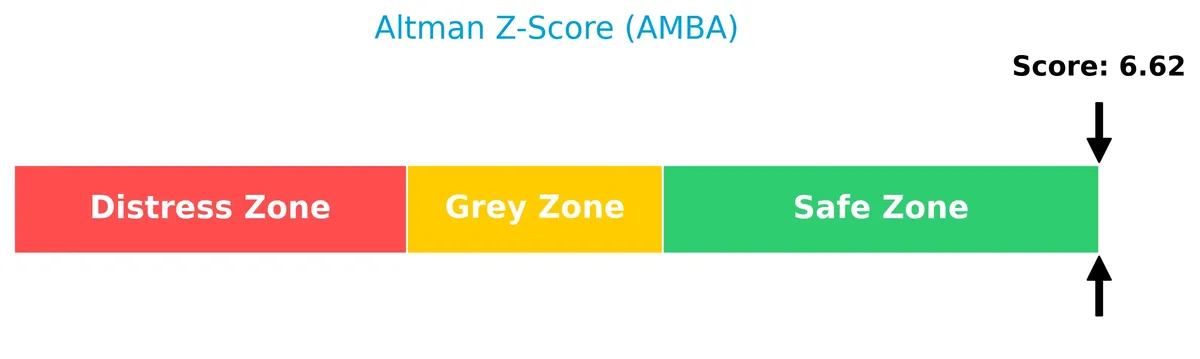
Ambarella’s Altman Z-Score places it confidently in the safe zone, indicating low bankruptcy risk and strong financial stability:
Is the company in good financial health?
The Piotroski F-Score diagram illustrates Ambarella’s current financial strength status:

With a very weak Piotroski score of 3, Ambarella’s financial health appears fragile, signaling operational and profitability challenges despite its solid balance sheet.
Competitive Landscape & Sector Positioning
This analysis explores Ambarella, Inc.’s strategic position within the semiconductor sector. I will examine revenue segments, key products, and main competitors. I aim to determine whether Ambarella holds a competitive advantage over its industry peers.
Strategic Positioning
Ambarella concentrates its revenue heavily in Taiwan, reflecting a regional focus within Asia Pacific. It maintains additional exposure to Europe and North America (excluding the U.S.), while U.S. sales remain comparatively small. The product portfolio focuses on semiconductor solutions for diverse video applications globally.
Key Products & Brands
The table below lists Ambarella’s main products and brands with their core functionalities:
| Product | Description |
|---|---|
| Automotive Cameras | Includes automotive video recorders, electronic mirrors, ADAS cameras, cabin and driver monitoring systems, and central domain controllers for autonomous vehicles. |
| Internet Protocol Security Cameras | Professional and home security cameras leveraging HD and ultra HD video compression and image processing. |
| Robotics and Industrial Cameras | Identification/authentication cameras, sensing cameras, and robotic vision products for industrial applications. |
| Consumer and Leisure Cameras | Wearable body cameras, sports action cameras, social media cameras, drones for aerial video/photo capture, video conferencing, and virtual reality devices. |
Ambarella’s product portfolio centers on semiconductor solutions that integrate video processing, AI algorithms, and system functions. These products power diverse applications from automotive safety to consumer electronics, emphasizing high-definition imaging and low power consumption.
Main Competitors
The semiconductor sector includes 38 competitors; below is a table of the top 10 leaders by market capitalization:
| Competitor | Market Cap. |
|---|---|
| NVIDIA Corporation | 4.6T |
| Broadcom Inc. | 1.6T |
| Taiwan Semiconductor Manufacturing Company Limited | 1.6T |
| ASML Holding N.V. | 415B |
| Advanced Micro Devices, Inc. | 363B |
| Micron Technology, Inc. | 353B |
| Lam Research Corporation | 232B |
| Applied Materials, Inc. | 214B |
| QUALCOMM Incorporated | 185B |
| Intel Corporation | 173B |
Ambarella, Inc. ranks 33rd among 38 competitors with a market cap just 0.05% of NVIDIA’s. It sits well below both the 975B average for top 10 and the 31B sector median. Ambarella maintains a 38.81% market cap gap to its nearest competitor above, highlighting a significant scale difference.
Does Ambarella have a competitive advantage?
Ambarella currently does not show a competitive advantage, as its return on invested capital (ROIC) is significantly below its weighted average cost of capital (WACC), indicating value destruction. The company’s ROIC trend is sharply declining, reflecting diminishing profitability over the 2022-2026 period.
Looking ahead, Ambarella leverages its semiconductor expertise in video processing and AI for automotive, security, and consumer devices. Expansion into autonomous vehicle systems and industrial robotics offers growth opportunities, though profitability challenges persist.
Comparisons with competitors
Check out how we compare the company to its competitors:
SWOT Analysis
This analysis highlights Ambarella’s core internal and external factors to guide strategic decisions.
Strengths
- strong revenue growth of 37% in 2026
- solid gross margin at 59%
- low debt levels with DE ratio of 0.02
Weaknesses
- negative net margin of -19%
- declining ROIC well below WACC
- weak profitability with negative ROE and ROIC
Opportunities
- expanding automotive camera and AI vision markets
- rising demand in Taiwan and Asia Pacific regions
- innovation in system-on-chip technology
Threats
- intense semiconductor industry competition
- high beta risk at 1.996
- geopolitical tensions affecting supply chains
Ambarella’s strengths in revenue growth and gross margins are overshadowed by profitability challenges and value destruction. The company must leverage growth markets while addressing operational inefficiencies to stabilize its financial health.
Stock Price Action Analysis
The weekly stock chart below illustrates Ambarella, Inc.’s price movements over the last 100 weeks, highlighting key support and resistance levels:
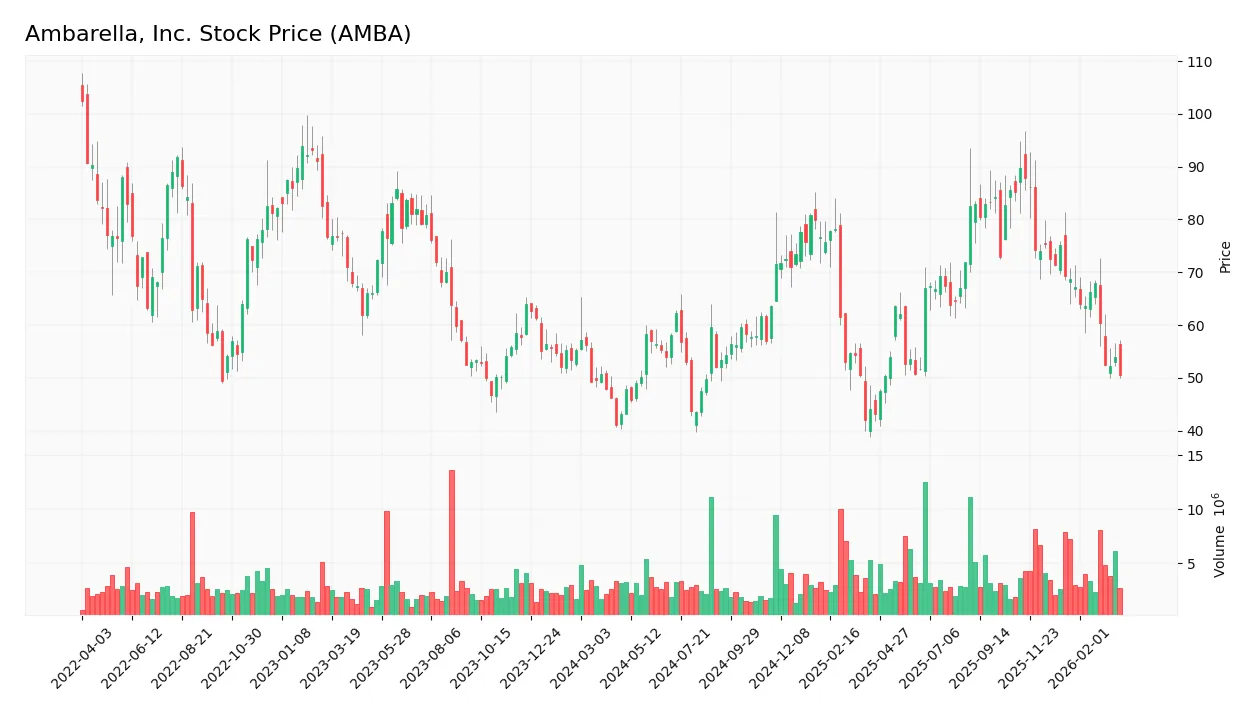
Trend Analysis
Over the past 12 months, Ambarella’s stock rose 5.48%, indicating a bullish trend with decelerating momentum. Price volatility is significant, with a 12.18 standard deviation. The stock ranged between 41.94 and 89.67. Recent months show a sharp 27.12% decline, reflecting a short-term bearish slope of -1.78.
Volume Analysis
Trading volume is increasing overall, with total volume at 428M shares. Buyer and seller volumes are nearly balanced, 49.06% buyers. However, recent three-month data shows seller dominance at 79%, with buyer volume only 21%. This suggests bearish investor sentiment and heightened selling pressure.
Target Prices
Analysts project a moderately bullish outlook for Ambarella, Inc., with a balanced consensus target.
| Target Low | Target High | Consensus |
|---|---|---|
| 80 | 115 | 98.33 |
The target range suggests upside potential near 17% from current levels, reflecting confidence in Ambarella’s growth prospects.
Analyst & Consumer Opinions
This section examines the latest analyst ratings and consumer feedback regarding Ambarella, Inc. (AMBA) performance.

Don’t Let Luck Decide Your Entry Point
Optimize your entry points with our advanced ProRealTime indicators. You’ll get efficient buy signals with precise price targets for maximum performance. Start outperforming now!
Stock Grades
Here is the latest summary of Ambarella, Inc.’s stock grades from leading financial firms:
| Grading Company | Action | New Grade | Date |
|---|---|---|---|
| Rosenblatt | Maintain | Buy | 2026-03-23 |
| Rosenblatt | Maintain | Buy | 2025-11-26 |
| Needham | Maintain | Buy | 2025-11-26 |
| Stifel | Maintain | Buy | 2025-11-26 |
| B of A Securities | Maintain | Neutral | 2025-11-26 |
| Rosenblatt | Maintain | Buy | 2025-11-24 |
| Rosenblatt | Maintain | Buy | 2025-08-29 |
| Northland Capital Markets | Maintain | Outperform | 2025-08-29 |
| B of A Securities | Maintain | Neutral | 2025-08-29 |
| Oppenheimer | Maintain | Perform | 2025-08-29 |
The grades show a strong consensus favoring a Buy stance, with multiple firms maintaining that rating consistently. Notably, B of A Securities holds a neutral view, indicating some caution within the broader positive outlook.
Consumer Opinions
Ambarella, Inc. inspires mixed emotions among its users, reflecting both its innovation and areas needing improvement.
| Positive Reviews | Negative Reviews |
|---|---|
| “Impressive video processing quality and efficiency.” | “High price compared to competitors.” |
| “Reliable performance in AI and computer vision tasks.” | “Customer support response times are slow.” |
| “Strong integration capabilities with various platforms.” | “Occasional firmware bugs affect usability.” |
Consumers consistently praise Ambarella’s cutting-edge video processing and AI capabilities. However, price sensitivity and customer service delays remain notable concerns.
Risk Analysis
Below is a summary of Ambarella’s key risks, highlighting likelihood and potential impact:
| Category | Description | Probability | Impact |
|---|---|---|---|
| Profitability | Negative net margin (-19.42%) signals ongoing operational losses | High | High |
| Financial Health | Very weak Piotroski score (3) suggests fragile financial strength | High | Medium |
| Market Volatility | High beta (1.996) creates sensitivity to market swings | Medium | Medium |
| Leverage | Extremely low debt (D/E 0.02) limits financial risk but may constrain growth | Low | Low |
| Liquidity | Strong current ratio (2.31) reduces short-term solvency risk | Low | Low |
| Interest Coverage | Zero interest coverage indicates vulnerability to debt servicing | Medium | High |
| Valuation | High price-to-book (4.6) may indicate overvaluation risk | Medium | Medium |
The most pressing risks come from sustained unprofitability and weak financial strength. Despite a strong Altman Z-Score placing Ambarella in the safe zone, the company’s negative ROIC (-13.25%) and ROE (-12.75%) sharply contrast with industry norms. Recent share price volatility (-4.18% daily change) and high beta warn of sensitivity to market cycles. Investors must weigh these substantial operational headwinds against balance sheet stability.
Should You Buy Ambarella, Inc.?
Ambarella, Inc. appears to be shedding value with a very unfavorable moat due to declining profitability and negative returns on invested capital. While its leverage profile seems manageable, the overall rating of C+ and weak profitability metrics suggest a cautious analytical interpretation.
Strength & Efficiency Pillars
Ambarella, Inc. maintains a robust gross margin of 59.19%, reflecting solid operational efficiency. However, profitability metrics such as net margin (-19.42%), ROE (-12.75%), and ROIC (-13.25%) are negative, indicating operational challenges. The company’s ROIC is below its WACC of 13.42%, signaling value destruction rather than creation. Despite favorable leverage ratios, Ambarella struggles to translate revenue growth into sustainable profits, limiting its efficiency as a value creator.
Weaknesses and Drawbacks
The Altman Z-Score of 6.62 places Ambarella safely outside distress territory, but significant weaknesses persist. The company suffers from an unfavorable price-to-book ratio of 4.6x, indicating a potentially overvalued equity relative to assets. Negative profitability ratios and very weak Piotroski score (3) raise concerns about financial strength. Additionally, recent market activity shows seller dominance at 21.06%, suggesting short-term price pressure and investor caution.
Our Final Verdict about Ambarella, Inc.
Ambarella’s profile appears mixed. Its solid liquidity and low leverage provide a cushion, but weak profitability and declining operational efficiency undermine its long-term appeal. Despite a bullish overall trend, recent seller dominance advises caution. The company may appear attractive for investors with a higher risk tolerance but suggests a wait-and-see approach for conservative capital seeking a more stable entry point.
Disclaimer: This content is for informational purposes only and does not constitute financial, investment, or other professional advice. Investing in financial markets involves a significant risk of loss, and past performance is not indicative of future results.
Additional Resources
- Ambarella, Inc. $AMBA Shares Purchased by Exchange Traded Concepts LLC – MarketBeat (Mar 28, 2026)
- Ambarella (AMBA) Gets Bullish Ratings from Analysts – MSN (Mar 27, 2026)
- Is Ambarella, Inc. (AMBA) A Good Stock To Buy Now? – Yahoo Finance (Mar 24, 2026)
- Ambarella Inc (NASDAQ: AMBA) — Vanguard disaggregates holdings, reports 0% ownership – Stock Titan (Mar 26, 2026)
- Decoding Ambarella Inc (AMBA): A Strategic SWOT Insight – GuruFocus (Mar 24, 2026)
For more information about Ambarella, Inc., please visit the official website: ambarella.com