Home > Analyses > Consumer Cyclical > Amazon.com, Inc.
Amazon reshapes how billions shop, stream media, and access cloud computing daily. It dominates specialty retail with unmatched scale in e-commerce and leads cloud infrastructure through AWS. The company’s innovation spans from consumer electronics to digital content, creating a vast ecosystem few can rival. As Amazon navigates evolving market dynamics and regulatory pressures, investors must ask: do its core fundamentals still justify its premium valuation and future growth ambitions?

Table of contents
Business Model & Company Overview
Amazon.com, Inc., founded in 1994 and headquartered in Seattle, WA, dominates the specialty retail sector with a vast ecosystem spanning online and physical stores. Its core mission integrates retail sales, electronic devices, and media content, creating a seamless consumer experience. The company’s scale is immense, employing 1.56M people globally and serving diverse customer bases through its North America, International, and AWS segments.
Amazon’s revenue engine balances product sales with high-margin services, including cloud computing, digital subscriptions, and advertising. Its footprint spans the Americas, Europe, and Asia, leveraging programs that empower sellers and content creators worldwide. This diverse model forms a competitive advantage that fortifies Amazon’s economic moat and positions it as a key architect of the retail and cloud industries’ future.
Financial Performance & Fundamental Metrics
I analyze Amazon.com, Inc.’s income statement, key financial ratios, and dividend payout policy to assess its profitability, efficiency, and shareholder returns.
Income Statement
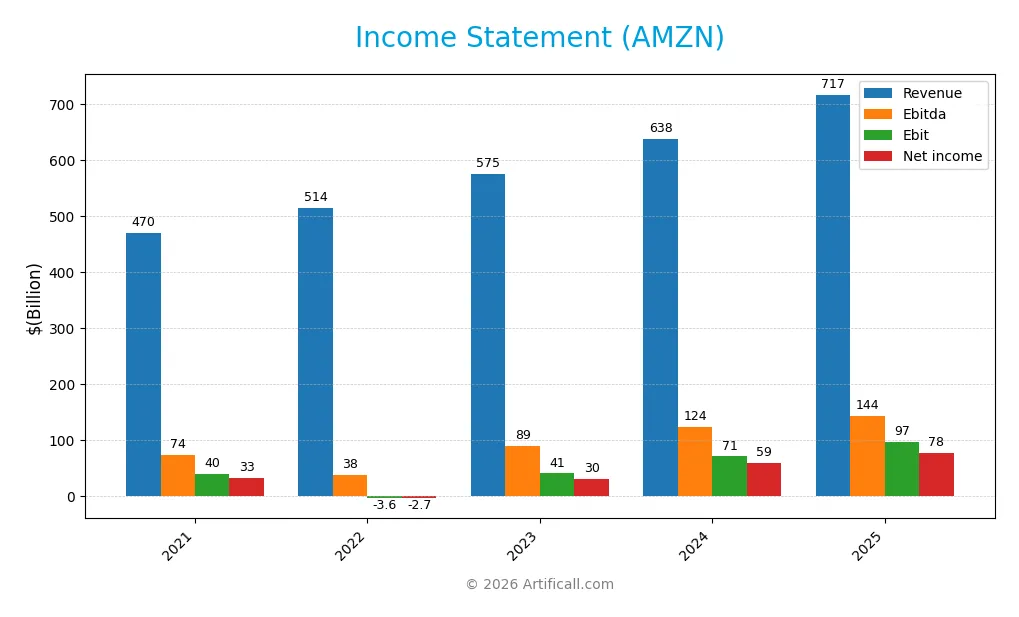
The table below presents Amazon.com, Inc.’s annual income statement figures from 2021 to 2025, reflecting key profitability and expense metrics in USD.
| 2021 | 2022 | 2023 | 2024 | 2025 | |
|---|---|---|---|---|---|
| Revenue | 470B | 514B | 575B | 638B | 717B |
| Cost of Revenue | 272B | 289B | 305B | 326B | 356B |
| Operating Expenses | 173B | 213B | 233B | 243B | 281B |
| Gross Profit | 197B | 225B | 270B | 312B | 361B |
| EBITDA | 74B | 38B | 89B | 124B | 144B |
| EBIT | 40B | -3.6B | 41B | 71B | 97B |
| Interest Expense | 1.8B | 2.4B | 3.2B | 2.4B | 2.3B |
| Net Income | 33B | -2.7B | 30B | 59B | 78B |
| EPS | 3.3 | -0.27 | 2.95 | 5.66 | 7.29 |
| Filing Date | 2022-02-04 | 2023-02-03 | 2024-02-01 | 2025-02-07 | 2026-02-05 |
Income Statement Evolution
Amazon’s revenue expanded by 52.6% from 2021 to 2025, with a strong 12.4% increase in the latest year. Net income surged 132.8% over the same period, driven by improving efficiency. Margins improved notably: gross margin reached 50.3%, and net margin rose to 10.8%, reflecting solid operational leverage and cost control despite rising expenses.
Is the Income Statement Favorable?
For 2025, Amazon posted $717B revenue and $77.7B net income, yielding a 10.8% net margin, which is robust compared to industry norms. Earnings per share grew nearly 30% year-over-year, underscoring profitability gains. However, operating expenses grew slightly faster than revenue, a minor caution. Overall, fundamentals appear favorable with strong margin expansion and earnings growth.
Financial Ratios
The table below summarizes key financial ratios for Amazon.com, Inc. from 2021 to 2025, illustrating profitability, liquidity, leverage, and valuation metrics:
| Ratios | 2021 | 2022 | 2023 | 2024 | 2025 |
|---|---|---|---|---|---|
| Net Margin | 7.10% | -0.53% | 5.29% | 9.29% | 10.83% |
| ROE | 24.13% | -1.86% | 15.07% | 20.72% | 18.89% |
| ROIC | 7.82% | 1.83% | 8.23% | 13.32% | 10.71% |
| P/E | 50.57 | -314.43 | 51.46 | 38.78 | 31.83 |
| P/B | 12.20 | 5.86 | 7.76 | 8.03 | 6.01 |
| Current Ratio | 1.14 | 0.94 | 1.05 | 1.06 | 1.05 |
| Quick Ratio | 0.91 | 0.72 | 0.84 | 0.87 | 0.88 |
| D/E | 0.84 | 0.96 | 0.67 | 0.46 | 0.37 |
| Debt-to-Assets | 27.68% | 30.28% | 25.69% | 20.95% | 18.70% |
| Interest Coverage | 13.75 | 5.17 | 11.58 | 28.51 | 35.17 |
| Asset Turnover | 1.12 | 1.11 | 1.09 | 1.02 | 0.88 |
| Fixed Asset Turnover | 2.17 | 2.03 | 2.08 | 1.94 | 2.01 |
| Dividend Yield | 0% | 0% | 0% | 0% | 0% |
Evolution of Financial Ratios
Amazon’s Return on Equity (ROE) increased steadily from negative in 2022 to 18.9% in 2025, reflecting improving profitability. The Current Ratio showed minor fluctuations but remained close to 1.0, indicating stable liquidity. The Debt-to-Equity ratio steadily declined from 0.96 in 2022 to 0.37 in 2025, suggesting a reduced reliance on debt.
Are the Financial Ratios Favorable?
In 2025, Amazon’s profitability ratios, including net margin (10.8%) and ROE (18.9%), were favorable, outperforming many sector peers. Liquidity ratios hovered near neutral levels, with a Current Ratio at 1.05 and Quick Ratio at 0.88. Leverage metrics like Debt-to-Equity (0.37) and debt-to-assets (18.7%) were favorable, showing prudent capital structure management. Market valuation ratios such as P/E (31.8) and P/B (6.0) appeared unfavorable, indicating potential overvaluation. Overall, the financial ratios present a slightly favorable profile.
Shareholder Return Policy
Amazon.com, Inc. does not pay dividends, reflecting its reinvestment focus and growth strategy. The company maintains no dividend payout, with zero dividend yield and payout ratio, while free cash flow coverage for potential distributions remains limited.
The firm engages in share buybacks, though not at aggressive levels. This approach aligns with reinvesting in operations and innovation, supporting sustainable long-term shareholder value creation amid ongoing expansion and capital allocation priorities.
Score analysis
The following radar chart displays Amazon.com, Inc.’s key financial scores across valuation, profitability, and leverage metrics:
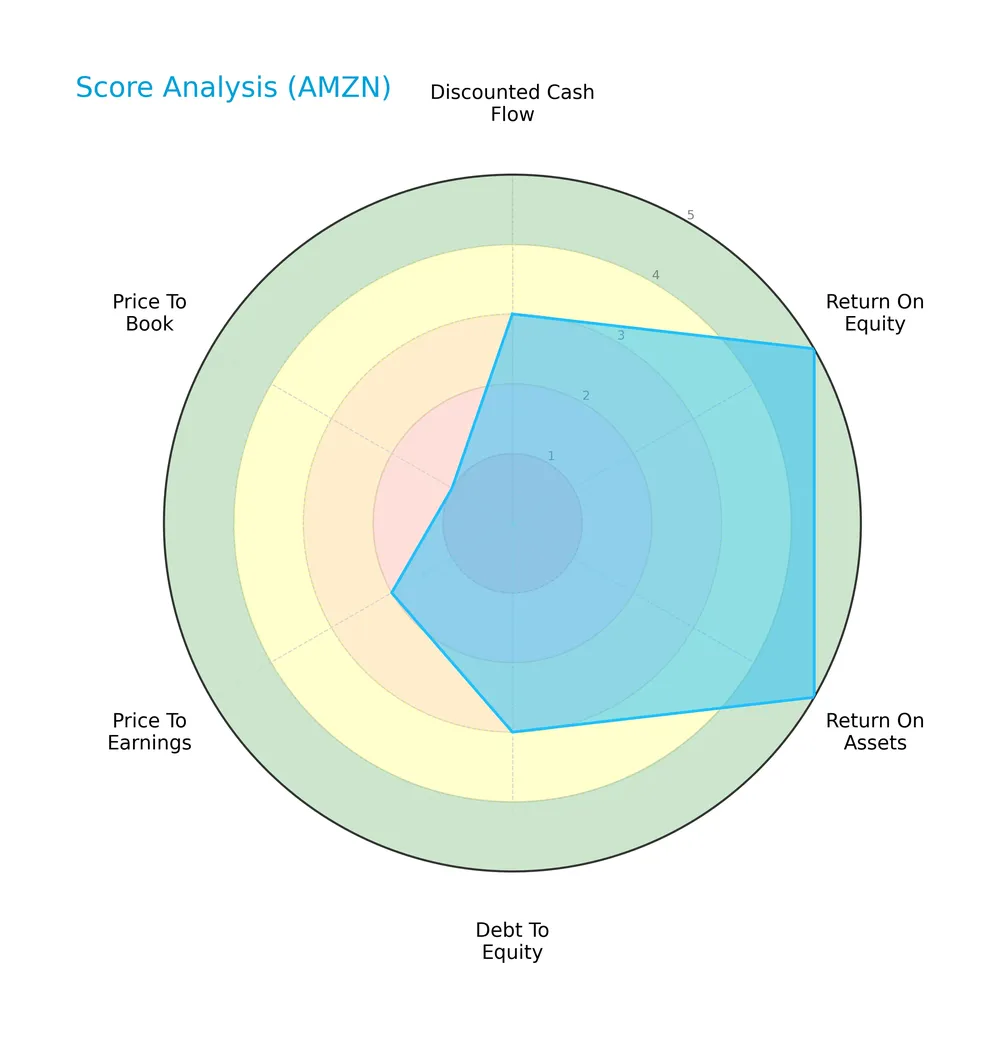
Amazon shows very favorable returns on equity and assets with scores of 5 each. Its discounted cash flow and debt-to-equity scores are moderate at 3. However, valuation metrics lag, with a low price-to-earnings score of 2 and a very unfavorable price-to-book score of 1.
Analysis of the company’s bankruptcy risk
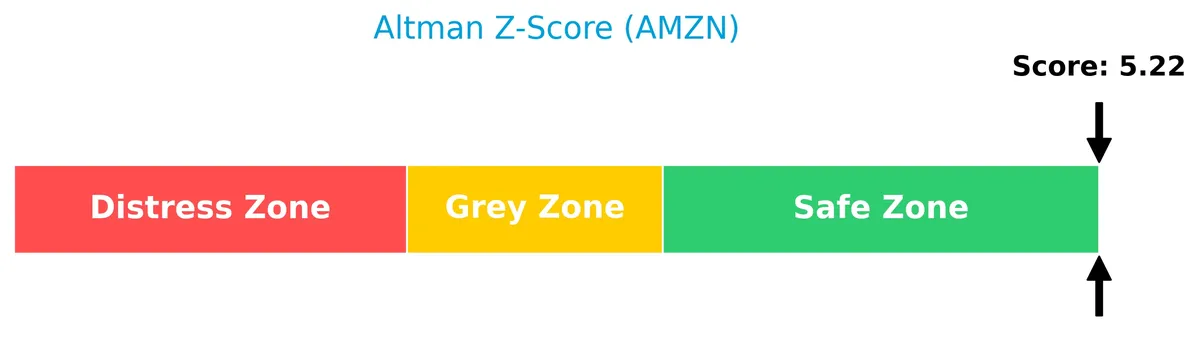
Amazon’s Altman Z-Score places it firmly in the safe zone, indicating a low risk of bankruptcy:
Is the company in good financial health?
The Piotroski Score diagram highlights Amazon’s moderate financial health status:

With a Piotroski Score of 5, Amazon stands at an average level, reflecting balanced strengths and weaknesses in profitability, leverage, and efficiency factors.
Competitive Landscape & Sector Positioning
This section presents an analysis of Amazon.com, Inc.’s sector positioning and competitive environment. We will examine strategic positioning, revenue by segment, key products, main competitors, competitive advantages, and a SWOT analysis. I will assess whether Amazon holds a competitive advantage over its industry peers.
Strategic Positioning
Amazon.com, Inc. maintains a diversified portfolio spanning retail, cloud computing, advertising, and subscription services. Geographically, it concentrates heavily in North America with 438B in 2024 revenue, complemented by a significant international presence generating 94B, reflecting broad market exposure.
Revenue by Segment
The pie chart presents Amazon’s revenue distribution by segment for fiscal year 2024, highlighting the company’s diversified income streams across core business areas.
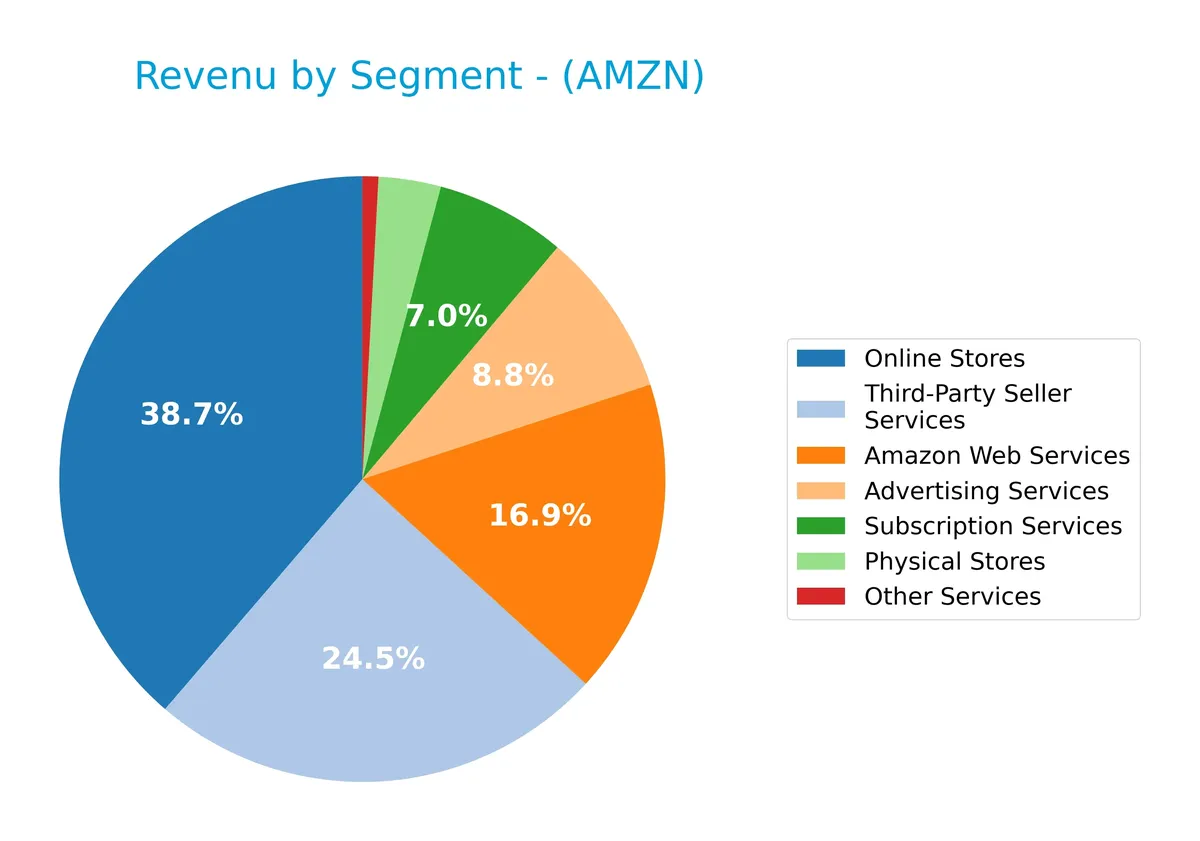
Amazon’s revenue is heavily driven by Online Stores at $247B and Third-Party Seller Services at $156B, reflecting its dominant e-commerce position. AWS, the high-margin cloud segment, reached $108B, showing robust growth and strategic importance. Advertising Services and Subscription Services, at $56B and $44B respectively, also contribute substantially, signaling increasing monetization of the platform. Physical Stores and Other Services remain smaller but stable. The 2024 data confirms concentration in e-commerce and cloud, with steady acceleration in high-value segments.
Key Products & Brands
The table below outlines Amazon.com, Inc.’s primary products and services by category and description:
| Product | Description |
|---|---|
| Online Stores | Retail sale of consumer products through Amazon’s e-commerce platform worldwide. |
| Third-Party Seller Services | Programs enabling external sellers to market and sell products on Amazon’s platform. |
| Amazon Web Services (AWS) | Cloud computing services including storage, database, analytics, machine learning, and more. |
| Advertising Services | Digital advertising offerings across Amazon’s platforms targeting consumers and businesses. |
| Subscription Services | Membership programs such as Amazon Prime offering digital content and other benefits. |
| Physical Stores | Brick-and-mortar retail outlets operated by Amazon. |
| Other Services | Additional offerings including fulfillment, media content production, and device sales. |
| Electronic Devices | Amazon-manufactured products like Kindle, Fire tablets, Fire TVs, Ring, Blink, eero, and Echo. |
Amazon’s product portfolio spans e-commerce, cloud computing, digital advertising, and subscription services. This diversified mix supports its broad consumer base and multiple revenue streams.
Main Competitors
Amazon.com, Inc. competes with a total of 10 main rivals, with this table listing the top 10 leaders by market capitalization:
| Competitor | Market Cap. |
|---|---|
| Amazon.com, Inc. | 2.42T |
| Alibaba Group Holding Limited | 340B |
| PDD Holdings Inc. | 159B |
| MercadoLibre, Inc. | 102B |
| eBay Inc. | 39B |
| Ulta Beauty, Inc. | 28B |
| Tractor Supply Company | 27B |
| Williams-Sonoma, Inc. | 23B |
| Genuine Parts Company | 17B |
| Best Buy Co., Inc. | 15B |
Amazon.com, Inc. ranks first among its competitors with a market cap 93% the size of the top player, reflecting its dominant scale. It sits well above both the average market cap of 317B and the sector median of 33.6B. The company maintains a substantial lead, with a -561% gap to the next competitor below.
Comparisons with competitors
Check out how we compare the company to its competitors:
Does AMZN have a competitive advantage?
Amazon currently does not demonstrate a clear competitive advantage, as its ROIC remains below WACC, indicating value shedding despite overall profitability growth. The company shows a slightly favorable moat with a rising ROIC trend, suggesting improving efficiency.
Looking ahead, Amazon’s expansion in international markets and ongoing innovation in AWS and consumer electronics provide growth opportunities. These initiatives could enhance its competitive positioning if profitability continues to strengthen.
SWOT Analysis
This analysis identifies key internal and external factors that influence Amazon.com, Inc.’s strategic positioning.
Strengths
- dominant market share in e-commerce
- strong AWS cloud platform
- robust revenue growth and profitability
Weaknesses
- high P/E and P/B ratios indicate valuation risk
- low dividend yield may deter income investors
- slim current and quick ratios suggest liquidity caution
Opportunities
- expansion in international markets
- growth in cloud computing demand
- innovation in AI and logistics technologies
Threats
- intense competition from global retailers
- regulatory scrutiny and antitrust risks
- economic downturns affecting consumer spending
Amazon’s strengths in scale and innovation support sustainable growth. However, valuation levels and liquidity metrics warrant caution. Strategic focus on global expansion and technology can offset competitive and regulatory threats.
Stock Price Action Analysis
The weekly stock price chart for Amazon.com, Inc. illustrates price movements, volatility, and key support and resistance levels over the past 12 months:
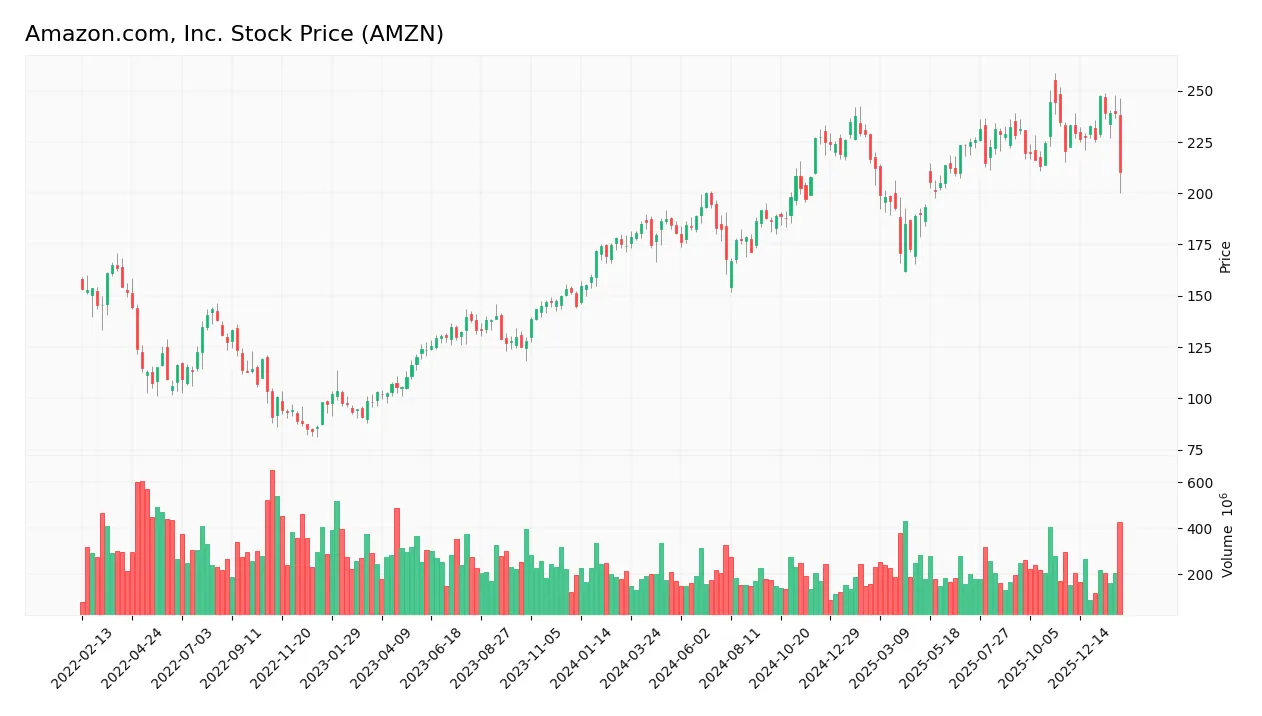
Trend Analysis
Over the past 12 months, Amazon’s stock price increased by 20.58%, indicating a bullish trend despite deceleration in momentum. The highest price reached 247.38, with a low of 166.94. The standard deviation of 21.86 reflects notable volatility. Recent three-month data shows a -4.7% decline, signaling a short-term neutral to bearish shift with a mild positive slope.
Volume Analysis
Over the past three months, trading volume shows a slight seller dominance at 56.34% of activity, reversing the overall buyer-driven trend. Volume is increasing, signaling growing market participation amid cautious investor sentiment. This shift suggests sellers have gained momentum recently, reflecting potential profit-taking or repositioning.
Target Prices
Analysts set a clear target consensus for Amazon.com, Inc., reflecting cautious optimism.
| Target Low | Target High | Consensus |
|---|---|---|
| 175 | 315 | 283.86 |
The target range spans from $175 to $315, with a consensus near $284, indicating moderate upside potential balanced by market uncertainties.

Don’t Let Luck Decide Your Entry Point
Optimize your entry points with our advanced ProRealTime indicators. You’ll get efficient buy signals with precise price targets for maximum performance. Start outperforming now!
Analyst & Consumer Opinions
I will examine recent analyst ratings and consumer feedback to provide a balanced view of Amazon.com, Inc.’s market perception.
Stock Grades
Here are the latest verified grades from established financial institutions for Amazon.com, Inc.:
| Grading Company | Action | New Grade | Date |
|---|---|---|---|
| Morgan Stanley | Maintain | Overweight | 2026-02-06 |
| Guggenheim | Maintain | Buy | 2026-02-06 |
| Piper Sandler | Maintain | Overweight | 2026-02-06 |
| Argus Research | Maintain | Buy | 2026-02-06 |
| Oppenheimer | Maintain | Outperform | 2026-02-06 |
| Truist Securities | Maintain | Buy | 2026-02-06 |
| Scotiabank | Maintain | Sector Outperform | 2026-02-06 |
| Cantor Fitzgerald | Maintain | Overweight | 2026-02-06 |
| Evercore ISI Group | Maintain | Outperform | 2026-02-06 |
| Needham | Maintain | Buy | 2026-02-06 |
The consensus strongly favors Amazon with a “Buy” rating prevailing across all major firms. No downgrades or negative revisions occurred, indicating stable analyst confidence.
Consumer Opinions
Amazon.com, Inc. consistently sparks strong opinions among consumers worldwide, reflecting its vast influence and service reach.
| Positive Reviews | Negative Reviews |
|---|---|
| Fast, reliable delivery enhances shopping convenience. | Customer service can be slow to resolve issues. |
| Wide product selection meets diverse needs. | Pricing fluctuates frequently, causing frustration. |
| User-friendly website and app simplify purchases. | Packaging waste concerns among environmentally conscious buyers. |
Overall, consumers praise Amazon’s speed and variety but express frustration over customer support and sustainability practices. These recurring themes highlight both its operational strengths and areas needing improvement.
Risk Analysis
Key risks facing Amazon.com, Inc. encompass market volatility, valuation concerns, and competitive pressures:
| Category | Description | Probability | Impact |
|---|---|---|---|
| Market Volatility | High beta (1.385) signals sensitivity to market swings, raising stock price risk. | High | Medium |
| Valuation Risk | Elevated P/E (31.8) and P/B (6.0) ratios suggest stretched valuation levels. | Medium | High |
| Competitive Threat | Intense retail and cloud competition may pressure margins and growth. | Medium | High |
| Liquidity Risk | Neutral current (1.05) and quick ratios (0.88) indicate limited short-term buffer. | Low | Medium |
| Innovation Risk | Dependence on continuous innovation in AWS and devices to sustain moat. | Medium | Medium |
Amazon’s primary risks lie in its stretched valuation and fierce competition in both retail and cloud sectors. The stock’s 5.55% recent price drop reflects broader market corrections and sector rotation. Its Altman Z-score (5.22) confirms financial stability, but investors should monitor valuation multiples and competitive landscape closely.
Should You Buy Amazon.com, Inc.?
Amazon.com, Inc. appears to be in a very favorable financial position with improving profitability and operational efficiency. Despite a slightly favorable moat indicating limited competitive advantage, the company maintains a manageable leverage profile. Its overall B+ rating suggests a solid value creation potential.
Strength & Efficiency Pillars
Amazon.com, Inc. demonstrates solid profitability with a net margin of 10.83%, a return on equity (ROE) of 18.89%, and a return on invested capital (ROIC) of 10.71%. The company’s ROIC slightly exceeds its weighted average cost of capital (WACC) at 9.83%, positioning it as a modest value creator. Operational efficiency and consistent margin expansion underscore Amazon’s capacity to generate shareholder value despite competitive pressures. Its interest coverage ratio of 42.78 further reflects prudent capital management.
Weaknesses and Drawbacks
Amazon faces valuation headwinds, with a price-to-earnings (P/E) ratio at 31.83 and a price-to-book (P/B) ratio elevated at 6.01, signaling premium pricing relative to earnings and book value. These high multiples introduce valuation risk, potentially limiting upside in a market re-rating. The current ratio stands at 1.05, barely above the safety threshold, suggesting limited short-term liquidity cushion. Recent market activity reveals slight seller dominance, with buyers comprising only 43.66% of volume, possibly indicating near-term pressure.
Our Final Verdict about Amazon.com, Inc.
Amazon’s financial profile remains fundamentally sound and slightly favorable, backed by strong profitability and a safe Altman Z-Score of 5.22. Despite its bullish long-term trend, recent seller dominance suggests a cautious entry point. This profile might appear attractive for investors seeking long-term exposure but advises prudence amid short-term market fluctuations and stretched valuation metrics.
Disclaimer: This content is for informational purposes only and does not constitute financial, investment, or other professional advice. Investing in financial markets involves a significant risk of loss, and past performance is not indicative of future results.
Additional Resources
- Amazon to report Q4 earnings with capex, AI growth in focus – Yahoo Finance (Feb 05, 2026)
- Amazon.com, Inc. 2025 Q4 – Results – Earnings Call Presentation (NASDAQ:AMZN) 2026-02-05 – Seeking Alpha (Feb 06, 2026)
- Earnings Flash (AMZN) Amazon.com, Inc. Reports Q4 Revenue $213.39B, vs. FactSet Est of $211.44B – marketscreener.com (Feb 05, 2026)
- Amazon shares sink on earnings miss, $200B spending plan – Proactive financial news (Feb 05, 2026)
- Oppenheimer Raises Amazon.com, Inc. (AMZN) Target as AWS Momentum and Margin Expansion Accelerate – Yahoo Finance (Feb 05, 2026)
For more information about Amazon.com, Inc., please visit the official website: amazon.com