Home > Analyses > Consumer Defensive > Altria Group, Inc.
Altria Group, Inc. shapes American tobacco culture with its iconic Marlboro cigarettes and diverse oral nicotine products. It dominates the U.S. tobacco industry through relentless innovation and a portfolio that balances tradition with modern demand. Known for quality and strong brand loyalty, Altria’s influence extends deeply into consumer habits. As regulatory pressures mount and market dynamics shift, I ask: does Altria’s current valuation reflect its ability to sustain growth and shareholder returns?

Table of contents
Business Model & Company Overview
Altria Group, Inc., founded in 1822 and headquartered in Richmond, Virginia, dominates the U.S. tobacco industry. Its ecosystem revolves around iconic smokeable and oral tobacco products, including the Marlboro cigarette and Black & Mild cigars. The company’s portfolio also features smokeless tobacco brands like Copenhagen and Skoal, creating a diversified yet focused consumer offering underpinned by strong brand loyalty.
Altria’s revenue engine balances product sales primarily through wholesalers and large retail chains across the Americas. Although concentrated in the U.S., its strategic market presence influences global tobacco trends. The company’s robust distribution network and brand power form a significant economic moat, shaping the future of tobacco consumption with resilient cash flows and enduring competitive advantages.
Financial Performance & Fundamental Metrics
I will analyze Altria Group, Inc.’s income statement, key financial ratios, and dividend payout policy to assess its fundamental strength and shareholder value.
Income Statement
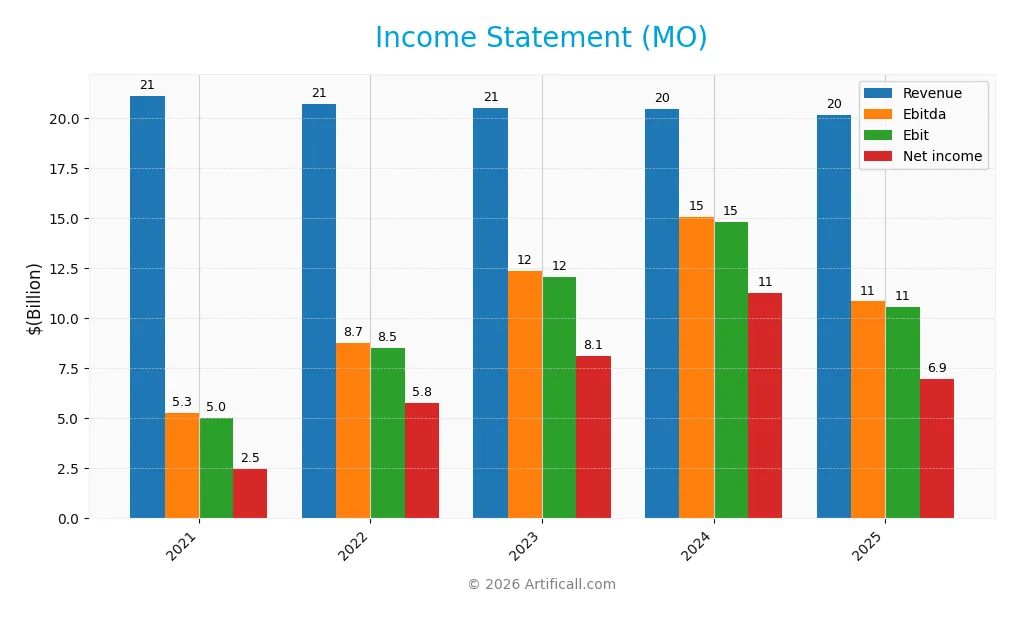
The table below summarizes Altria Group, Inc.’s key income statement figures for fiscal years 2021 through 2025, reflecting revenue, expenses, profits, and earnings per share.
| 2021 | 2022 | 2023 | 2024 | 2025 | |
|---|---|---|---|---|---|
| Revenue | 21.1B | 20.7B | 20.5B | 20.4B | 20.1B |
| Cost of Revenue | 7.1B | 6.4B | 6.2B | 6.1B | 2.7B |
| Operating Expenses | 2.4B | 2.3B | 2.7B | 3.1B | 2.4B |
| Gross Profit | 14.0B | 14.2B | 14.3B | 14.4B | 17.4B |
| EBITDA | 5.3B | 8.7B | 12.3B | 15.1B | 10.8B |
| EBIT | 5.0B | 8.5B | 12.1B | 14.8B | 10.6B |
| Interest Expense | 1.2B | 1.1B | 1.1B | 1.1B | 1.2B |
| Net Income | 2.5B | 5.8B | 8.1B | 11.3B | 6.9B |
| EPS | 1.34 | 3.19 | 4.61 | 6.54 | 4.11 |
| Filing Date | 2022-02-25 | 2023-02-27 | 2024-02-27 | 2025-02-26 | 2026-02-25 |
Income Statement Evolution
Between 2021 and 2025, Altria Group’s revenue declined by 4.6%, signaling top-line pressure. However, net income surged 180.7%, reflecting improved profitability. Gross margin climbed to 86.6%, indicating strong cost control. Despite a 28.5% drop in EBIT last year, net margin expanded overall, evidencing better bottom-line efficiency over the period.
Is the Income Statement Favorable?
In 2025, revenue fell 1.5%, yet gross profit rose 21.4%, driven by tighter cost management. Operating expenses grew slower than revenue, supporting margin expansion. Net margin stood at a solid 34.5%, with an EPS of $4.11, down 37% year-on-year but up over the longer term. Interest expense remains moderate at 5.8% of revenue. Overall, fundamentals appear favorable, balancing revenue headwinds with margin strength.
Financial Ratios
The table below summarizes key financial ratios for Altria Group, Inc. over the last five fiscal years, providing a clear snapshot of profitability, liquidity, leverage, and market valuation:
| Ratios | 2021 | 2022 | 2023 | 2024 | 2025 |
|---|---|---|---|---|---|
| Net Margin | 12% | 28% | 40% | 55% | 34% |
| ROE | -154% | -145% | -230% | -503% | -198% |
| ROIC | 23% | 31% | 30% | 33% | 43% |
| P/E | 35 | 14 | 9 | 8 | 14 |
| P/B | -54 | -21 | -20 | -40 | -28 |
| Current Ratio | 0.71 | 0.84 | 0.49 | 0.51 | 0.61 |
| Quick Ratio | 0.57 | 0.70 | 0.39 | 0.39 | 0.49 |
| D/E | -17 | -7 | -7 | -11 | -7 |
| Debt-to-Assets | 71% | 72% | 68% | 71% | 73% |
| Interest Coverage | 9.7x | 11x | 10x | 10x | 13x |
| Asset Turnover | 0.53 | 0.56 | 0.53 | 0.58 | 0.58 |
| Fixed Asset Turnover | 14 | 13 | 12 | 13 | 12 |
| Dividend Yield | 7.4% | 8.0% | 9.5% | 7.6% | 7.2% |
Evolution of Financial Ratios
From 2021 to 2025, Altria’s Return on Equity (ROE) remained negative, worsening to -198.37% in 2025, signaling declining shareholder profitability. The Current Ratio showed volatility but remained below 1.0, indicating liquidity constraints. Debt-to-Equity fluctuated negatively, reflecting complex capital structure dynamics. Profitability margins notably improved by 2025, with net margin rising to 34.5%.
Are the Financial Ratios Fovorable?
In 2025, Altria exhibits favorable profitability with a 34.5% net margin and a strong 42.95% ROIC surpassing its 5.5% WACC. Liquidity ratios are unfavorable, with a Current Ratio of 0.61 and Quick Ratio of 0.49 below ideal thresholds. Leverage is mixed; Debt-to-Equity is favorable at -7.34, yet Debt-to-Assets is high at 73.42%. Asset turnover is neutral, and dividend yield at 7.2% is moderate. Overall, 57% of key ratios are favorable, suggesting a cautiously positive financial profile.
Shareholder Return Policy
Altria maintains a consistent dividend policy with a payout ratio around 100% in 2025 and a dividend yield near 7.2%. The dividend per share has steadily increased over recent years. The company covers dividends comfortably with free cash flow and supplements returns with share buybacks.
This approach suggests a focus on returning capital to shareholders while sustaining long-term value. However, the payout ratio near or above 100% signals limited margin for error if cash flows decline, which warrants cautious monitoring.
Score analysis
The following radar chart displays key valuation and financial performance scores for the company:
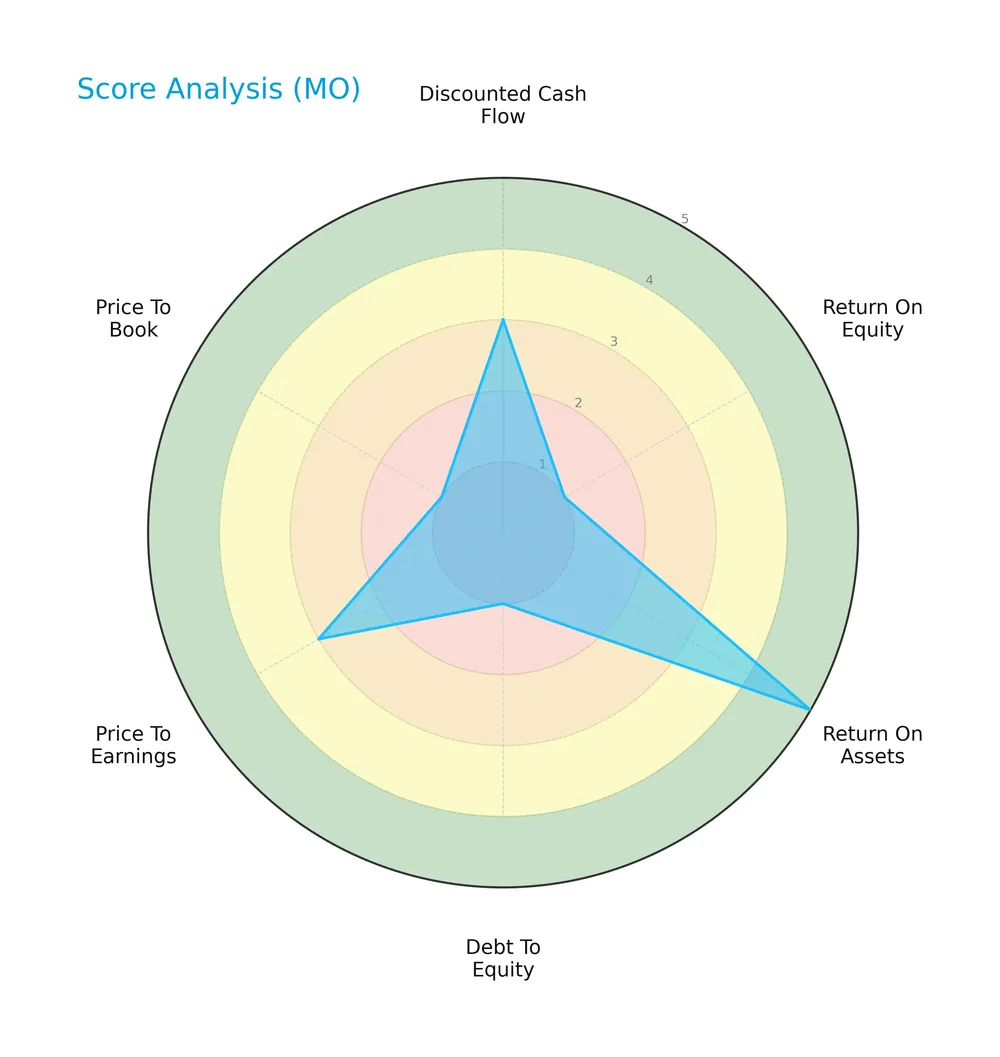
The discounted cash flow and price-to-earnings scores reflect moderate valuation appeal. However, return on equity, debt-to-equity, and price-to-book scores are very unfavorable, indicating concerns about profitability and leverage. Return on assets stands out as very favorable.
Analysis of the company’s bankruptcy risk
The Altman Z-Score places the company in the safe zone, suggesting low bankruptcy risk and solid financial stability:

Is the company in good financial health?
This Piotroski diagram evaluates the company’s financial strength based on profitability, leverage, liquidity, and efficiency:

With a strong Piotroski Score of 7, the company demonstrates solid financial health and operational efficiency, although not at the highest strength level.
Competitive Landscape & Sector Positioning
This section examines Altria Group, Inc.’s strategic position within the tobacco sector, focusing on its business segments and key products. I will assess how Altria measures against main competitors in this highly regulated industry. Next, I aim to determine whether the company holds a sustainable competitive advantage over its peers.
Strategic Positioning
Altria Group, Inc. focuses heavily on smokeable tobacco products, generating over $20B annually, with smokeless products contributing around $2.8B in 2025. Its portfolio remains concentrated in tobacco within the U.S., reflecting limited geographic and product diversification.
Revenue by Segment
This pie chart illustrates Altria Group’s revenue distribution by product segment for the fiscal year 2025, highlighting the contribution of each segment to the company’s total sales.

Altria’s revenue remains dominated by Smokeable Products at $20.5B, reflecting its core market strength despite a slight decline from prior years. Smokeless Products contribute $2.8B, showing modest growth and diversification. Other Segments generate only $5M, indicating minimal impact. The 2025 figures suggest a gradual concentration risk with the core segment still driving most revenue, underscoring the company’s reliance on traditional tobacco products.
Key Products & Brands
Altria Group’s key products and brands span smokeable, smokeless tobacco, and other segments:
| Product | Description |
|---|---|
| Marlboro | Leading cigarette brand driving the majority of Altria’s smokeable tobacco revenue. |
| Black & Mild | Principal cigar and pipe tobacco brand with a strong U.S. market presence. |
| Copenhagen | Moist smokeless tobacco product catering to a dedicated consumer base. |
| Skoal | Another core smokeless tobacco brand with a loyal following. |
| Red Seal | Part of the smokeless tobacco portfolio, appealing to niche segments. |
| Husky | Smokeless tobacco brand contributing to Altria’s oral tobacco offerings. |
| Oral Nicotine Pouches | Emerging category providing non-combustible nicotine alternatives. |
| Other Segments | Includes smaller product lines and segments, contributing marginal revenue. |
Altria’s portfolio centers on Marlboro cigarettes, complemented by strong smokeless tobacco brands and emerging oral nicotine products. Smokeable tobacco remains the dominant revenue driver, reflecting the company’s entrenched market position.
Main Competitors
There are 3 main competitors in the Tobacco industry; the table lists the top 3 leaders by market capitalization:
| Competitor | Market Cap. |
|---|---|
| Philip Morris International Inc. | 250B |
| British American Tobacco p.l.c. | 124B |
| Altria Group, Inc. | 96.2B |
Altria Group ranks 3rd among its competitors with a market cap 47% that of the leader, Philip Morris International. It sits below both the average market cap of the top 10 (157B) and the sector median (124B). The company is 6.2% behind British American Tobacco, its closest rival above.
Comparisons with competitors
Check out how we compare the company to its competitors:
Does Altria have a competitive advantage?
Altria Group, Inc. demonstrates a strong competitive advantage, supported by a very favorable moat rating. Its return on invested capital (ROIC) exceeds its weighted average cost of capital (WACC) by over 37%, indicating consistent value creation and efficient capital use.
Looking ahead, Altria’s well-known tobacco brands and expanding oral nicotine products position it to capitalize on evolving consumer preferences. This diversification offers growth opportunities in the US market despite recent revenue declines.
SWOT Analysis
This SWOT analysis highlights Altria Group’s strategic position by identifying its internal strengths and weaknesses alongside external opportunities and threats.
Strengths
- strong brand portfolio
- high gross margin (86.6%)
- favorable ROIC vs. WACC (43%)
Weaknesses
- declining revenue (-1.5% last year)
- low current and quick ratios (0.61, 0.49)
- high debt-to-assets (73%)
Opportunities
- expanding oral nicotine market
- potential for margin improvement
- stable dividend yield (7.2%)
Threats
- regulatory pressures
- shifting consumer preferences
- litigation risks
Altria’s strong profitability and competitive moat provide a solid foundation. However, weakening revenue and liquidity ratios signal caution. Strategic focus should target innovation in smokeless products while managing regulatory risks.
Stock Price Action Analysis
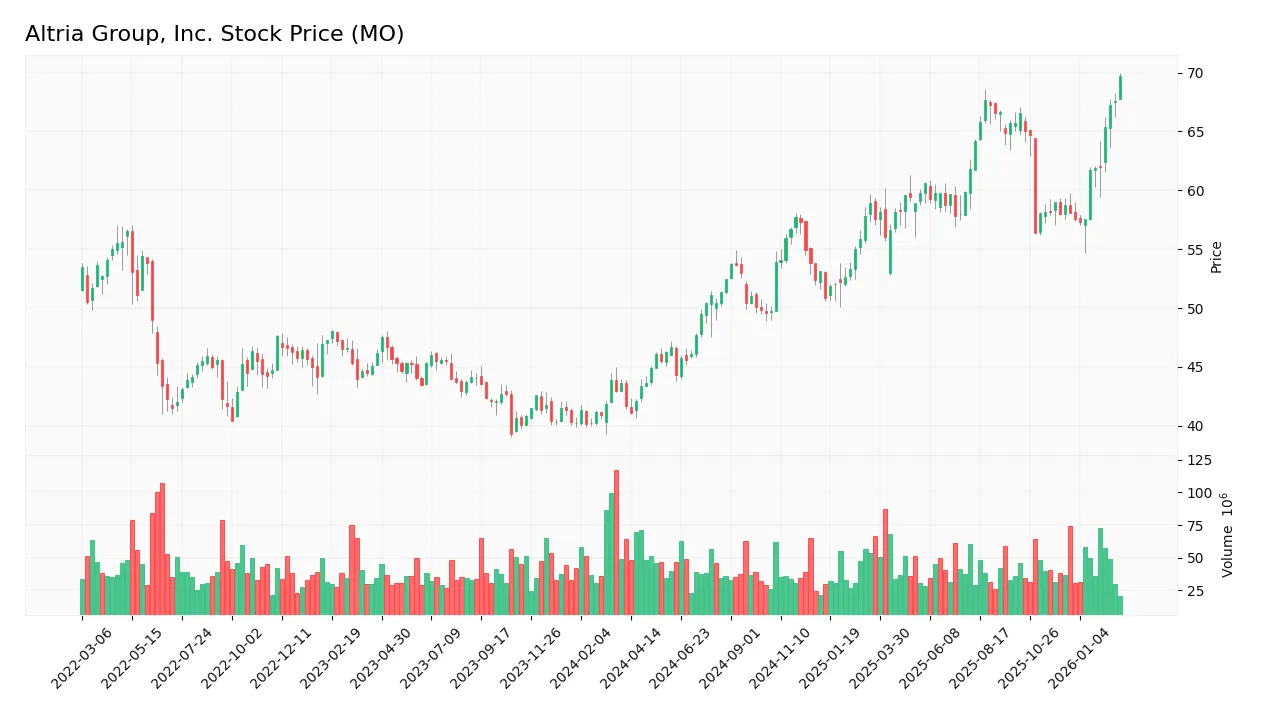
The weekly stock chart depicts Altria Group, Inc.’s price movements over the past 100 weeks, highlighting key trend shifts and volatility:
Trend Analysis
Over the past 100 weeks, Altria’s stock price rose 67.35%, signaling a bullish trend with clear acceleration. The price ranged from a low of 41.05 to a high of 69.7, supported by a volatility measure (std. dev.) of 6.77%. Recent data (Dec 2025–Mar 2026) show an 18.64% gain, confirming continued upward momentum.
Volume Analysis
Trading volumes over the last three months show a decreasing trend overall. Buyer volume dominates at 75.08%, indicating strong buyer-driven activity. This suggests robust investor interest and confidence despite the declining total market participation.
Target Prices
Analysts show a moderately bullish outlook for Altria Group, Inc., with a clear range of target prices reflecting cautious optimism.
| Target Low | Target High | Consensus |
|---|---|---|
| 47 | 68 | 61.25 |
The target prices indicate expectations of a potential upside near 11% from current levels, signaling measured confidence in Altria’s strategic positioning.

Don’t Let Luck Decide Your Entry Point
Optimize your entry points with our advanced ProRealTime indicators. You’ll get efficient buy signals with precise price targets for maximum performance. Start outperforming now!
Analyst & Consumer Opinions
This section reviews Altria Group, Inc. through analyst grades and consumer feedback to gauge market sentiment and brand perception.
Stock Grades
Here are the latest verified grades from established financial institutions for Altria Group, Inc.:
| Grading Company | Action | New Grade | Date |
|---|---|---|---|
| Barclays | Maintain | Underweight | 2026-02-23 |
| Citigroup | Maintain | Neutral | 2026-02-09 |
| Stifel | Maintain | Buy | 2026-01-30 |
| UBS | Maintain | Buy | 2026-01-26 |
| UBS | Upgrade | Buy | 2026-01-09 |
| UBS | Maintain | Neutral | 2025-10-31 |
| B of A Securities | Maintain | Buy | 2025-08-22 |
| Barclays | Maintain | Underweight | 2025-08-06 |
| Stifel | Maintain | Buy | 2025-07-31 |
| Morgan Stanley | Maintain | Equal Weight | 2025-07-31 |
The consensus reflects a generally positive outlook, with multiple firms maintaining buy ratings and UBS recently upgrading its stance. However, Barclays consistently holds an underweight view, indicating mixed sentiment among top analysts.
Consumer Opinions
Altria Group, Inc. evokes mixed emotions among its consumers, reflecting both loyalty and concern.
| Positive Reviews | Negative Reviews |
|---|---|
| Strong brand recognition and trust | Concerns over health risks associated |
| Consistent product quality | Limited innovation in product offerings |
| Reliable customer service | Perceived high pricing |
Overall, consumers appreciate Altria’s trusted brands and consistent quality. However, health concerns and lack of product innovation remain persistent issues dampening enthusiasm.
Risk Analysis
Below is a summary of key risks facing Altria Group, Inc., including their likelihood and potential impact:
| Category | Description | Probability | Impact |
|---|---|---|---|
| Regulatory Risk | Increasing tobacco regulations and potential tax hikes | High | High |
| Financial Leverage | High debt-to-assets ratio at 73.4% raises solvency concerns | Medium | High |
| Liquidity Risk | Low current ratio of 0.61 signals potential short-term stress | Medium | Medium |
| Profitability Risk | Negative ROE (-198%) indicates inefficient equity use | Medium | Medium |
| Market Risk | Beta of 0.5 suggests moderate sensitivity to market swings | Low | Medium |
The most pressing risks stem from Altria’s heavy leverage and regulatory pressures. Despite a strong Altman Z-Score (3.28, safe zone), the 73% debt-to-assets ratio and weak liquidity ratios warrant caution. Regulatory tightening remains a persistent threat, impacting pricing power and margins.
Should You Buy Altria Group, Inc.?
Altria Group appears to be generating strong value creation with a durable moat supported by growing ROIC well above WACC. Despite a challenging leverage profile and mixed profitability signals, its overall B- rating suggests a cautiously favorable investment profile.
Strength & Efficiency Pillars
Altria Group, Inc. demonstrates robust operational efficiency, with a commanding net margin of 34.5% and an EBIT margin of 52.47%. Its return on invested capital (ROIC) stands at an impressive 42.95%, comfortably exceeding the weighted average cost of capital (WACC) at 5.5%, confirming the company as a clear value creator. Despite a negative return on equity (ROE) of -198.37%, the company’s growing ROIC trend and strong gross margin of 86.59% underscore a durable competitive advantage and solid profitability.
Weaknesses and Drawbacks
The company’s valuation and liquidity metrics raise concerns. The current ratio at 0.61 and quick ratio at 0.49 indicate tight short-term liquidity, which warrants caution. While debt-to-equity is favorable at -7.34, a high debt-to-assets ratio of 73.42% suggests significant leverage risk. Additionally, mixed valuation signals surface with a moderate price-to-earnings (P/E) ratio of 13.92 and a price-to-book (P/B) ratio of -27.61, complicating a clear assessment on market valuation grounds.
Our Final Verdict about Altria Group, Inc.
Altria’s financial health sits comfortably in the safe zone with an Altman Z-Score of 3.28 and a strong Piotroski score of 7, supporting a fundamentally sound profile. The bullish overall stock trend combined with strong buyer dominance recently suggests positive momentum. However, the valuation complexities and liquidity constraints suggest that while the company might appear attractive for long-term exposure, investors should consider timing entries prudently.
Disclaimer: This content is for informational purposes only and does not constitute financial, investment, or other professional advice. Investing in financial markets involves a significant risk of loss, and past performance is not indicative of future results.
Additional Resources
- Altria Group, Inc. $MO Stock Holdings Lifted by AlphaCore Capital LLC – MarketBeat (Feb 26, 2026)
- Decoding Altria Group Inc (MO): A Strategic SWOT Insight – GuruFocus (Feb 26, 2026)
- ALTRIA GROUP, INC. SEC 10-K Report – TradingView (Feb 25, 2026)
- Altria Group, Inc. (MO) is Attracting Investor Attention: Here is What You Should Know – Yahoo Finance (Feb 18, 2026)
- Altria Group, Inc. $MO Shares Sold by Stevens Capital Management LP – MarketBeat (Feb 22, 2026)
For more information about Altria Group, Inc., please visit the official website: altria.com