Home > Analyses > Technology > Alphabet Inc.
Alphabet Inc. transforms how billions connect, work, and discover every day through its vast digital ecosystem. As the architect behind Google Search, YouTube, Android, and Google Cloud, it shapes global information flow and enterprise innovation. Renowned for relentless innovation and market dominance, Alphabet commands a unique moat in internet content and cloud computing. Now, investors must ask: Do its robust fundamentals still justify its lofty market valuation and future growth potential?

Table of contents
Business Model & Company Overview
Alphabet Inc., founded in 1998 and headquartered in Mountain View, California, commands a dominant position in the Internet Content & Information industry. Its ecosystem integrates Google Services, Google Cloud, and Other Bets, uniting products like Android, YouTube, Pixel phones, and cloud collaboration tools under one expansive digital umbrella. This cohesive platform drives innovation and user engagement across global markets.
The company’s revenue engine balances advertising through Google Services, subscription and enterprise fees in Google Cloud, and consumer hardware sales like Fitbit and Nest. Alphabet’s footprint spans the Americas, Europe, Asia-Pacific, and beyond, fueling growth in both mature and emerging markets. Its wide economic moat stems from deep user data, brand loyalty, and scalable infrastructure that shape the future of digital services worldwide.
Financial Performance & Fundamental Metrics
I analyze Alphabet Inc.’s income statement, key financial ratios, and dividend payout policy to assess its profitability, efficiency, and shareholder returns.
Income Statement
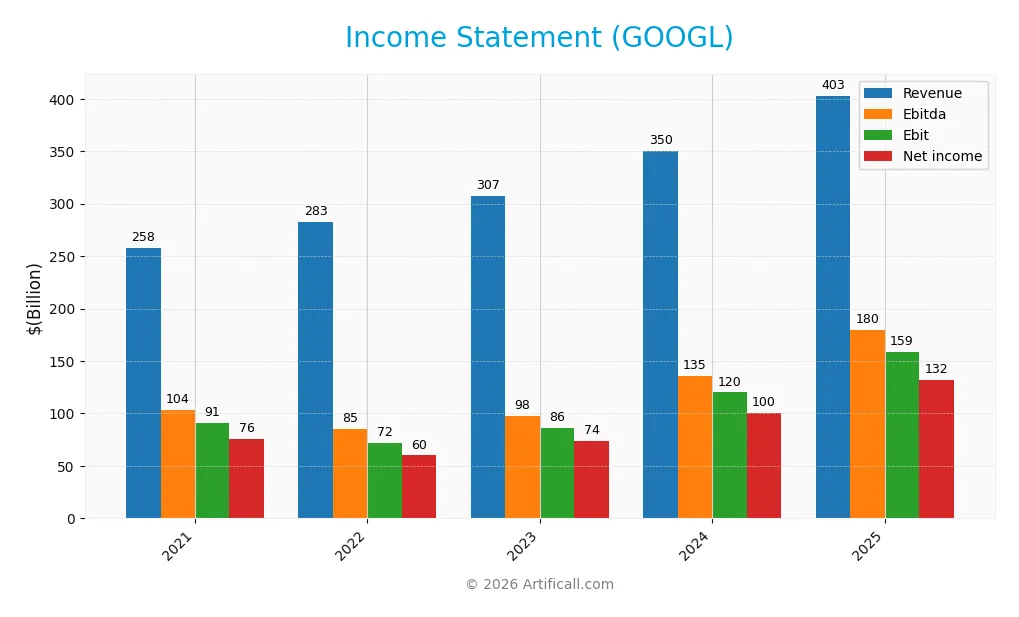
The table below shows Alphabet Inc.’s key income statement figures for fiscal years 2021 through 2025, reported in USD.
| 2021 | 2022 | 2023 | 2024 | 2025 | |
|---|---|---|---|---|---|
| Revenue | 258B | 283B | 307B | 350B | 403B |
| Cost of Revenue | 111B | 126B | 133B | 146B | 163B |
| Operating Expenses | 68B | 82B | 90B | 91B | 111B |
| Gross Profit | 147B | 157B | 174B | 204B | 240B |
| EBITDA | 104B | 85B | 98B | 135B | 180B |
| EBIT | 91B | 72B | 86B | 120B | 159B |
| Interest Expense | 346M | 357M | 308M | 268M | 143M |
| Net Income | 76B | 60B | 74B | 100B | 132B |
| EPS | 5.69 | 4.59 | 5.84 | 8.13 | 10.91 |
| Filing Date | 2022-02-02 | 2023-02-03 | 2024-01-31 | 2025-02-05 | 2026-02-05 |
Income Statement Evolution
Alphabet’s revenue rose steadily from $258B in 2021 to $403B in 2025, marking a 56% increase. Net income grew even faster, up 74% over the same period, reflecting margin expansion. Gross margin improved to nearly 60%, while net margin reached 33%, showing consistent profitability gains amid rising operating expenses.
Is the Income Statement Favorable?
In 2025, Alphabet reported $403B revenue and $132B net income, with net margin at a strong 32.8%. EBIT surged 32% year-over-year, driven by robust gross profit growth of 18%. Operating expenses grew in line with revenue, a slight unfavorable trend. Overall, fundamentals remain favorable, supported by healthy margins and impressive EPS growth of 34%.
Financial Ratios
The table below summarizes key financial ratios for Alphabet Inc. (GOOGL) over the last five fiscal years, illustrating its profitability, valuation, liquidity, leverage, and efficiency:
| Ratios | 2021 | 2022 | 2023 | 2024 | 2025 |
|---|---|---|---|---|---|
| Net Margin | 30% | 21% | 24% | 29% | 33% |
| ROE | 30% | 23% | 26% | 31% | 32% |
| ROIC | 22% | 21% | 22% | 26% | 22% |
| P/E | 25.4 | 19.2 | 23.9 | 23.3 | 28.7 |
| P/B | 7.7 | 4.5 | 6.2 | 7.2 | 9.1 |
| Current Ratio | 2.93 | 2.38 | 2.10 | 1.84 | 2.01 |
| Quick Ratio | 2.91 | 2.34 | 2.10 | 1.84 | 2.01 |
| D/E | 0.11 | 0.12 | 0.10 | 0.08 | 0.14 |
| Debt-to-Assets | 8% | 8% | 7% | 6% | 10% |
| Interest Coverage | 227x | 210x | 274x | 419x | 0 |
| Asset Turnover | 0.72 | 0.77 | 0.76 | 0.78 | 0.68 |
| Fixed Asset Turnover | 2.33 | 2.23 | 2.07 | 1.90 | 1.54 |
| Dividend Yield | 0% | 0% | 0% | 0.32% | 0.26% |
Evolution of Financial Ratios
From 2021 to 2025, Alphabet’s Return on Equity (ROE) improved steadily from 30.2% to 31.8%. The Current Ratio showed a declining trend, falling from 2.93 to 2.01, indicating a slight reduction in short-term liquidity. The Debt-to-Equity Ratio remained low and stable, rising moderately from 0.11 to 0.14, reflecting disciplined leverage management. Profitability margins increased, with net margin advancing from 24.0% in 2023 to 32.8% in 2025.
Are the Financial Ratios Fovorable?
In 2025, Alphabet’s profitability is robust, with a net margin of 32.8% and ROE at 31.8%, both rated favorable. Liquidity ratios, including current and quick ratios around 2.0, also appear favorable, supporting operational stability. Leverage metrics remain conservative, with debt-to-equity at 0.14 and debt-to-assets below 10%. However, valuation multiples like P/E at 28.7 and P/B at 9.13 are unfavorable, suggesting a premium price. Overall, 57% of the key ratios are favorable, endorsing a generally positive financial profile.
Shareholder Return Policy
Alphabet Inc. pays a modest dividend with a payout ratio around 7.6% and a yield near 0.26%. The dividend per share has steadily increased, supported by free cash flow coverage and balanced capital expenditures. The company also engages in share buybacks, enhancing shareholder value alongside dividends.
This disciplined distribution approach aligns with sustainable long-term value creation. Alphabet maintains strong profitability and cash flow, avoiding excessive payouts or repurchases that could strain financial flexibility. The policy reflects prudent capital allocation consistent with its growth and innovation strategy.
Score analysis
The following radar chart illustrates Alphabet Inc.’s key financial scores across valuation, profitability, and leverage metrics:
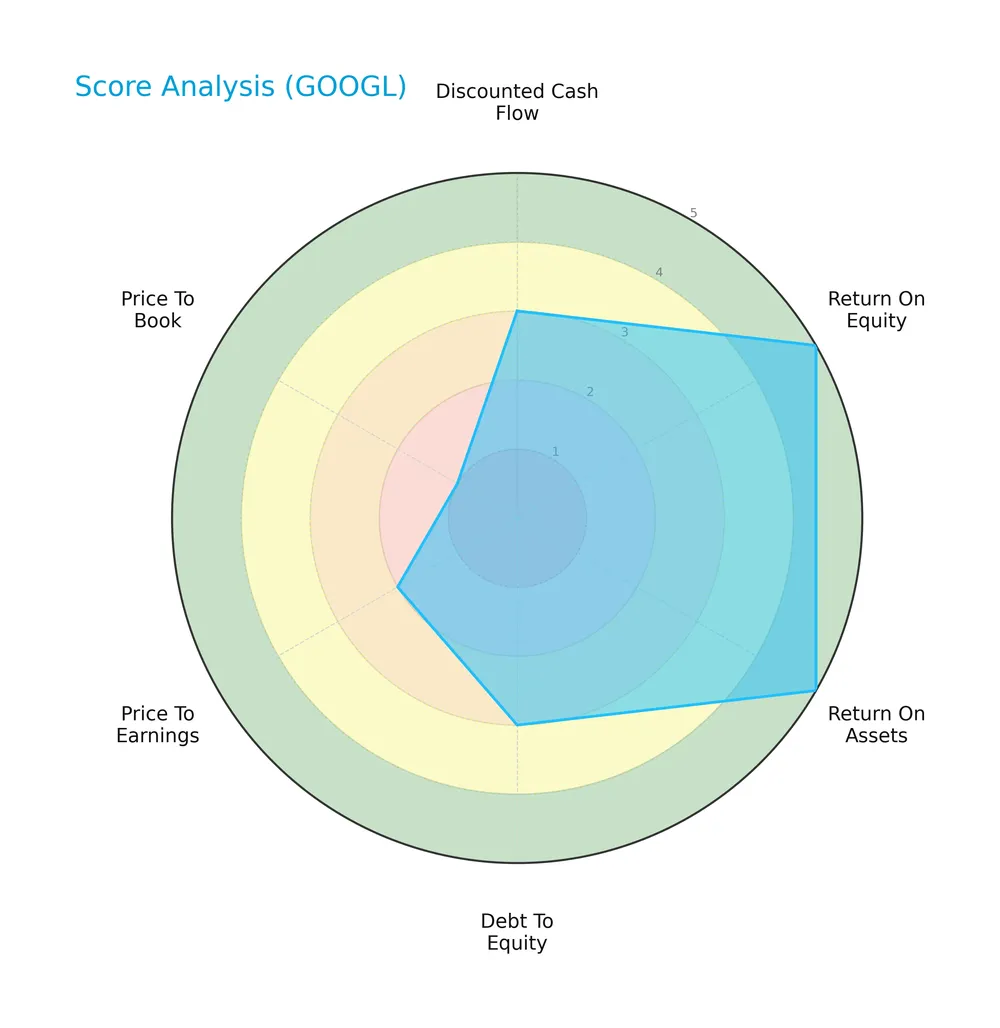
Alphabet shows very favorable returns on equity and assets with scores of 5 each. Its discounted cash flow and debt-to-equity scores are moderate at 3. Valuation metrics lag, with price-to-earnings at 2 and price-to-book at a very unfavorable 1.
Analysis of the company’s bankruptcy risk
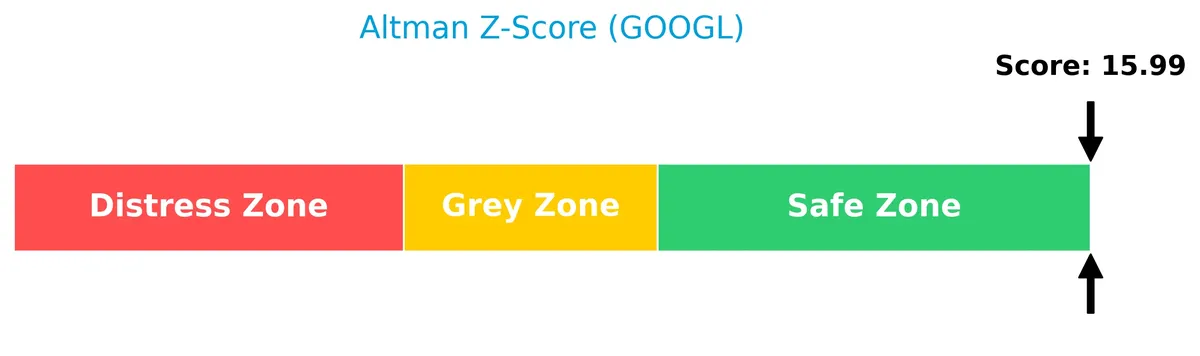
Alphabet’s Altman Z-Score places it firmly in the safe zone, indicating a very low risk of bankruptcy:
Is the company in good financial health?
The Piotroski Score diagram below highlights Alphabet’s strong financial health based on multiple accounting criteria:
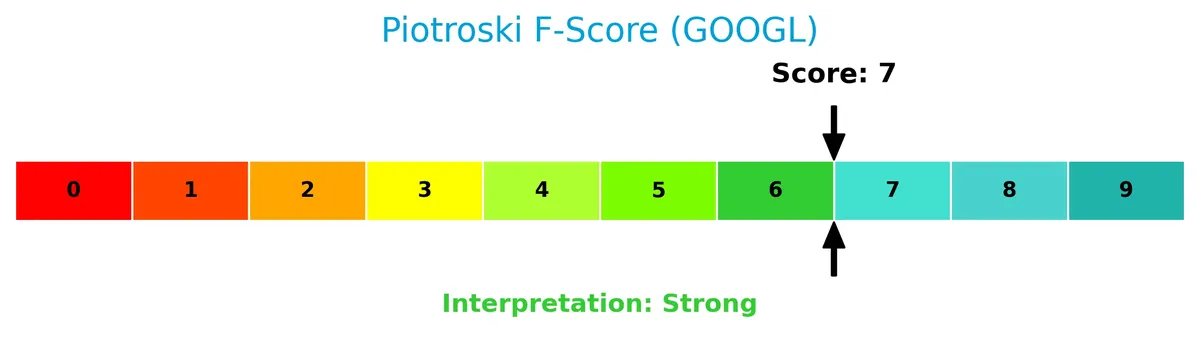
With a score of 7, Alphabet ranks as strong, reflecting solid profitability, efficiency, and liquidity, though not at the highest echelon of financial robustness.
Competitive Landscape & Sector Positioning
This section analyzes Alphabet Inc.’s strategic positioning within the technology sector. I will examine its revenue by segment, key products, and main competitors. I aim to determine whether Alphabet holds a competitive advantage over its peers.
Strategic Positioning
Alphabet Inc. maintains a diversified product portfolio spanning Google Services, Cloud, and Other Bets with strong growth across advertising, subscriptions, and cloud segments. Its geographic exposure covers the U.S., EMEA, Asia Pacific, and Americas, balancing mature and emerging markets effectively.
Revenue by Segment
This pie chart displays Alphabet Inc.’s revenue distribution by segment for fiscal year 2025, highlighting the composition of its diverse business units.
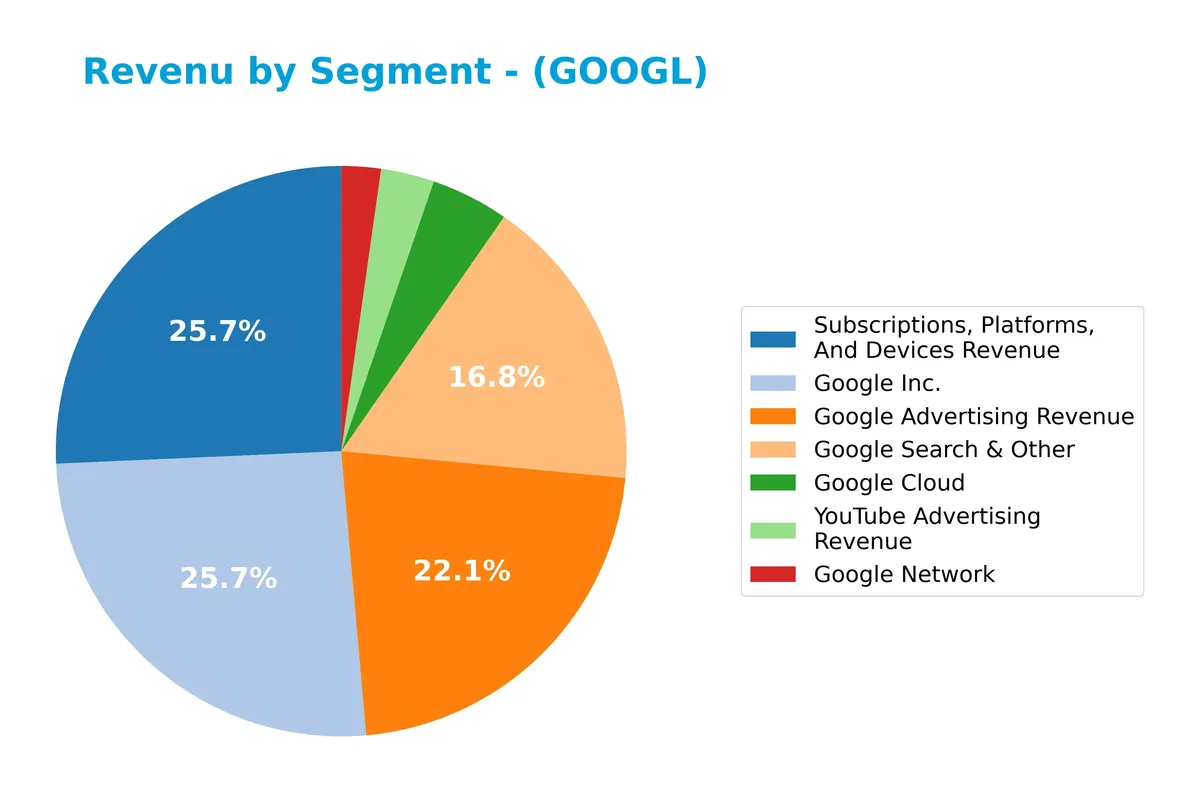
In 2025, Subscriptions, Platforms, And Devices dominate with $343B, reflecting Alphabet’s strategic expansion beyond advertising. Google Search & Other leads core advertising at $225B, supported by YouTube Ads at $40B and Google Network at $30B. Google Cloud’s $59B marks robust growth, signaling a shift toward cloud services. The revenue concentration in a few large segments calls for attention to diversification risks despite strong overall growth.
Key Products & Brands
The table below outlines Alphabet Inc.’s core products and brands along with their primary functions:
| Product | Description |
|---|---|
| Google Search & Other | Search engine services and related offerings, generating the largest revenue stream. |
| YouTube Advertising | Advertising services on YouTube platform, a major digital video advertising source. |
| Google Network | Advertising revenues from Google’s network members’ properties. |
| Subscriptions, Platforms, And Devices | Includes Google Play app sales, subscriptions, Fitbit wearables, Nest products, and Pixel phones. |
| Google Cloud | Cloud infrastructure, platform services, and enterprise collaboration tools like Workspace. |
| Other Bets | Health technology and internet services outside core Google operations. |
Alphabet’s product lineup spans dominant digital advertising, cloud computing, consumer hardware, and innovation segments. Search and advertising remain the revenue backbone, while cloud and devices show robust growth potential.
Main Competitors
There are 6 main competitors in the sector. The table below lists the top 6 leaders by market capitalization:
| Competitor | Market Cap. |
|---|---|
| Alphabet Inc. | 3.8T |
| Meta Platforms, Inc. | 1.6T |
| DoorDash, Inc. | 95B |
| Baidu, Inc. | 44B |
| Twilio Inc. | 22B |
| Snap Inc. | 14B |
Alphabet Inc. ranks 1st among its 6 competitors, with a market cap 5% larger than the next largest player. It stands well above the top 10 average of 936B and the sector median of 69.5B. The company holds a dominant lead, with a 143% market cap gap to the closest rival below it.
Comparisons with competitors
Check out how we compare the company to its competitors:
Does Alphabet have a competitive advantage?
Alphabet presents a competitive advantage, generating returns well above its cost of capital with a strong 13% ROIC versus WACC. Its consistent value creation outpaces many peers in the Technology sector.
Looking ahead, Alphabet’s broad product ecosystem, including Google Services and Cloud, supports growth in diverse markets globally. Expansion in Asia-Pacific and innovations in health tech offer new revenue opportunities.
SWOT Analysis
This SWOT analysis highlights Alphabet Inc.’s core competitive position and strategic challenges in 2026.
Strengths
- dominant global market share
- strong revenue growth (15% YoY)
- high ROIC (21.8%) above WACC
- robust net margin (32.8%)
- diversified revenue streams
- excellent liquidity (current ratio 2.01)
Weaknesses
- high valuation multiples (PE 28.7, PB 9.1)
- declining ROIC trend
- low dividend yield (0.26%)
- rising operating expenses growth (15.1%)
- heavy dependence on US market (49% revenue)
Opportunities
- expansion in Asia Pacific and EMEA markets
- growth in Google Cloud and enterprise solutions
- innovation in Other Bets segment
- increasing demand for AI and advertising tech
- potential for strategic acquisitions
Threats
- regulatory scrutiny and antitrust risks
- intensifying competition in cloud and ads
- geopolitical tensions impacting global revenues
- technology disruption risk
- market volatility affecting ad spend
Alphabet’s strengths in market dominance and profitability provide a solid foundation. However, elevated valuation and rising costs require cautious capital allocation. The firm must capitalize on international growth and innovation while managing regulatory and competitive pressures.
Stock Price Action Analysis
The weekly stock chart below illustrates Alphabet Inc.’s price movements and volatility over the past 12 months:
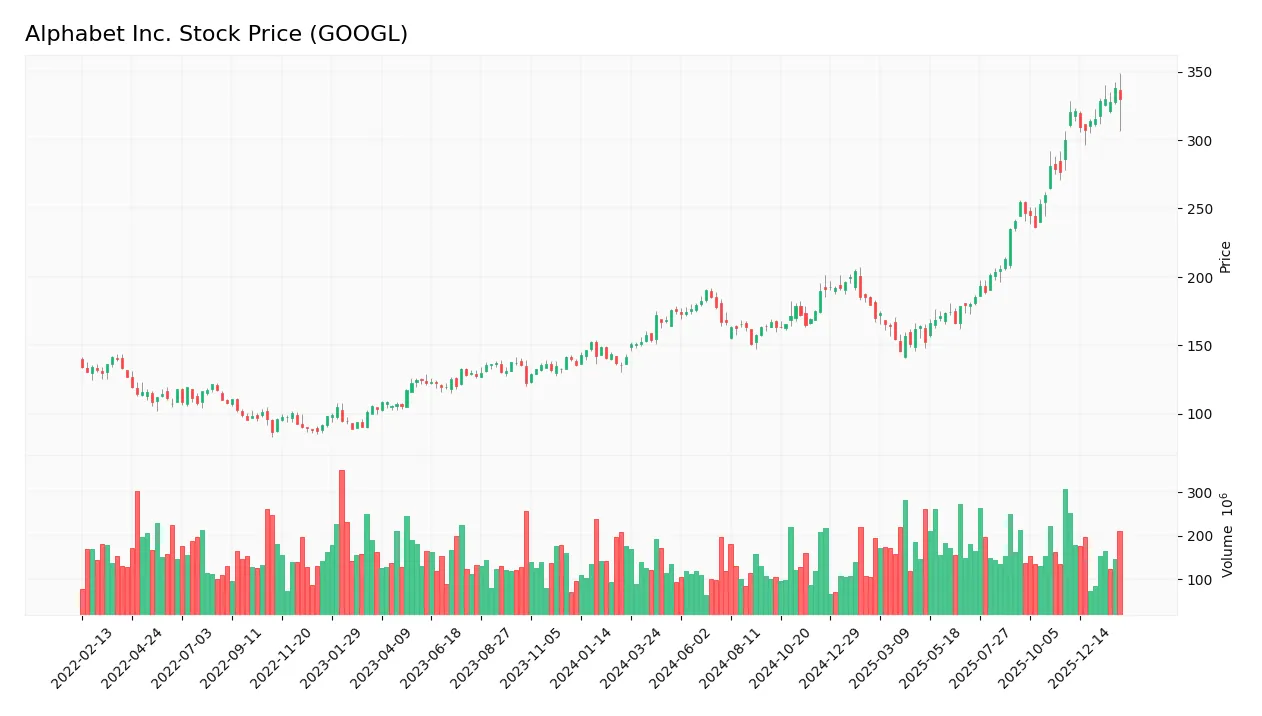
Trend Analysis
Over the past 12 months, Alphabet’s stock gained 133.83%, indicating a strong bullish trend with accelerating momentum. Price fluctuated significantly, ranging from a low of 141.18 to a high of 338.0, supported by a high volatility level (std. dev. 53.28).
Volume Analysis
Trading volume over the last three months shows a clear buyer-driven pattern. Buyer volume reached 1.36B versus seller volume of 708M, representing 65.78% buyer dominance. Volume is increasing, signaling growing investor interest and positive market participation.
Target Prices
Analysts present a balanced target price consensus for Alphabet Inc., reflecting cautious optimism.
| Target Low | Target High | Consensus |
|---|---|---|
| 270 | 415 | 351.77 |
The target range spans from 270 to 415, with a consensus near 352, indicating moderate upside potential amid sector volatility.

Don’t Let Luck Decide Your Entry Point
Optimize your entry points with our advanced ProRealTime indicators. You’ll get efficient buy signals with precise price targets for maximum performance. Start outperforming now!
Analyst & Consumer Opinions
This section reviews analyst ratings and consumer feedback to provide insights into Alphabet Inc.’s market perception.
Stock Grades
Here are the latest verified grades for Alphabet Inc. from recognized financial analysts as of early 2026:
| Grading Company | Action | New Grade | Date |
|---|---|---|---|
| Pivotal Research | Maintain | Buy | 2026-02-05 |
| Citizens | Maintain | Market Outperform | 2026-02-05 |
| Evercore ISI Group | Maintain | Outperform | 2026-02-05 |
| Roth Capital | Maintain | Buy | 2026-02-05 |
| Wells Fargo | Maintain | Equal Weight | 2026-02-05 |
| Needham | Maintain | Buy | 2026-02-05 |
| Piper Sandler | Maintain | Overweight | 2026-02-05 |
| Rosenblatt | Maintain | Neutral | 2026-02-05 |
| Stifel | Maintain | Buy | 2026-02-05 |
| Cantor Fitzgerald | Maintain | Overweight | 2026-02-05 |
Analysts consistently maintain positive ratings, with most favoring Buy or Outperform classifications. The few neutral or equal weight grades suggest cautious optimism amid steady confidence in Alphabet’s prospects.
Consumer Opinions
Consumer sentiment around Alphabet Inc. remains vibrant, reflecting strong brand loyalty and ongoing innovation.
| Positive Reviews | Negative Reviews |
|---|---|
| “Google’s search accuracy and speed remain unmatched.” | “Privacy concerns persist despite recent improvements.” |
| “The integration across Google services is seamless.” | “Customer support can be slow and unresponsive.” |
| “Innovative products like Google Assistant simplify life.” | “Some apps feel bloated with unnecessary features.” |
Overall, consumers praise Alphabet’s innovation and ecosystem integration. However, privacy issues and customer service gaps frequently dampen user experience.
Risk Analysis
Below is a table summarizing key risks facing Alphabet Inc., including their likelihood and potential impact:
| Category | Description | Probability | Impact |
|---|---|---|---|
| Regulatory Risk | Increased antitrust scrutiny and potential fines globally. | High | High |
| Valuation Risk | Elevated P/B ratio signals possible overvaluation concerns. | Medium | Medium |
| Market Volatility | Beta above 1 indicates sensitivity to market swings. | Medium | Medium |
| Competitive Risk | Intensifying cloud and ad tech competition pressure margins. | Medium | High |
| Innovation Risk | Failure to monetize Other Bets segment impacts growth. | Low | Medium |
I highlight regulatory risk as the most likely and impactful threat. Alphabet faces ongoing antitrust investigations worldwide, threatening fines and forced structural changes. Meanwhile, its valuation remains stretched versus S&P 500 averages, cautioning investors. Competitive pressures in cloud computing and digital advertising persist, but strong profitability and liquidity ratios provide buffers.
Should You Buy Alphabet Inc.?
Alphabet Inc. appears to be a robust value creator with a slightly favorable moat, reflecting strong operational efficiency despite a declining ROIC. Its leverage profile is manageable, supported by a very favorable B+ rating and a safe-zone Altman Z-Score, suggesting financial stability.
Strength & Efficiency Pillars
Alphabet Inc. exhibits robust profitability with a net margin of 32.81% and a return on equity of 31.83%. Its return on invested capital (ROIC) stands at 21.8%, significantly exceeding the weighted average cost of capital (WACC) of 8.86%, confirming the company as a clear value creator. Financial stability is equally impressive, with an Altman Z-score of 15.99, placing it firmly in the safe zone, and a Piotroski score of 7, indicating strong financial health. These metrics underscore Alphabet’s efficiency in capital allocation and resilience in a competitive tech landscape.
Weaknesses and Drawbacks
Despite strong fundamentals, Alphabet faces valuation headwinds. Its price-to-earnings ratio of 28.69 and price-to-book ratio of 9.13 suggest a stretched premium, raising concerns about potential overvaluation. The company’s modest dividend yield of 0.26% offers limited income appeal. While leverage remains conservative with a debt-to-equity ratio of 0.14, the elevated P/B ratio signals risk if market sentiment shifts. Investors should monitor these valuation risks closely amid an elevated market multiple environment.
Our Verdict about Alphabet Inc.
Alphabet’s long-term fundamentals appear favorable, supported by strong profitability, value creation, and financial health. Coupled with a bullish overall stock trend and buyer-dominant recent period, the profile may appear attractive for long-term exposure. However, the high valuation multiples introduce caution, suggesting that investors might consider timing their entry to optimize risk-adjusted returns.
Disclaimer: This content is for informational purposes only and does not constitute financial, investment, or other professional advice. Investing in financial markets involves a significant risk of loss, and past performance is not indicative of future results.
Additional Resources
- Alphabet set to report Q4 earnings in test of stock’s rally amid Google’s AI wins – Yahoo Finance (Feb 04, 2026)
- Bank of America’s blunt 3-word note on Alphabet stock before earnings – thestreet.com (Feb 03, 2026)
- Alphabet stock sinks after Google parent announces $180 billion spending plan for 2026 in massive AI bet – Yahoo! Finance Canada (Feb 05, 2026)
- GOOGL Stock: Alphabet Earnings Overshadowed by CapEx – Barron’s (Feb 05, 2026)
- Why Alphabet (GOOGL) stock crashed today, Feb 5: what happened to Alphabet shares as the US stock market t – The Economic Times (Feb 05, 2026)
For more information about Alphabet Inc., please visit the official website: abc.xyz