Home > Analyses > Industrials > Allegion plc
Allegion shapes everyday security by safeguarding homes, offices, and institutions worldwide. It commands the security and protection services sector with renowned brands like Schlage and CISA. Allegion’s blend of mechanical and electronic locking solutions drives innovation and reliability in access control. As digital threats evolve and infrastructure demands grow, I explore whether Allegion’s solid fundamentals still justify its current market valuation and promise sustained growth.

Table of contents
Business Model & Company Overview
Allegion plc, founded in 2013 and headquartered in Dublin, Ireland, stands as a leader in security and protection services. It integrates mechanical and electronic security products into a seamless ecosystem, serving commercial, institutional, and residential markets worldwide. Its portfolio spans door closers, locks, access control systems, and workforce productivity tools under prominent brands like Schlage and Von Duprin.
The company’s revenue engine balances hardware sales with software-driven access control and recurring service contracts. Allegion maintains a strategic footprint across the Americas, Europe, and Asia, leveraging diverse distribution channels including specialty retail and e-commerce. Its wide-ranging product suite and global reach create a durable economic moat that underpins long-term industry influence.
Financial Performance & Fundamental Metrics
I analyze Allegion plc’s income statement, key financial ratios, and dividend payout policy to assess its operational efficiency and shareholder returns.
Income Statement
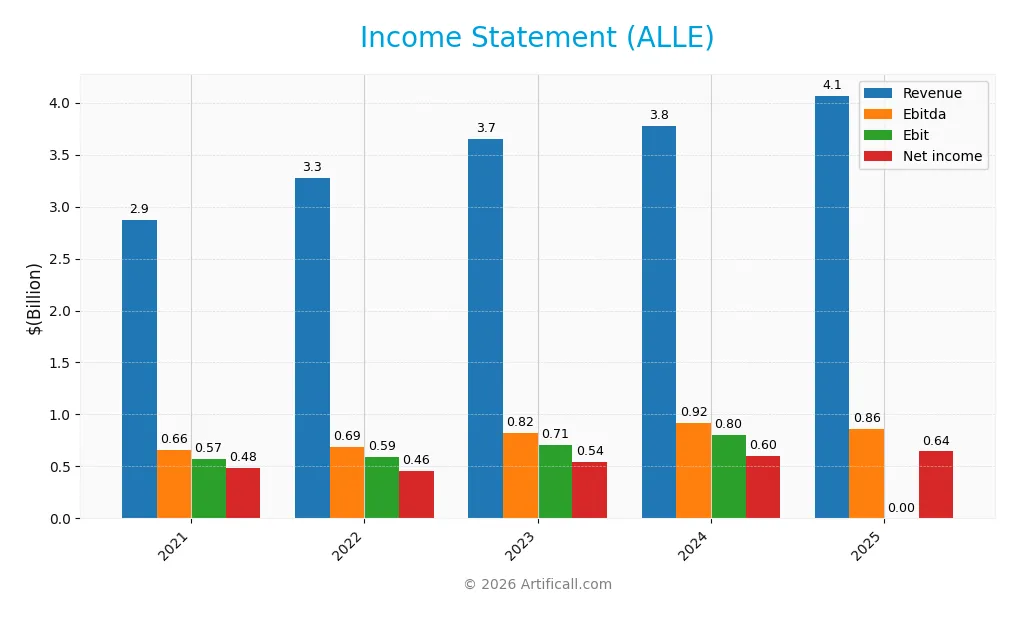
This table summarizes Allegion plc’s key income statement figures for fiscal years 2021 through 2025, highlighting revenue, expenses, and profitability metrics.
| 2021 | 2022 | 2023 | 2024 | 2025 | |
|---|---|---|---|---|---|
| Revenue | 2.87B | 3.27B | 3.65B | 3.77B | 4.07B |
| Cost of Revenue | 1.66B | 1.95B | 2.07B | 2.10B | 0 |
| Operating Expenses | 675M | 736M | 873M | 888M | 979M |
| Gross Profit | 1.20B | 1.32B | 1.58B | 1.67B | 0 |
| EBITDA | 657M | 688M | 822M | 917M | 860M |
| EBIT | 574M | 590M | 710M | 801M | 0 |
| Interest Expense | 50M | 76M | 93M | 102M | 101M |
| Net Income | 483M | 458M | 540M | 598M | 644M |
| EPS | 5.37 | 5.20 | 6.15 | 6.85 | 7.49 |
| Filing Date | 2022-02-15 | 2023-02-22 | 2024-02-20 | 2025-02-18 | 2026-02-17 |
Income Statement Evolution
Allegion’s revenue increased steadily from 2.87B in 2021 to 4.07B in 2025, marking a 41.85% growth over five years. Net income followed suit, rising from 483M to 644M, a 33.29% increase. However, gross and EBIT margins declined notably in 2025, reflecting margin pressure despite top-line growth. Net margin remained relatively stable around 15.8%.
Is the Income Statement Favorable?
The 2025 income statement shows mixed fundamentals. Revenue growth of 7.82% is neutral, but the absence of reported gross profit and EBIT suggests reporting anomalies or restructuring. Interest expenses are well-managed at 2.48% of revenue, supporting net margins near 16%. EPS growth of 9.09% is positive, yet the overall income statement evaluation is unfavorable due to margin contraction and incomplete cost details.
Financial Ratios
The table below summarizes key financial ratios for Allegion plc from 2021 to 2025, highlighting profitability, liquidity, leverage, and valuation metrics:
| Ratios | 2021 | 2022 | 2023 | 2024 | 2025 |
|---|---|---|---|---|---|
| Net Margin | 17% | 14% | 15% | 16% | 16% |
| ROE | 64% | 49% | 41% | 40% | 26% |
| ROIC | 20% | 16% | 17% | 17% | 16% |
| P/E | 25 | 20 | 21 | 19 | 0 |
| P/B | 16 | 10 | 8 | 8 | 0 |
| Current Ratio | 1.86 | 1.73 | 1.26 | 2.04 | 1.84 |
| Quick Ratio | 1.23 | 1.05 | 0.85 | 1.43 | 1.84 |
| D/E | 1.90 | 2.22 | 1.53 | 1.43 | 0.80 |
| Debt-to-Assets | 47% | 52% | 47% | 48% | 38% |
| Interest Coverage | 11 | 8 | 8 | 8 | 9 |
| Asset Turnover | 0.94 | 0.82 | 0.85 | 0.84 | 0.78 |
| Fixed Asset Turnover | 10.1 | 10.6 | 10.2 | 9.8 | 0 |
| Dividend Yield | 1.1% | 1.6% | 1.4% | 1.5% | 0% |
All values are rounded for clarity. Zero values indicate data not reported or unavailable.
Evolution of Financial Ratios
Return on Equity (ROE) for Allegion plc showed a decline from 63.6% in 2021 to 25.9% in 2025, indicating reduced profitability. The Current Ratio remained relatively stable, fluctuating between 1.26 and 2.04, suggesting consistent liquidity. Debt-to-Equity Ratio decreased from 2.22 in 2022 to 0.80 in 2025, reflecting a notable deleveraging trend.
Are the Financial Ratios Fovorable?
In 2025, Allegion’s profitability metrics, including net margin at 15.8% and ROE at 25.9%, are favorable, outperforming typical sector averages. Liquidity ratios, with a current and quick ratio of 1.84, also favor stability. However, debt-related ratios are neutral, and interest coverage is unfavorable, signaling potential risks in debt servicing. Overall, the ratio profile appears slightly favorable but warrants cautious monitoring.
Shareholder Return Policy
Allegion plc maintains a dividend payout ratio near 27%, with a steady dividend per share growth and a current yield around 1.46%. The company supports distributions through robust free cash flow coverage and also engages in share buybacks.
This balanced approach combines dividends and buybacks, appearing sustainable given free cash flow strength and moderate payout. It aligns with prudent capital allocation, supporting long-term shareholder value without overleveraging risks.
Score analysis
The radar chart below presents key financial scores evaluating the company’s valuation, profitability, and leverage metrics:
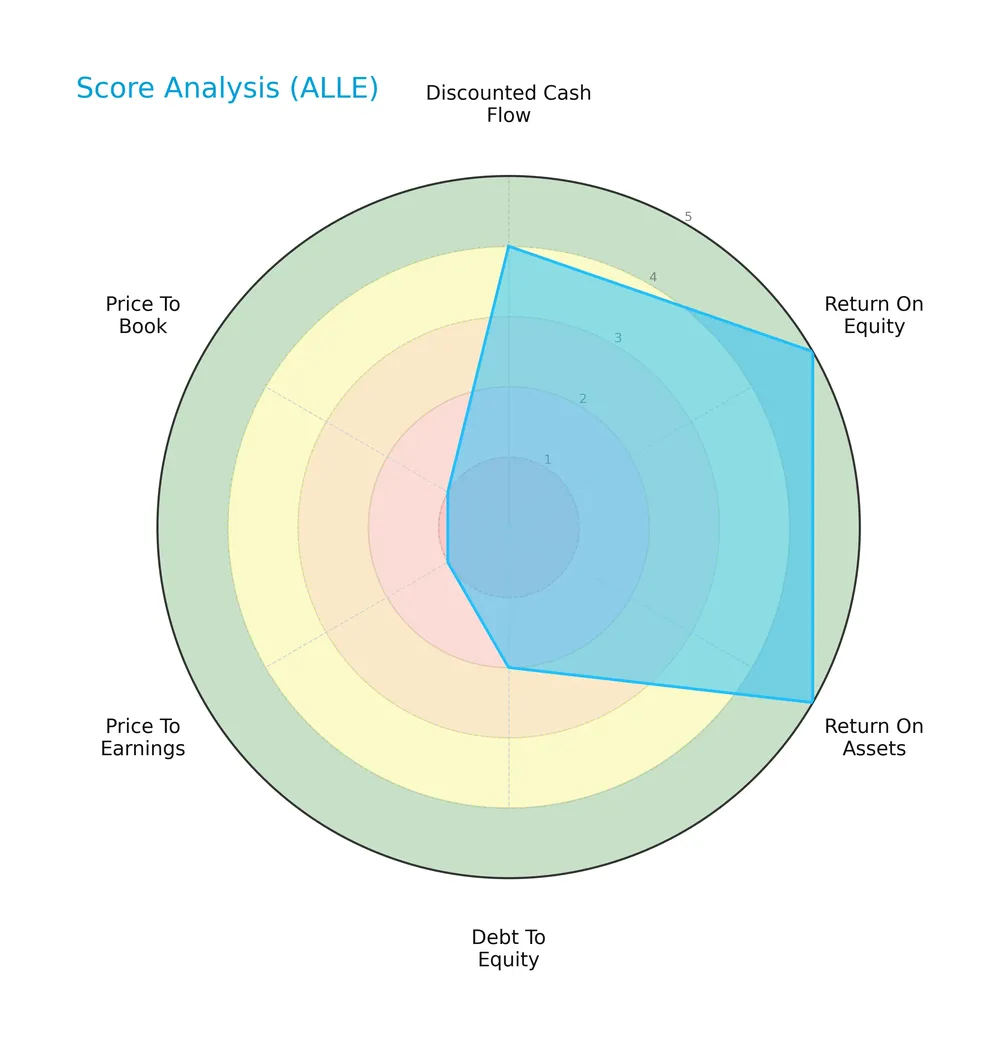
The company excels in return on equity and assets with very favorable scores of 5 each. Discounted cash flow is favorable at 4, but debt to equity is weak at 2. Price-to-earnings and price-to-book ratios are very unfavorable at 1 each, indicating valuation concerns.
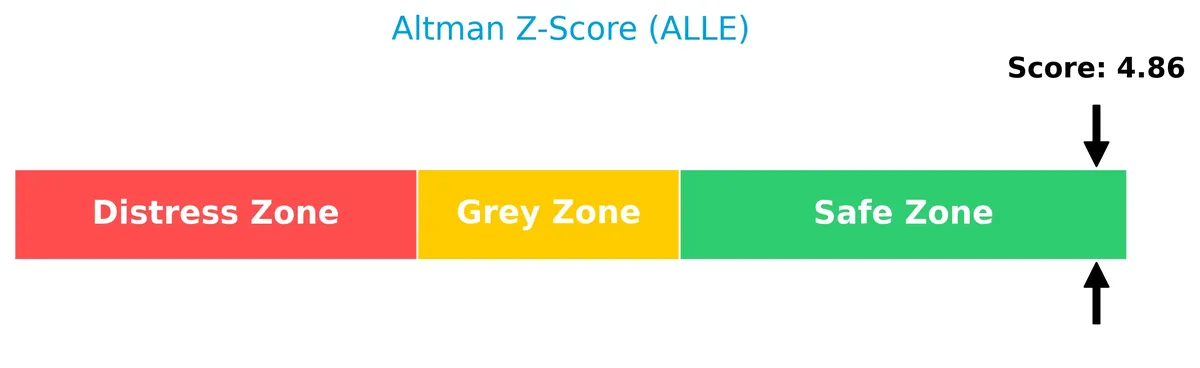
Analysis of the company’s bankruptcy risk
The Altman Z-Score indicates the company is in a safe zone, suggesting low bankruptcy risk and solid financial stability:
Is the company in good financial health?
The Piotroski Score diagram summarizes the company’s financial strength and efficiency metrics:

With a strong score of 7, the company demonstrates robust financial health, signaling sound profitability, liquidity, and operational efficiency.
Competitive Landscape & Sector Positioning
This section examines Allegion plc’s strategic positioning within the Security & Protection Services industry. I will analyze its revenue by segment, key products, and main competitors. The goal is to determine whether Allegion maintains a competitive advantage over its peers.
Strategic Positioning
Allegion plc focuses on mechanical and electronic security products, with over 3.7B in product revenue in 2025. Its geographic exposure is concentrated in the Americas, generating 3.0B, while international markets contribute about 1.0B, reflecting a primarily Americas-centric but globally present footprint.
Revenue by Segment
This pie chart displays Allegion plc’s revenue breakdown by segment for the fiscal year 2025, highlighting the contributions of Product and Non Mechanical Product Revenues.
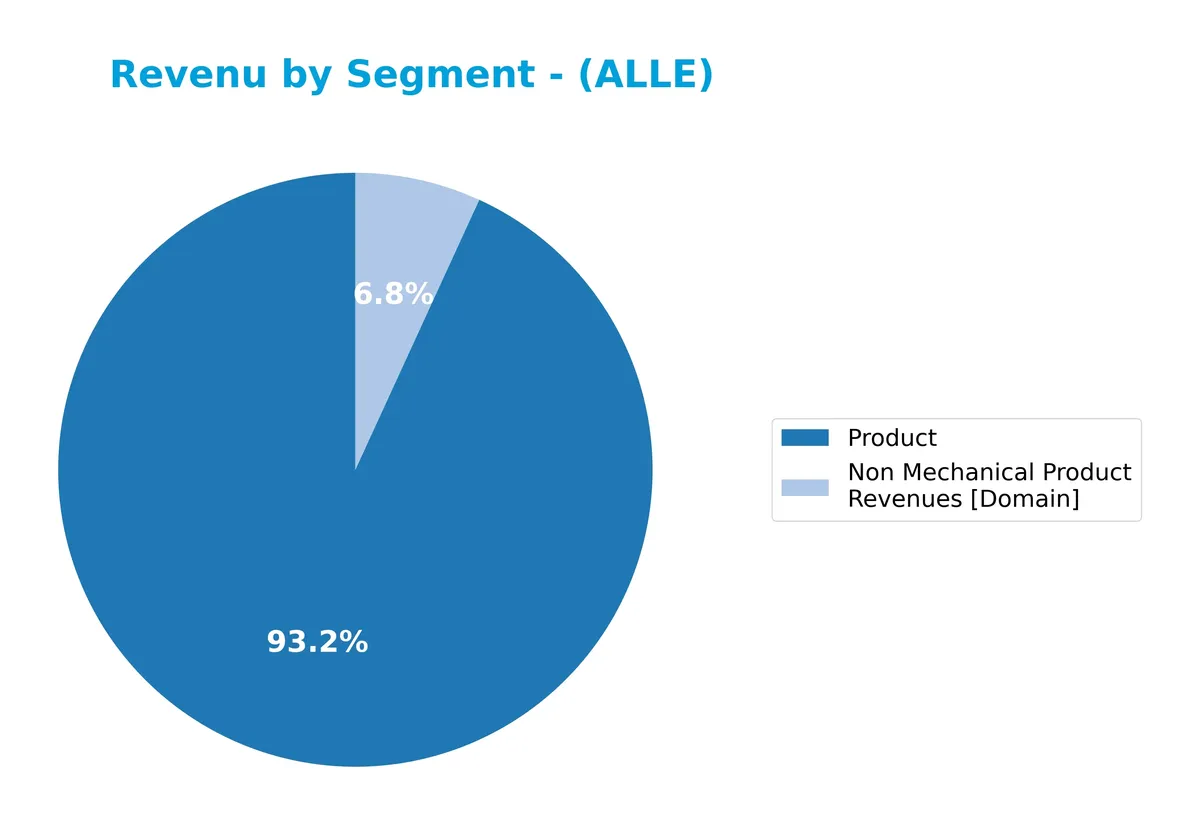
Allegion’s revenue is clearly dominated by its Product segment, generating $3.79B in 2025, up from $3.52B in 2024. The Non Mechanical Product segment, while smaller at $278M, shows steady growth from $254M the prior year. This trend indicates a concentration in core product sales, with a consistent but modest expansion in non-mechanical revenues, reflecting a balanced yet product-heavy portfolio.
Key Products & Brands
The table below outlines Allegion plc’s core product categories and their descriptions:
| Product | Description |
|---|---|
| Mechanical Security Products | Includes door closers, controls, exit devices, locks, locksets, portable locks, and key systems and services. |
| Electronic Security Products | Covers electronic security products, access control systems, and workforce productivity systems. |
| Doors and Door Systems | Consists of doors and related door system accessories. |
| Brands | Products marketed under CISA, Interflex, LCN, Schlage, SimonsVoss, and Von Duprin brands. |
Allegion’s portfolio spans mechanical and electronic security solutions, targeting commercial, institutional, and residential markets globally. These products support a range of facilities, from healthcare to hospitality.
Main Competitors
There are 89 competitors in the Industrials sector, with the table below showing the top 10 leaders by market capitalization:
| Competitor | Market Cap. |
|---|---|
| GE Aerospace | 338B |
| Caterpillar Inc. | 280B |
| RTX Corporation | 251B |
| The Boeing Company | 171B |
| Union Pacific Corporation | 138B |
| Eaton Corporation plc | 127B |
| Deere & Company | 126B |
| Honeywell International Inc. | 124B |
| Lockheed Martin Corporation | 116B |
| Parker-Hannifin Corporation | 114B |
Allegion plc ranks 68th among 89 competitors. Its market cap is 4.14% of the sector leader, GE Aerospace. Allegion is below both the average market cap of the top 10 (179B) and the sector median (36B). It maintains a narrow 0.76% gap to the next competitor above, indicating a tightly packed middle tier.
Comparisons with competitors
Check out how we compare the company to its competitors:
Aucun article trouvé pour ces critères.
Does ALLE have a competitive advantage?
Allegion plc demonstrates a competitive advantage by creating value, with its ROIC exceeding WACC by 8.1%, indicating efficient capital use despite a declining profitability trend. The company’s diverse brand portfolio and global distribution channels across commercial and residential markets support its market position.
Looking ahead, Allegion’s future growth may benefit from expanding international revenues and leveraging new electronic security and access control products. Continued innovation and market penetration in institutional and residential sectors offer potential opportunities amid evolving security demands.
SWOT Analysis
This SWOT analysis highlights Allegion plc’s key strategic factors shaping its competitive position and growth potential.
Strengths
- strong net margin at 15.83%
- high ROE of 25.87% signaling efficient capital use
- diversified global footprint with growing international sales
Weaknesses
- declining ROIC trend signals eroding profitability
- unfavorable gross and EBIT margin trends
- weak interest coverage ratio raises financial risk
Opportunities
- expanding demand for electronic security solutions
- growth potential in emerging markets
- leveraging digital sales channels for better market reach
Threats
- intense competition in security products sector
- raw material cost volatility impacting margins
- economic slowdown risks reducing capital expenditure
Allegion’s solid profitability and global presence underpin its value creation. However, declining operational efficiency and margin pressures require strategic focus on innovation and cost control. The company must capitalize on digital and international growth opportunities while managing competitive and economic risks.
Stock Price Action Analysis
The weekly stock chart for Allegion plc (ALLE) illustrates price movements and volume trends over the past 12 months:
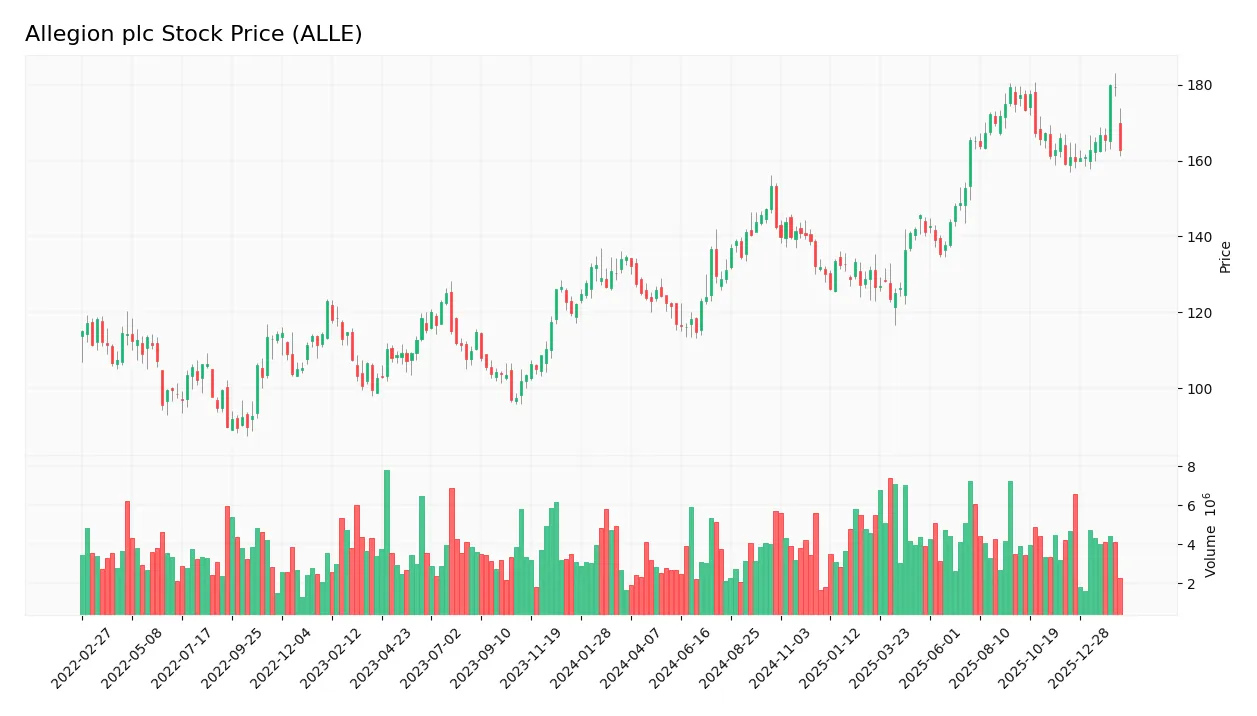
Trend Analysis
Over the past 12 months, ALLE’s stock price increased by 20.76%, indicating a bullish trend with acceleration. The price ranged from a low of 114.95 to a high of 179.77. The 18.02 standard deviation reflects notable volatility during this period.
Volume Analysis
Trading volume increased overall, with buyers accounting for 56.09% of total activity, signaling buyer-driven momentum. In the recent three months, buyer dominance slightly eased to 54.55%, suggesting continued but moderated investor interest and steady market participation.
Target Prices
Analysts set a confident target consensus for Allegion plc, reflecting steady optimism.
| Target Low | Target High | Consensus |
|---|---|---|
| 180 | 190 | 185 |
The target range from 180 to 190 suggests moderate upside potential. Analysts expect stable growth aligned with sector trends.

Don’t Let Luck Decide Your Entry Point
Optimize your entry points with our advanced ProRealTime indicators. You’ll get efficient buy signals with precise price targets for maximum performance. Start outperforming now!
Analyst & Consumer Opinions
This section reviews recent analyst grades and consumer feedback on Allegion plc, highlighting market sentiment and customer perspectives.
Stock Grades
Here are the latest verified stock grades for Allegion plc from reputable financial institutions:
| Grading Company | Action | New Grade | Date |
|---|---|---|---|
| Barclays | Maintain | Equal Weight | 2026-01-07 |
| Wells Fargo | Maintain | Equal Weight | 2025-12-16 |
| Barclays | Maintain | Equal Weight | 2025-10-24 |
| Baird | Maintain | Neutral | 2025-10-21 |
| Wells Fargo | Maintain | Equal Weight | 2025-10-06 |
| Barclays | Maintain | Equal Weight | 2025-10-01 |
| Goldman Sachs | Maintain | Buy | 2025-09-16 |
| Barclays | Upgrade | Equal Weight | 2025-08-14 |
| B of A Securities | Upgrade | Neutral | 2025-07-29 |
| Barclays | Maintain | Underweight | 2025-07-25 |
The consensus leans toward a Hold rating, reflecting a cautious but stable stance. Upgrades from Underweight to Equal Weight indicate improving sentiment, though Buy ratings remain limited.
Consumer Opinions
Allegion plc generates mixed consumer sentiment, reflecting its complex product portfolio and service execution.
| Positive Reviews | Negative Reviews |
|---|---|
| Products are highly durable and reliable. | Customer service response times are slow. |
| Installation guides are clear and user-friendly. | Some products face compatibility issues. |
| Strong security features appreciated by users. | Pricing is perceived as higher than competitors. |
Overall, consumers praise Allegion’s product durability and security but often criticize customer service delays and pricing. Addressing service responsiveness could strengthen brand loyalty.
Risk Analysis
Below is a summary of key risks facing Allegion plc, highlighting probability and potential impact:
| Category | Description | Probability | Impact |
|---|---|---|---|
| Market Volatility | Recent 9.4% price drop reflects exposure to cyclical industrial demand shifts | High | Medium |
| Interest Coverage | Zero interest coverage ratio signals vulnerability to rising debt costs | Medium | High |
| Debt Leverage | Debt-to-equity at 0.8 is moderate but creates financial flexibility limits | Medium | Medium |
| Dividend Yield | Absence of dividend yield may deter income-focused investors | Low | Low |
| Operational Risk | Asset turnover of 0.78 signals moderate efficiency, with room for improvement | Medium | Medium |
Allegion’s biggest risks stem from its weak interest coverage and recent share price volatility. The zero interest coverage ratio particularly alarms me; it suggests limited buffer to cover debt expenses if rates rise. Historically in Industrials, companies with such profiles face cost pressures quickly. Still, the firm’s strong Altman Z-score (4.86) and Piotroski score (7) indicate overall financial stability. I remain cautious but see manageable risks given the sector context.
Should You Buy Allegion plc?
Allegion plc appears to be a profitable company with robust value creation but a slightly declining operational efficiency. Its leverage profile suggests manageable debt despite some cautionary signals. Overall, the firm’s financial health could be seen as very favorable with a B+ rating.
Strength & Efficiency Pillars
Allegion plc demonstrates solid operational efficiency with a net margin of 15.83% and a return on equity (ROE) of 25.87%. Its return on invested capital (ROIC) stands at 16.12%, comfortably exceeding the weighted average cost of capital (WACC) of 8.02%, confirming the company as a clear value creator. These metrics reflect effective capital allocation and robust profitability. Despite some margin pressure, Allegion sustains healthy returns that outpace its capital costs, a positive signal in the industrial sector.
Weaknesses and Drawbacks
While financial health appears stable with an Altman Z-Score of 4.86 in the safe zone, valuation metrics are less encouraging. The company’s price-to-earnings (P/E) and price-to-book (P/B) scores are very unfavorable, suggesting the stock may be trading at a premium. Additionally, a debt-to-equity ratio of 0.8 indicates moderate leverage, which, combined with an unfavorable interest coverage ratio, poses some risk if earnings weaken. Investors should note these valuation and leverage concerns as potential headwinds.
Our Final Verdict about Allegion plc
Allegion plc’s fundamentals appear attractive for long-term exposure, underpinned by strong profitability and value creation. The bullish overall stock trend, paired with slightly buyer-dominant recent market behavior, supports a cautiously optimistic outlook. However, premium valuation metrics could temper near-term upside, suggesting investors might prefer a measured entry point. This profile could appeal to those seeking steady industrial exposure with moderate risk tolerance.
Disclaimer: This content is for informational purposes only and does not constitute financial, investment, or other professional advice. Investing in financial markets involves a significant risk of loss, and past performance is not indicative of future results.
Additional Resources
- Allegion plc Q4 2025 Earnings Call Summary – Yahoo Finance (Feb 17, 2026)
- Decoding Allegion PLC (ALLE): A Strategic SWOT Insight – GuruFocus (Feb 18, 2026)
- Allegion PLC stock underperforms Tuesday when compared to competitors – MarketWatch (Feb 17, 2026)
- Allegion PLC Earnings Call Highlights Growth And Headwinds – TipRanks (Feb 18, 2026)
- Why Allegion (ALLE) Stock Is Trading Lower Today – Finviz (Feb 17, 2026)
For more information about Allegion plc, please visit the official website: allegion.com