Home > Analyses > Healthcare > Align Technology, Inc.
Align Technology transforms smiles worldwide with its Invisalign clear aligners, revolutionizing orthodontics through innovation and precision. Its flagship products, including the iTero scanner, empower dental professionals with cutting-edge digital tools and services. Recognized for quality and market influence, Align shapes patient care and practitioner workflows alike. As we analyze its current fundamentals, the key question remains: does Align’s growth trajectory and valuation still reflect its industry leadership in 2026?
Table of contents
Business Model & Company Overview
Align Technology, Inc., founded in 1997 and based in Tempe, Arizona, leads the medical device industry with its innovative orthodontic solutions. The company’s ecosystem integrates Invisalign clear aligners and iTero intraoral scanners, serving orthodontists and dentists worldwide. This cohesive approach addresses a broad range of patient needs, from children to adults, combining treatment products with advanced scanning technology.
Align generates value through a balanced revenue engine, blending hardware sales with recurring software services and ancillary products. Its Clear Aligner segment captures diverse orthodontic markets, while Scanners and Services offer digital tools and manufacturing support. Operating across the Americas, Europe, and Asia, Align builds a robust economic moat through technological integration and global market penetration.
Financial Performance & Fundamental Metrics
I analyze Align Technology, Inc.’s income statement, key financial ratios, and dividend payout policy to assess its operational efficiency and shareholder value.
Income Statement
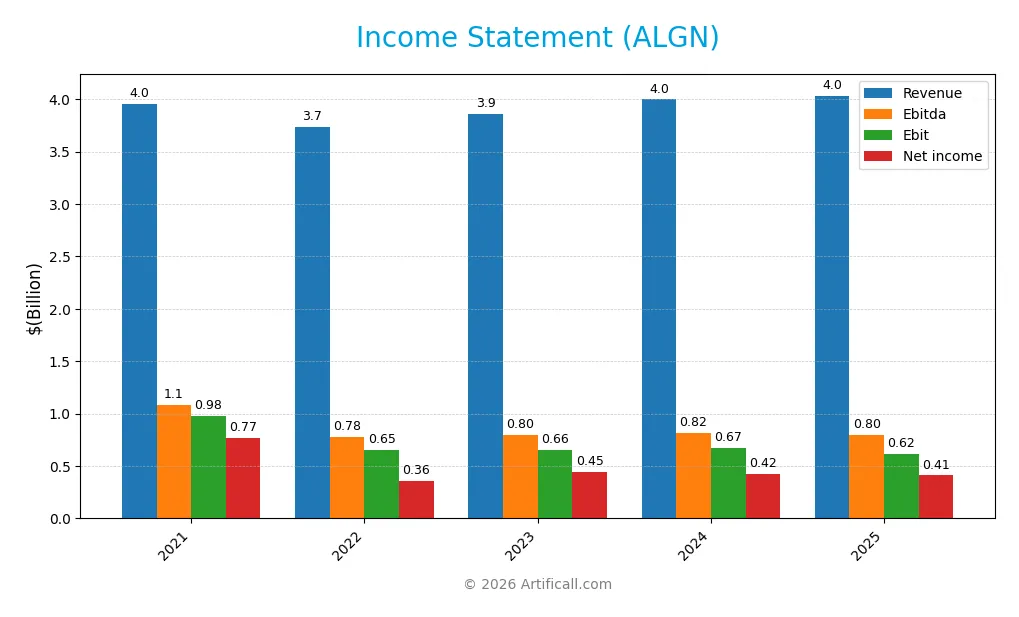
The table below presents Align Technology, Inc.’s key income statement metrics for the fiscal years 2021 through 2025, reported in USD.
| 2021 | 2022 | 2023 | 2024 | 2025 | |
|---|---|---|---|---|---|
| Revenue | 3.95B | 3.73B | 3.86B | 4.00B | 4.03B |
| Cost of Revenue | 1.02B | 1.10B | 1.16B | 1.20B | 1.28B |
| Operating Expenses | 1.96B | 1.99B | 2.06B | 2.19B | 2.14B |
| Gross Profit | 2.94B | 2.63B | 2.71B | 2.80B | 2.76B |
| EBITDA | 1.09B | 780M | 799M | 817M | 797M |
| EBIT | 976M | 654M | 657M | 672M | 616M |
| Interest Expense | 0 | 0 | 0 | 0 | 0 |
| Net Income | 772M | 362M | 445M | 421M | 410M |
| EPS | 9.78 | 4.62 | 5.82 | 5.63 | 5.66 |
| Filing Date | 2022-02-25 | 2023-02-27 | 2024-02-28 | 2025-02-28 | 2026-02-27 |
Income Statement Evolution
Align Technology’s revenue showed minimal growth of 0.9% from 2024 to 2025, with a marginal increase to 4.03B USD. Gross profit declined slightly by 1.51%, reflecting stable but pressured margins. Net income contracted by 3.48%, signaling margin compression despite a favorable gross margin near 68% and a net margin above 10%.
Is the Income Statement Favorable?
The 2025 income statement reveals a net margin of 10.17%, an EBIT margin of 15.27%, and zero interest expense, all positive fundamentals. However, the company experienced a decline in net income and EBIT compared to 2024. Given the revenue growth slowdown and falling profitability metrics over the period, the overall income statement profile remains unfavorable.
Financial Ratios
The table below presents key financial ratios for Align Technology, Inc. over the last five fiscal years, illustrating profitability, liquidity, valuation, leverage, and efficiency metrics:
| Ratios | 2021 | 2022 | 2023 | 2024 | 2025 |
|---|---|---|---|---|---|
| Net Margin | 19.5% | 9.7% | 11.5% | 10.5% | 10.2% |
| ROE | 21.3% | 10.0% | 12.3% | 10.9% | 10.1% |
| ROIC | 18.4% | 9.6% | 11.0% | 10.0% | 10.0% |
| P/E | 67.2 | 45.6 | 47.1 | 37.1 | 27.6 |
| P/B | 14.3 | 4.6 | 5.8 | 4.1 | 2.8 |
| Current Ratio | 1.30 | 1.26 | 1.18 | 1.22 | 1.36 |
| Quick Ratio | 1.18 | 1.08 | 1.04 | 1.10 | 1.24 |
| D/E | 0.035 | 0.035 | 0.035 | 0.031 | 0.020 |
| Debt-to-Assets | 2.1% | 2.1% | 2.1% | 1.9% | 1.3% |
| Interest Coverage | 0 | 0 | 0 | 0 | 0 |
| Asset Turnover | 0.67 | 0.63 | 0.63 | 0.64 | 0.65 |
| Fixed Asset Turnover | 3.29 | 2.76 | 2.74 | 2.89 | 3.25 |
| Dividend Yield | 0% | 0% | 0% | 0% | 0% |
Evolution of Financial Ratios
Return on Equity (ROE) for Align Technology, Inc. showed a decline from 21.3% in 2021 to 10.1% in 2025, indicating reduced profitability. The Current Ratio improved modestly from 1.18 in 2023 to 1.36 in 2025, signaling better short-term liquidity. Debt-to-Equity Ratio steadily decreased to 0.02 in 2025, reflecting a lower leverage profile and improved financial stability.
Are the Financial Ratios Fovorable?
In 2025, Align Technology’s profitability is mixed: net margin is favorable at 10.17%, but ROIC at 10.02% trails its WACC of 12.09%, an unfavorable sign. Liquidity ratios are generally positive, with a quick ratio of 1.24 rated favorable and current ratio neutral at 1.36. Low debt ratios and strong interest coverage support financial health. Valuation multiples like P/E at 27.6 are unfavorable, while P/B ratio is neutral. Overall, ratios present a slightly favorable financial profile.
Shareholder Return Policy
Align Technology, Inc. does not pay dividends, reflecting a reinvestment strategy typical for growth-oriented firms. The company maintains no dividend payout ratio or yield, indicating a focus on deploying capital into operations rather than distributing cash.
Share buyback programs are not disclosed, suggesting limited capital return through repurchases. This approach aligns with sustaining long-term shareholder value by prioritizing growth and R&D over immediate cash returns.
Score analysis
The following radar chart presents a comprehensive view of Align Technology’s key financial scores:
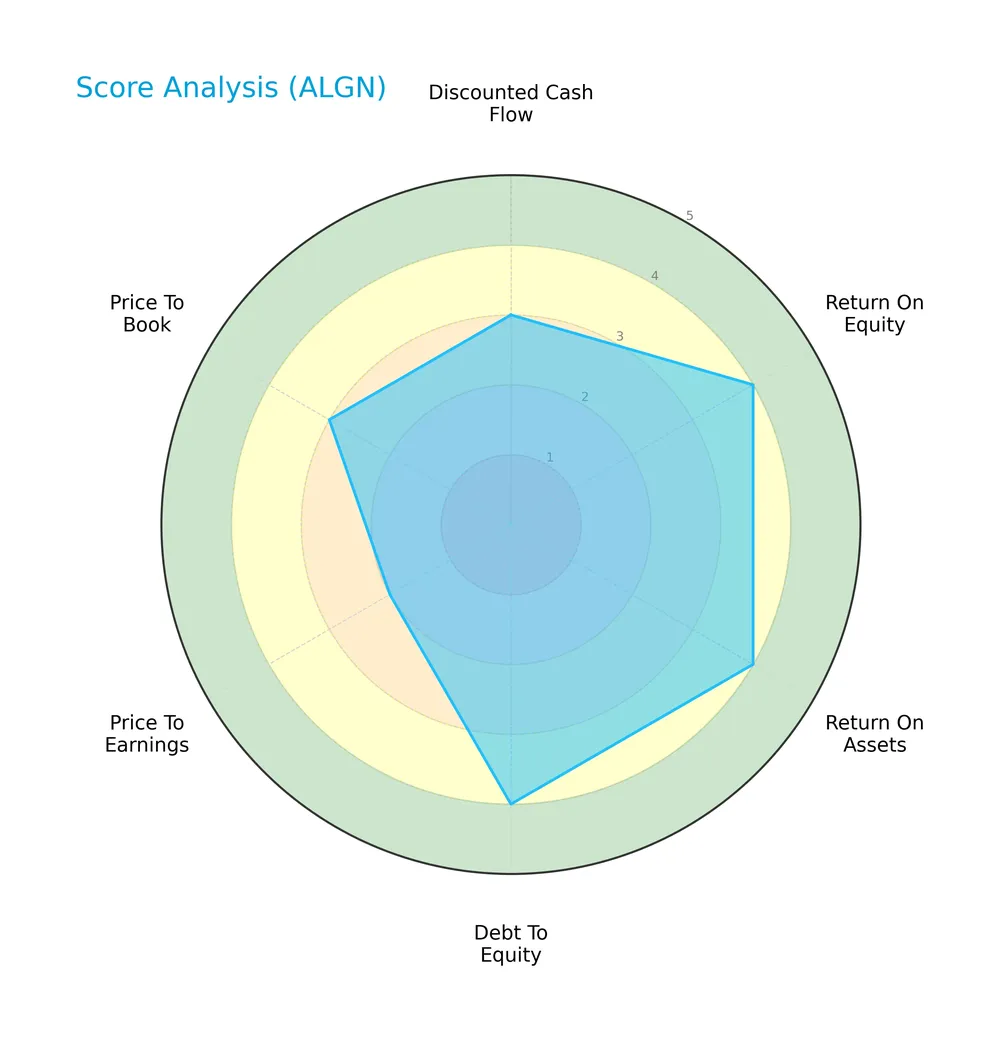
Align Technology shows strong returns on equity and assets, and maintains favorable debt levels. However, its price-to-earnings score is unfavorable, indicating valuation concerns amid moderate discounted cash flow and price-to-book scores.
Analysis of the company’s bankruptcy risk
Align Technology’s Altman Z-Score places it clearly in the safe zone, signaling low bankruptcy risk and solid financial stability:

Is the company in good financial health?
This Piotroski diagram highlights Align Technology’s financial strength based on nine critical criteria:

With a Piotroski Score of 7, Align Technology demonstrates strong financial health, reflecting solid profitability, liquidity, and operational efficiency.
Competitive Landscape & Sector Positioning
This analysis explores Align Technology’s strategic positioning within the medical devices sector, focusing on its product and revenue segments. I will assess whether Align Technology holds a competitive advantage over its main competitors in this evolving industry.
Strategic Positioning
Align Technology focuses on a concentrated product portfolio with two main segments: Clear Aligners and Scanners & Services. Its geographic exposure spans the U.S., Switzerland, China, and other international markets, reflecting strategic international diversification in medical devices.
Revenue by Segment
This pie chart illustrates Align Technology’s revenue breakdown by segment for the fiscal year 2025, highlighting the contribution of Clear Aligner and Scanners and Services.
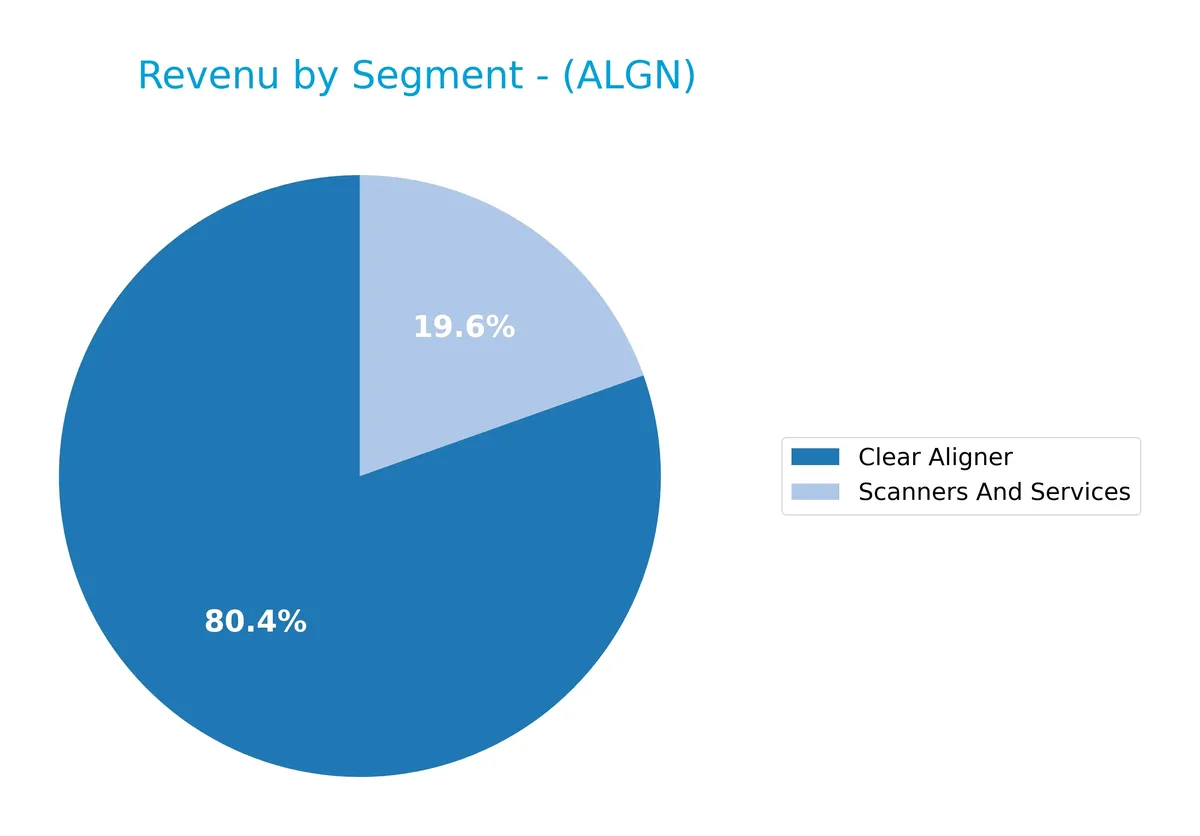
Clear Aligner dominates with $3.25B, reflecting steady growth since 2020, underscoring its role as the company’s core driver. Scanners and Services contribute $790M, showing gradual expansion and diversification. The 2025 figures reveal a mature but resilient Clear Aligner segment, while Scanners and Services display consistent incremental gains, indicating balanced revenue streams and reduced concentration risk.
Key Products & Brands
Below is an overview of Align Technology’s main products and brands by segment:
| Product | Description |
|---|---|
| Invisalign Clear Aligners | Comprehensive orthodontic treatment products for teenage and younger patients, including various packages and retention products. |
| iTero Scanners and Services | Hardware and software platform for restorative and orthodontic procedures, digital records, CAD/CAM services, and ancillary products. |
Align Technology specializes in Invisalign clear aligners addressing diverse age groups and orthodontic needs. Its iTero segment supports dental professionals with scanners, software, and digital services, contributing significantly to revenue.
Main Competitors
The healthcare sector includes 10 main competitors; the table lists the top 10 leaders by market capitalization:
| Competitor | Market Cap. |
|---|---|
| Abbott Laboratories | 216B |
| Boston Scientific Corporation | 140B |
| Stryker Corporation | 133B |
| Medtronic plc | 123B |
| Edwards Lifesciences Corporation | 50B |
| DexCom, Inc. | 26B |
| STERIS plc | 25B |
| Insulet Corporation | 20B |
| Zimmer Biomet Holdings, Inc. | 18B |
| Align Technology, Inc. | 11B |
Align Technology ranks 10th among the top healthcare device companies. Its market cap is only 6.3% of Abbott Laboratories, the sector leader. The company sits below both the 76B average market cap of the top 10 and the 38B median for the sector. Align maintains a 30.8% gap below its closest competitor, Zimmer Biomet.
Comparisons with competitors
Check out how we compare the company to its competitors:
Does ALGN have a competitive advantage?
Align Technology does not currently present a competitive advantage. Its ROIC is below WACC by 2.07%, indicating value destruction and declining profitability over 2021-2025.
Future outlook includes expansion of Invisalign products for various age groups and growth in international markets. Innovations like iTero scanners and digital orthodontic services offer new revenue opportunities.
SWOT Analysis
This analysis identifies key internal and external factors shaping Align Technology’s competitive position and future prospects.
Strengths
- strong brand with Invisalign leadership
- high gross margin at 68%
- low debt and strong liquidity
Weaknesses
- declining ROIC below WACC
- slowing revenue growth at 0.9%
- high valuation with PE of 27.6
Opportunities
- expanding international markets
- growing demand for digital orthodontics
- innovation in scanner and software tech
Threats
- intense competition in medical devices
- regulatory risks in healthcare
- tech obsolescence and pricing pressure
Align’s strengths support its premium market position but deteriorating profitability signals caution. Its global expansion and tech innovation offer growth, yet competitive and regulatory threats demand disciplined execution.
Stock Price Action Analysis
The weekly stock chart of Align Technology, Inc. (ALGN) highlights price movements and volatility trends over the past 12 months:
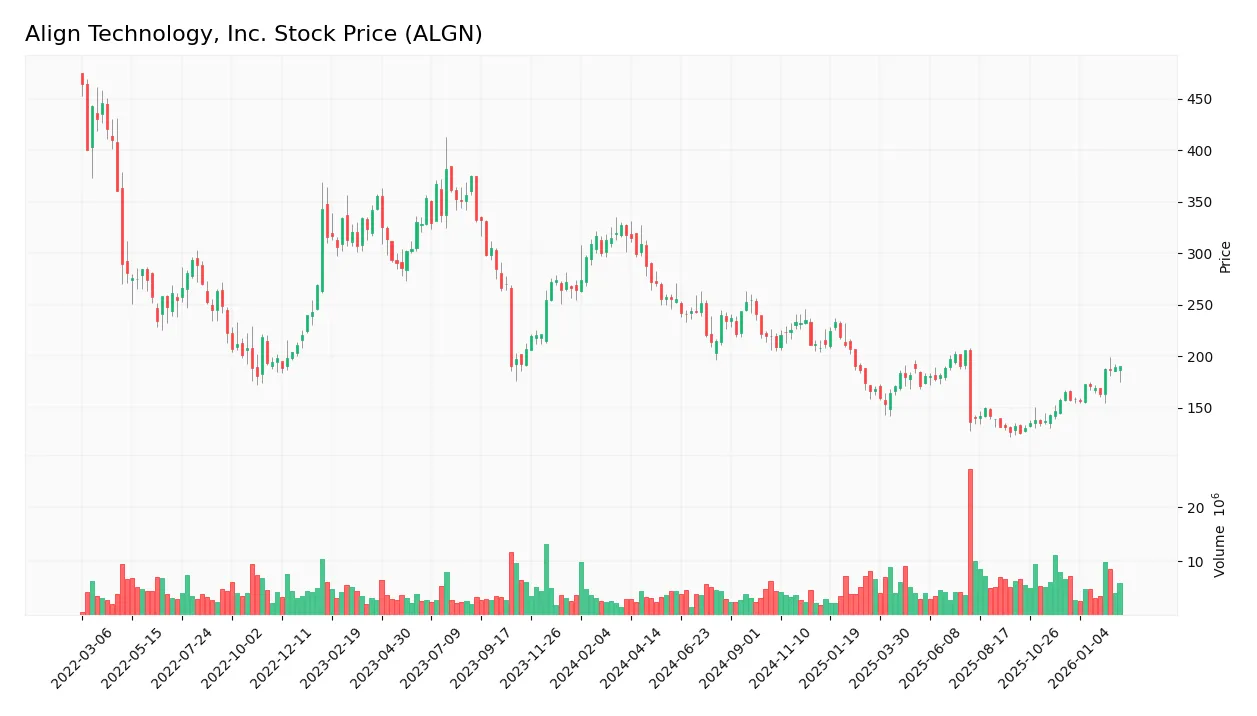
Trend Analysis
Over the past 12 months, ALGN’s stock declined by 40.14%, signaling a clear bearish trend with accelerating downside momentum. The price range spanned from a high of 317.58 to a low of 125.79, reflecting significant volatility with a standard deviation of 45.98.
Volume Analysis
In the last three months, trading volume has increased, driven slightly by buyers, who represent 53.31% of activity. This buyer dominance suggests moderate positive sentiment amid rising market participation, supporting the recent price recovery trend.
Target Prices
Analysts set a clear target consensus for Align Technology, Inc., reflecting measured optimism.
| Target Low | Target High | Consensus |
|---|---|---|
| 140 | 220 | 197.3 |
The target prices indicate expectations of substantial upside potential, with a consensus near 197, signaling confidence in the company’s growth trajectory.

Don’t Let Luck Decide Your Entry Point
Optimize your entry points with our advanced ProRealTime indicators. You’ll get efficient buy signals with precise price targets for maximum performance. Start outperforming now!
Analyst & Consumer Opinions
This section examines Align Technology, Inc.’s analyst ratings and consumer feedback to provide balanced market insights.
Stock Grades
Here are the latest verified analyst grades for Align Technology, Inc., reflecting diverse market views and recent changes:
| Grading Company | Action | New Grade | Date |
|---|---|---|---|
| Barclays | Maintain | Equal Weight | 2026-02-26 |
| HSBC | Upgrade | Buy | 2026-02-09 |
| Wells Fargo | Maintain | Overweight | 2026-02-05 |
| UBS | Maintain | Neutral | 2026-02-05 |
| Stifel | Maintain | Buy | 2026-02-05 |
| Evercore ISI Group | Maintain | Outperform | 2026-02-05 |
| Piper Sandler | Maintain | Overweight | 2026-02-05 |
| Morgan Stanley | Maintain | Equal Weight | 2026-02-05 |
| Mizuho | Maintain | Outperform | 2026-01-20 |
| Morgan Stanley | Maintain | Equal Weight | 2025-10-30 |
The consensus leans bullish, with a majority rating Align as Buy or better, despite several Equal Weight and Neutral calls. HSBC’s recent upgrade marks the only significant rating shift.
Consumer Opinions
Consumers express a mix of enthusiasm and caution about Align Technology, Inc., reflecting its innovation and service challenges.
| Positive Reviews | Negative Reviews |
|---|---|
| “Impressive smile transformation with Invisalign.” | “Long wait times for customer support.” |
| “User-friendly app and clear treatment plans.” | “High cost compared to traditional braces.” |
| “Professional and knowledgeable staff.” | “Occasional delays in shipment of aligners.” |
Overall, users praise Align Technology’s innovative orthodontic solutions and professional service. However, recurring issues include customer support delays and pricing concerns, highlighting areas needing improvement.
Risk Analysis
Below is a detailed table outlining key risks Align Technology faces in 2026:
| Category | Description | Probability | Impact |
|---|---|---|---|
| Market Volatility | High beta (1.83) implies stock price swings above the Nasdaq average, increasing investor risk. | High | Medium |
| Valuation Risk | Elevated P/E of 27.6 suggests the stock trades at a premium, risking correction if growth stalls. | Medium | High |
| Profitability Gap | ROIC (10.0%) below WACC (12.1%) indicates the company struggles to generate returns above capital cost. | Medium | High |
| Product Innovation | Dependence on Invisalign and iTero scanners requires continuous innovation to maintain moat. | Medium | High |
| Liquidity Concern | Current ratio of 1.36 is acceptable but below industry leaders, limiting short-term flexibility. | Low | Medium |
| Competitive Pressure | Rising competition in medical devices and orthodontics markets could erode market share. | Medium | High |
| No Dividend Yield | Zero dividend might deter income-focused investors, impacting stock demand during downturns. | Low | Low |
The most critical risks are valuation and profitability. Align’s ROIC failing to cover its WACC signals capital inefficiency. This structural weakness, combined with a lofty P/E multiple, raises red flags about growth sustainability. High beta also means investors should brace for volatility. However, strong Altman Z-score (4.82) and a Piotroski score of 7 reflect solid financial health, buffering bankruptcy risk. Prudence dictates monitoring innovation and market dynamics closely.
Should You Buy Align Technology, Inc.?
Align Technology appears to be a company with improving profitability but a deteriorating competitive moat, reflecting declining value creation. Despite a manageable leverage profile and strong financial health indicators, the overall rating of A- suggests a cautiously favorable investment case.
Strength & Efficiency Pillars
Align Technology, Inc. operates in a stable financial zone with an Altman Z-Score of 4.82, indicating strong solvency. The company posts a favorable net margin of 10.17%, underpinned by an EBIT margin of 15.27%, signaling operational efficiency. ROE at 10.13% remains neutral, reflecting moderate shareholder returns. However, the ROIC of 10.02% falls below the WACC of 12.09%, showing the company is currently destroying value rather than creating it, a critical long-term concern despite profitability.
Weaknesses and Drawbacks
Despite financial safety, Align’s valuation appears stretched, with a high P/E ratio of 27.6, suggesting premium pricing with limited margin for multiple expansion. The price-to-book ratio of 2.8 is moderate but not compelling for value investors. The current ratio stands at 1.36, neutral but not a strong liquidity buffer. Market pressure is modestly alleviated by a buyer dominance of 53.31%, yet recent revenue and profit growth trends are unfavorable, with net income declining nearly 47% over the period, highlighting operational headwinds.
Our Final Verdict about Align Technology, Inc.
Align Technology’s fundamental profile is mixed. The company maintains strong solvency and operational margins but struggles with value destruction and weakening profitability trends. Despite a recent slight buyer dominance and improving short-term price momentum, the bearish overall trend and elevated valuation suggest caution. This profile might appear attractive to investors seeking exposure in dental tech but warrants a wait-and-see stance for better entry points amid ongoing challenges.
Disclaimer: This content is for informational purposes only and does not constitute financial, investment, or other professional advice. Investing in financial markets involves a significant risk of loss, and past performance is not indicative of future results.
Additional Resources
- Decoding Align Technology Inc (ALGN): A Strategic SWOT Insight – GuruFocus (Feb 28, 2026)
- [10-K] ALIGN TECHNOLOGY INC Files Annual Report | ALGN SEC Filing – Form 10-K – Stock Titan (Feb 27, 2026)
- Is Align Technology (ALGN) Stock Outpacing Its Medical Peers This Year? – Yahoo Finance (Feb 23, 2026)
- Citigroup Inc. Boosts Position in Align Technology, Inc. $ALGN – MarketBeat (Feb 25, 2026)
- Align Tech Updates Bylaws to Enable Shareholder Meetings – TipRanks (Feb 26, 2026)
For more information about Align Technology, Inc., please visit the official website: aligntech.com