Home > Analyses > Real Estate > Alexandria Real Estate Equities, Inc.
Alexandria Real Estate Equities, Inc. transforms urban landscapes by creating vibrant campuses that fuel innovation in life sciences, technology, and agtech. As a pioneer and industry leader in REIT office spaces, Alexandria’s portfolio spans major innovation hubs like Boston and San Francisco, boasting a reputation for premium Class A properties and collaborative environments. With a unique blend of real estate and strategic venture capital, the question remains: does Alexandria’s current valuation fully reflect its growth potential and resilience in a dynamic market?

Table of contents
Business Model & Company Overview
Alexandria Real Estate Equities, Inc., founded in 1994 and headquartered in Pasadena, CA, stands as a pioneering leader in the urban office REIT sector. The company specializes in developing and managing collaborative life science, technology, and agtech campuses within AAA innovation clusters. Its ecosystem spans 49.7M SF of North American assets, including Class A properties and ongoing development projects, positioning Alexandria as a core partner for innovative tenants seeking dynamic, talent-attracting environments.
The company’s revenue engine blends stable rental income from long-term leases with strategic capital investments in transformative firms via its venture capital platform. Alexandria’s footprint covers major innovation hubs across the Americas, including Boston, San Francisco, and New York City. This competitive advantage in prime urban clusters underpins high occupancy and rental growth, securing a durable economic moat that shapes the future of specialized real estate investment.
Financial Performance & Fundamental Metrics
In this section, I analyze Alexandria Real Estate Equities, Inc.’s income statement, key financial ratios, and dividend payout policy to assess its investment potential.
Income Statement
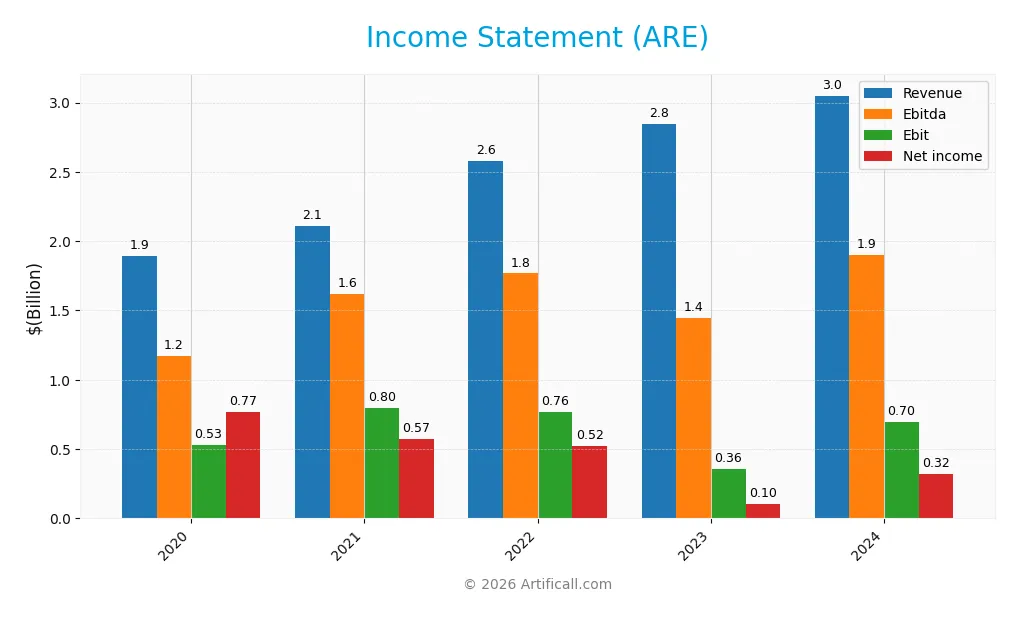
Below is the Income Statement for Alexandria Real Estate Equities, Inc. (ARE) over the past five fiscal years, showing key financial performance metrics in USD.
| 2020 | 2021 | 2022 | 2023 | 2024 | |
|---|---|---|---|---|---|
| Revenue | 1.89B | 2.11B | 2.58B | 2.84B | 3.05B |
| Cost of Revenue | 530M | 624M | 783M | 859M | 909M |
| Operating Expenses | 133M | 973M | 1.18B | 1.29B | 1.37B |
| Gross Profit | 1.36B | 1.48B | 1.79B | 1.98B | 2.14B |
| EBITDA | 1.17B | 1.62B | 1.77B | 1.45B | 1.90B |
| EBIT | 532M | 796M | 765M | 355M | 697M |
| Interest Expense | 172M | 142M | 94M | 74M | 186M |
| Net Income | 771M | 571M | 522M | 104M | 323M |
| EPS | 4.69 | 2.84 | 3.18 | 0.54 | 1.80 |
| Filing Date | 2021-02-01 | 2022-01-31 | 2023-01-30 | 2024-01-29 | 2025-01-27 |
Income Statement Evolution
Between 2020 and 2024, Alexandria Real Estate Equities, Inc. showed a steady revenue increase of 61.04%, indicating solid top-line growth. However, net income declined by 58.11% over the same period, reflecting challenges in translating revenue growth into bottom-line gains. Gross and EBIT margins remained favorable at 70.19% and 22.84%, respectively, suggesting relatively stable profitability despite margin pressure on net income.
Is the Income Statement Favorable?
In 2024, the company reported 3.05B in revenue, up 7.29% year-over-year, with net income at 323M, more than tripling compared to 2023. Margins improved significantly, with net margin rising to 10.59%, supported by a strong 96.11% growth in EBIT and a 233.33% increase in EPS. Interest expense remained neutral at 6.09% of revenue. Overall, the income statement fundamentals for 2024 appear favorable.
Financial Ratios
The table below presents key financial ratios for Alexandria Real Estate Equities, Inc. over the fiscal years 2020 to 2024, illustrating profitability, valuation, liquidity, leverage, efficiency, and dividend metrics:
| Ratios | 2020 | 2021 | 2022 | 2023 | 2024 |
|---|---|---|---|---|---|
| Net Margin | 41% | 27% | 20% | 4% | 11% |
| ROE | 6.6% | 3.5% | 2.7% | 0.6% | 1.8% |
| ROIC | 5.6% | 1.8% | 1.8% | 2.0% | 2.2% |
| P/E | 29 | 57 | 45 | 209 | 52 |
| P/B | 1.9 | 2.0 | 1.2 | 1.2 | 0.9 |
| Current Ratio | 0.64 | 0.41 | 0.58 | 0.39 | 0.40 |
| Quick Ratio | 0.64 | 0.41 | 0.58 | 0.39 | 0.40 |
| D/E | 0.67 | 0.57 | 0.56 | 0.63 | 0.71 |
| Debt-to-Assets | 35% | 31% | 30% | 32% | 34% |
| Interest Coverage | 7.2 | 3.6 | 6.5 | 9.3 | 4.1 |
| Asset Turnover | 0.08 | 0.07 | 0.07 | 0.08 | 0.08 |
| Fixed Asset Turnover | 1.9 | 1.7 | 1.9 | 2.5 | 2.4 |
| Dividend Yield | 2.4% | 2.0% | 3.2% | 3.9% | 5.4% |
Evolution of Financial Ratios
Over the period, Alexandria Real Estate Equities, Inc. experienced a decline in Return on Equity (ROE) from 6.57% in 2020 to 1.81% in 2024, indicating reduced profitability. The Current Ratio decreased from 0.64 to 0.40, reflecting a weakening liquidity position. The Debt-to-Equity Ratio showed a moderate increase, stabilizing around 0.71 by 2024, indicating consistent leverage. Profitability margins, particularly net profit margin, showed volatility but ended at 10.59% in 2024.
Are the Financial Ratios Favorable?
For 2024, profitability displays mixed signals: net margin is favorable at 10.59%, but ROE and return on invested capital are unfavorable, suggesting low returns on equity and capital. Liquidity ratios, with a current and quick ratio of 0.4, are unfavorable, signaling potential short-term financial constraints. Leverage metrics such as debt-to-equity and debt-to-assets are neutral, while asset turnover is unfavorable, indicating inefficiency in asset utilization. Market valuation ratios show a high price-to-earnings ratio (unfavorable) but a favorable price-to-book ratio. Overall, the financial ratios are slightly unfavorable.
Shareholder Return Policy
Alexandria Real Estate Equities, Inc. maintains a consistent dividend policy with a payout ratio fluctuating around 1.45 to 8.18 over recent years and a 2024 dividend yield of approximately 5.35%. Dividend payments are fully covered by free cash flow, supporting sustainability, while share buyback programs are not explicitly indicated.
The relatively stable dividend per share growth and solid free cash flow coverage suggest a balanced approach to shareholder returns. However, the elevated payout ratio in 2024 may warrant monitoring to ensure distributions remain sustainable, aligning with long-term value creation for shareholders.
Score analysis
The following radar chart illustrates the company’s performance across key financial metrics:
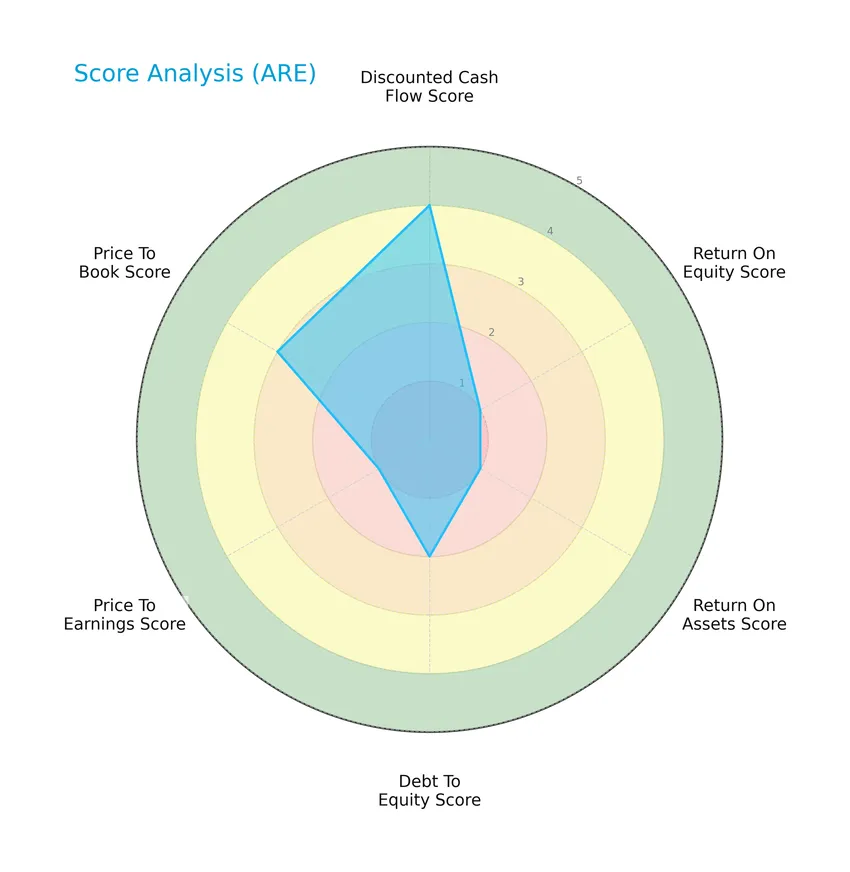
Alexandria Real Estate Equities, Inc. shows a favorable discounted cash flow score of 4 but struggles with very unfavorable returns on equity and assets at 1 each. Debt-to-equity and price-to-book ratios are moderate, while the price-to-earnings score remains very unfavorable.
Analysis of the company’s bankruptcy risk
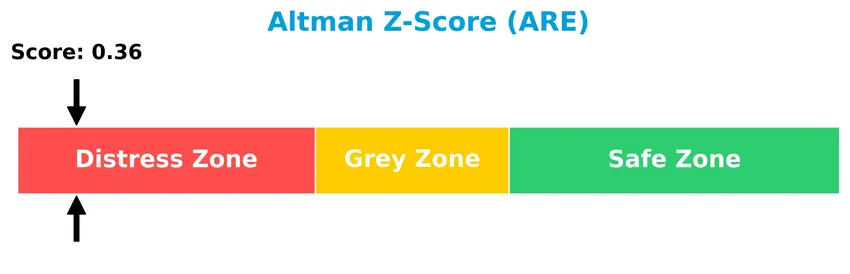
The Altman Z-Score places the company deep in the distress zone, indicating a high risk of financial distress and potential bankruptcy:
Is the company in good financial health?
The Piotroski Score diagram provides insight into the company’s financial strength and stability:

With a Piotroski Score of 4, the company falls into the average category, suggesting moderate financial health but not strong enough to be considered a robust value investment at this time.
Competitive Landscape & Sector Positioning
This sector analysis will explore Alexandria Real Estate Equities, Inc.’s strategic positioning, revenue segments, key products, main competitors, and competitive advantages. I will evaluate whether the company holds a competitive edge over its industry peers.
Strategic Positioning
Alexandria Real Estate Equities, Inc. concentrates on urban office REIT properties within North America, specifically in key innovation clusters such as Boston, San Francisco, and New York City. Its product portfolio is focused primarily on rental revenues from life science, technology, and agtech campuses, with rental income exceeding $3B in 2024.
Revenue by Segment
This pie chart presents Alexandria Real Estate Equities, Inc.’s revenue breakdown by segment for the fiscal year 2024, highlighting the company’s main sources of income.
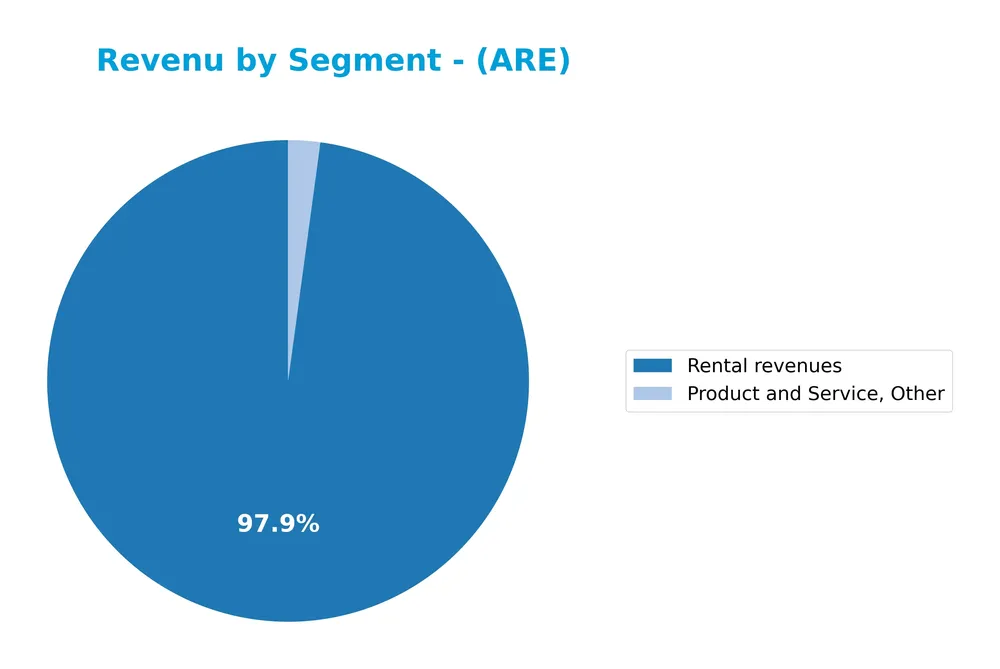
Rental revenues dominate Alexandria’s revenue streams at 3.05B in 2024, showing steady growth from 1.01B in 2018. The “Product and Service, Other” segment remains marginal, contributing just 67M in 2024. The business remains heavily reliant on rental income, which has consistently increased year-over-year, indicating growth concentration and a potential risk if market conditions shift in the real estate sector.
Key Products & Brands
The table below presents Alexandria Real Estate Equities, Inc.’s main revenue-generating products and services:
| Product | Description |
|---|---|
| Rental Revenues | Income generated from leasing Class A life science, technology, and agtech office properties across key U.S. innovation clusters. |
| Product and Service, Other | Additional revenue streams beyond rental income, including strategic capital provision to transformative tenants. |
Alexandria Real Estate Equities primarily derives its revenue from rental income on specialized urban office properties focused on life science and technology sectors, supplemented by other service-related revenues.
Main Competitors
There are 3 competitors in total, with the table listing the top 3 leaders by market capitalization:
| Competitor | Market Cap. |
|---|---|
| Digital Realty Trust, Inc. | 53.3B |
| BXP, Inc. | 10.7B |
| Alexandria Real Estate Equities, Inc. | 8.5B |
Alexandria Real Estate Equities, Inc. ranks 3rd among its competitors with a market cap representing 19.37% of the leader, Digital Realty Trust, Inc. The company is positioned below both the average market cap of the top 10 competitors (24.2B) and the median market cap in the sector (10.7B). It is 4.18% smaller than its closest competitor, BXP, Inc.
Comparisons with competitors
Check out how we compare the company to its competitors:
Does ARE have a competitive advantage?
Alexandria Real Estate Equities, Inc. does not present a competitive advantage based on its declining return on invested capital (ROIC) relative to its weighted average cost of capital (WACC), indicating value destruction. The company’s ROIC trend over 2020-2024 is strongly negative, reflecting decreasing profitability and an unfavorable economic moat status.
Looking ahead, Alexandria’s focus on Class A properties in urban life science, technology, and agtech campuses across major innovation clusters offers potential growth opportunities. Its venture capital platform providing strategic capital to transformative companies may support future development and a diversified tenant base in evolving markets.
SWOT Analysis
This SWOT analysis highlights the key strategic factors impacting Alexandria Real Estate Equities, Inc. (ARE) to guide informed investment decisions.
Strengths
- Leader in life science and tech urban office REIT niche
- Strong tenant base with long leases
- High gross margin and improving net margin
Weaknesses
- Low ROE and ROIC indicating value destruction
- High PE ratio signaling overvaluation
- Weak liquidity ratios (current and quick)
Opportunities
- Expansion in innovation clusters across major US cities
- Growing demand for collaborative life science campuses
- Venture capital platform supporting tenant growth
Threats
- Market volatility affecting REIT valuations
- Rising interest rates increasing borrowing costs
- Intense competition in urban office markets
Overall, Alexandria’s strengths in a specialized sector and its strong income metrics support growth potential. However, profitability issues and liquidity concerns require cautious risk management. Strategic focus should balance expansion with financial discipline to enhance long-term value.
Stock Price Action Analysis
The weekly stock chart of Alexandria Real Estate Equities, Inc. (ARE) displays price movements and key levels over the last 12 months:
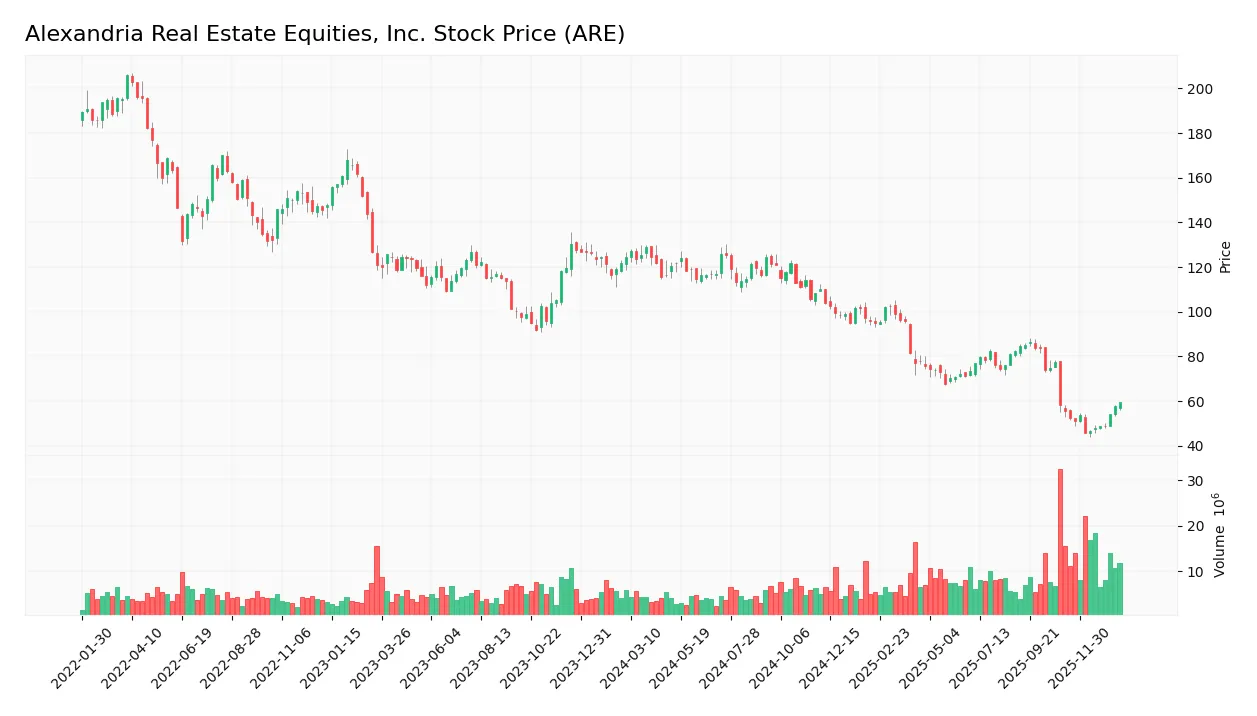
Trend Analysis
Over the past year, ARE’s stock price declined by 51.97%, indicating a clear bearish trend with acceleration. The price ranged from a high of 128.91 to a low of 45.48, reflecting significant volatility as confirmed by a 24.08 standard deviation. Recent weeks show a 7.34% rebound, signaling a short-term recovery.
Volume Analysis
In the last three months, trading volume for ARE has been increasing, with buyer volume representing 59.94%, indicating a slightly buyer-dominant market. This suggests growing investor interest and participation, potentially reflecting cautious optimism amid the broader bearish context.
Target Prices
The consensus target prices for Alexandria Real Estate Equities, Inc. (ARE) reflect moderate upside potential balanced by some downside risk.
| Target High | Target Low | Consensus |
|---|---|---|
| 82 | 45 | 58.25 |
Analysts expect the stock to trade within a range from $45 to $82, with a consensus price near $58. This suggests cautious optimism about future performance.

Don’t Let Luck Decide Your Entry Point
Optimize your entry points with our advanced ProRealTime indicators. You’ll get efficient buy signals with precise price targets for maximum performance. Start outperforming now!
Analyst & Consumer Opinions
This section examines analyst ratings and consumer feedback related to Alexandria Real Estate Equities, Inc. (ARE) performance.
Stock Grades
The latest grades for Alexandria Real Estate Equities, Inc. from leading financial institutions are summarized in the following table:
| Grading Company | Action | New Grade | Date |
|---|---|---|---|
| JP Morgan | Maintain | Neutral | 2026-01-14 |
| Jefferies | Maintain | Hold | 2025-12-16 |
| Citigroup | Maintain | Neutral | 2025-12-04 |
| BMO Capital | Maintain | Outperform | 2025-12-04 |
| Baird | Maintain | Outperform | 2025-12-04 |
| Evercore ISI Group | Maintain | Outperform | 2025-12-04 |
| Evercore ISI Group | Maintain | Outperform | 2025-11-28 |
| Baird | Maintain | Outperform | 2025-11-26 |
| Citizens | Downgrade | Market Perform | 2025-11-13 |
| Citigroup | Maintain | Neutral | 2025-11-03 |
The consensus among analysts leans toward a Hold rating, with several maintaining Outperform grades but no recent upgrades or strong buys. The overall trend reflects a stable outlook with cautious positioning by most firms.
Consumer Opinions
Consumers of Alexandria Real Estate Equities, Inc. (ARE) express a mix of enthusiasm and caution regarding their experiences with the company.
| Positive Reviews | Negative Reviews |
|---|---|
| “Strong portfolio in life science hubs ensures steady growth.” | “Rent increases have impacted smaller tenants negatively.” |
| “Professional management team and transparent communication.” | “Occasional delays in property maintenance reported.” |
| “Innovative property solutions tailored for biotech firms.” | “High entry costs deter small investors from participation.” |
Overall, consumers appreciate Alexandria’s focused expertise in life science real estate and strong management, but concerns persist around affordability and maintenance responsiveness. These insights highlight the importance of balancing premium service with tenant cost sensitivity.
Risk Analysis
Below is a summary table outlining key risk categories for Alexandria Real Estate Equities, Inc., including their descriptions, probabilities, and potential impacts:
| Category | Description | Probability | Impact |
|---|---|---|---|
| Financial Stability | Low Altman Z-Score (0.36) signals high bankruptcy risk and financial distress. | High | Severe |
| Profitability | Low ROE (1.81%) and ROIC (2.16%) indicate weak returns on equity and invested capital. | Medium | Moderate |
| Valuation Risk | Elevated P/E ratio (51.98) suggests overvaluation and potential price correction. | Medium | Moderate |
| Liquidity Risk | Poor current and quick ratios (0.4) point to limited short-term liquidity to cover obligations. | Medium | High |
| Market Volatility | Beta of 1.32 indicates above-average stock price volatility relative to the market. | High | Moderate |
| Sector Concentration | Heavy focus on life science and technology campuses may face sector-specific downturns. | Medium | High |
The highest risks lie in Alexandria’s financial distress signals, notably the distress-zone Altman Z-score, alongside liquidity challenges. These factors, combined with an unfavorable return profile and valuation concerns, warrant cautious risk management despite the company’s strategic niche in urban innovation clusters.
Should You Buy Alexandria Real Estate Equities, Inc.?
Alexandria Real Estate Equities, Inc. appears to have a challenging profile, with declining operational efficiency and a deteriorating competitive moat indicating value destruction. While its leverage profile is moderate, the overall financial health could be seen as cautious, reflected in a C+ rating.
Strength & Efficiency Pillars
Alexandria Real Estate Equities, Inc. demonstrates solid profitability with a gross margin of 70.19% and a net margin of 10.59%, indicating effective cost management and revenue retention. Its weighted average cost of capital (WACC) stands at a favorable 6.02%, though return on invested capital (ROIC) at 2.16% falls short, signaling value erosion rather than creation. Financial health metrics raise concerns, with an Altman Z-score of 0.36 placing the company in the distress zone, while the Piotroski score of 4 suggests average financial strength.
Weaknesses and Drawbacks
The company exhibits several notable weaknesses that warrant caution. A high price-to-earnings ratio of 51.98 signals a premium valuation that may not be justified by underlying earnings performance. Liquidity issues are evident from a low current ratio of 0.4 and quick ratio of 0.4, reflecting potential short-term solvency risks. Additionally, return on equity is weak at 1.81%, and asset turnover is low at 0.08, indicating inefficiencies in asset utilization. The bearish overall stock trend with a price decline of 51.97% underscores significant market pressure.
Our Verdict about Alexandria Real Estate Equities, Inc.
The long-term fundamental profile of Alexandria Real Estate Equities, Inc. appears unfavorable due to value destruction and financial distress signals. However, the recent period shows a slightly buyer-dominant trend with 59.94% buyer volume and a modest 7.34% price increase, suggesting some short-term recovery. Despite these signs, the persistent fundamental weaknesses and bearish overall trend may suggest a cautious, wait-and-see approach for investors seeking better entry points.
Disclaimer: This content is for informational purposes only and does not constitute financial, investment, or other professional advice. Investing in financial markets involves a significant risk of loss, and past performance is not indicative of future results.
Additional Resources
- Alexandria Real Estate Equities, Inc. Announces Tax Treatment of Year 2025 Distributions – PR Newswire (Jan 23, 2026)
- Alexandria Real Estate 72 Hour Deadline Alert: Kahn Swick & Foti, LLC Reminds Investors With Losses In Excess Of $100,000 of Deadline in Class Action Lawsuit Against Alexandria Real Estate Equities, Inc. – ARE – Business Wire (Jan 23, 2026)
- Class Actions Test Alexandria Real Estate Equities Disclosure And REIT Thesis – simplywall.st (Jan 23, 2026)
- Alexandria Real Estate Equities, Inc. (ARE) Shareholders Who Lost Money Have Opportunity to Lead Securities Fraud Lawsuit – marketscreener.com (Jan 23, 2026)
- Strs Ohio Buys 235,801 Shares of Alexandria Real Estate Equities, Inc. $ARE – MarketBeat (Jan 23, 2026)
For more information about Alexandria Real Estate Equities, Inc., please visit the official website: are.com