Home > Analyses > Consumer Defensive > Albertsons Companies, Inc.
Albertsons Companies, Inc. transforms everyday living by ensuring millions of Americans have access to essential groceries, pharmacy services, and fuel through its extensive network of stores and innovative retail solutions. As a dominant player in the grocery store industry, Albertsons is renowned for its strong portfolio of well-established banners and commitment to quality and convenience. As we analyze its current position, the key question remains: do Albertsons’ fundamentals support continued growth and justify its market valuation in an evolving retail landscape?

Table of contents
Business Model & Company Overview
Albertsons Companies, Inc., founded in 1860 and headquartered in Boise, Idaho, stands as a leading player in the grocery retail industry across the United States. Its expansive ecosystem includes 2,276 stores under multiple banners such as Safeway and Vons, complemented by 1,722 pharmacies, 1,317 in-store coffee shops, fuel centers, manufacturing sites, and digital platforms, creating a comprehensive food and drug retail experience. This integrated network supports its core mission to serve diverse consumer needs through grocery, health, beauty, and general merchandise.
The company’s revenue engine balances brick-and-mortar retail with value-added services like pharmacy and fuel, plus proprietary food manufacturing and digital sales channels. This diversified approach drives consistent cash flow from recurring purchases and enhances customer loyalty. With a footprint spanning major US markets, Albertsons leverages distribution centers and in-house production to optimize supply and cost efficiency. Its robust presence and multifaceted operations form a durable economic moat, positioning it to shape the future of food and drug retail.
Financial Performance & Fundamental Metrics
I will analyze Albertsons Companies, Inc.’s income statement, key financial ratios, and dividend payout policy to provide a clear view of its fundamental health.
Income Statement
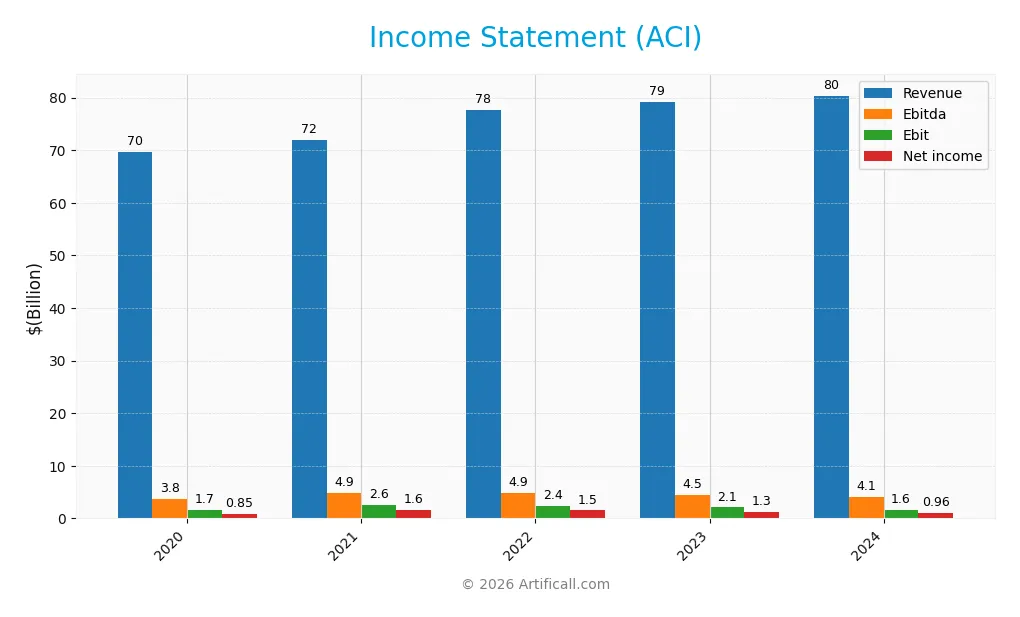
Below is the income statement of Albertsons Companies, Inc. (ACI) for the fiscal years 2020 through 2024, showing key financial metrics in USD.
| 2020 | 2021 | 2022 | 2023 | 2024 | |
|---|---|---|---|---|---|
| Revenue | 69.7B | 71.9B | 77.6B | 79.2B | 80.4B |
| Cost of Revenue | 49.3B | 51.2B | 55.9B | 57.2B | 58.1B |
| Operating Expenses | 18.8B | 18.3B | 19.4B | 20.0B | 20.7B |
| Gross Profit | 20.4B | 20.7B | 21.8B | 22.0B | 22.3B |
| EBITDA | 3.8B | 4.9B | 4.9B | 4.5B | 4.1B |
| EBIT | 1.7B | 2.6B | 2.4B | 2.1B | 1.6B |
| Interest Expense | 534M | 482M | 405M | 508M | 470M |
| Net Income | 850M | 1.6B | 1.5B | 1.3B | 959M |
| EPS | 1.70 | 2.73 | 2.29 | 2.25 | 1.65 |
| Filing Date | 2021-04-28 | 2022-04-26 | 2023-04-25 | 2024-04-22 | 2025-04-21 |
Income Statement Evolution
Albertsons Companies, Inc. showed overall revenue growth of 15.35% from 2020 to 2024, but growth slowed to 1.46% in the last year. Net income also increased by 12.75% over the period, yet it declined by 27.09% in the most recent year. Gross margins remained favorable at 27.68%, while EBIT and net margins showed neutral to slightly declining trends, reflecting margin pressure.
Is the Income Statement Favorable?
In 2024, revenue reached $80.4B with a gross profit of $22.3B, but EBIT dropped 23.93% year-over-year to $1.58B and net income fell to $959M, reflecting a 1.19% net margin. Interest expenses remained favorable at 0.58% of revenue. Despite solid top-line growth over five years, recent declines in profitability and margins lead to an overall unfavorable income statement evaluation for 2024.
Financial Ratios
The following table presents key financial ratios for Albertsons Companies, Inc. (ACI) over the fiscal years 2020 to 2024, reflecting profitability, liquidity, leverage, efficiency, and dividend metrics:
| Ratios | 2020 | 2021 | 2022 | 2023 | 2024 |
|---|---|---|---|---|---|
| Net Margin | 1.22% | 2.25% | 1.95% | 1.64% | 1.19% |
| ROE | 64.20% | 53.55% | 93.97% | 47.17% | 28.31% |
| ROIC | 5.21% | 7.87% | 8.18% | 7.57% | 5.75% |
| P/E | 9.52 | 8.62 | 7.18 | 9.52 | 12.44 |
| P/B | 6.11 | 4.61 | 6.75 | 4.49 | 3.52 |
| Current Ratio | 1.02 | 1.00 | 0.74 | 0.84 | 0.90 |
| Quick Ratio | 0.39 | 0.46 | 0.18 | 0.18 | 0.22 |
| D/E | 12.13 | 5.06 | 9.32 | 5.18 | 4.19 |
| Debt-to-Assets | 54.67% | 49.74% | 52.19% | 49.45% | 48.39% |
| Interest Coverage | 3.03 | 5.06 | 5.70 | 4.07 | 3.29 |
| Asset Turnover | 2.37 | 2.34 | 2.70 | 2.75 | 2.74 |
| Fixed Asset Turnover | 4.52 | 4.71 | 5.10 | 5.10 | 5.04 |
| Dividend Yield | 1.97% | 2.31% | 38.99% | 2.25% | 2.48% |
Evolution of Financial Ratios
Between 2020 and 2024, Albertsons Companies, Inc. saw a fluctuating trend in its key financial ratios. Return on Equity (ROE) showed volatility but remained relatively strong, peaking around 94% in 2022 before settling at 28.31% in 2024. The Current Ratio displayed a downward trend, declining from above 1.0 to 0.9, indicating reduced short-term liquidity. The Debt-to-Equity Ratio consistently remained high, around 4.19 in 2024, suggesting sustained leverage and financial risk. Profitability margins, including net margin, generally declined, reflecting pressure on earnings.
Are the Financial Ratios Favorable?
In fiscal year 2024, profitability indicators present mixed signals: ROE is favorable at 28.31%, while net margin is low at 1.19%, deemed unfavorable. Liquidity ratios such as Current Ratio (0.9) and Quick Ratio (0.22) are unfavorable, indicating potential short-term solvency concerns. Leverage is high with a Debt-to-Equity ratio of 4.19, also unfavorable, but Debt-to-Assets remains neutral at 48.39%. Efficiency ratios like Asset Turnover (2.74) and Fixed Asset Turnover (5.04) are favorable. Market valuation metrics show positive Price-to-Earnings at 12.44 but an unfavorable Price-to-Book of 3.52. Overall, the global opinion on ratios is slightly favorable.
Shareholder Return Policy
Albertsons Companies, Inc. maintains a consistent dividend policy with a payout ratio around 30%, yielding approximately 2.5% annually. The dividend per share has shown a steady increase, supported by free cash flow coverage above 1.2x, while the company also pursues share buybacks.
This balanced approach suggests a focus on sustainable distributions and capital returns without overleveraging. Coverage metrics and controlled repurchases indicate prudent risk management, supporting long-term value creation for shareholders through stable income and disciplined capital allocation.
Score analysis
The following radar chart illustrates Albertsons Companies, Inc.’s key financial metric scores for quick comparison:
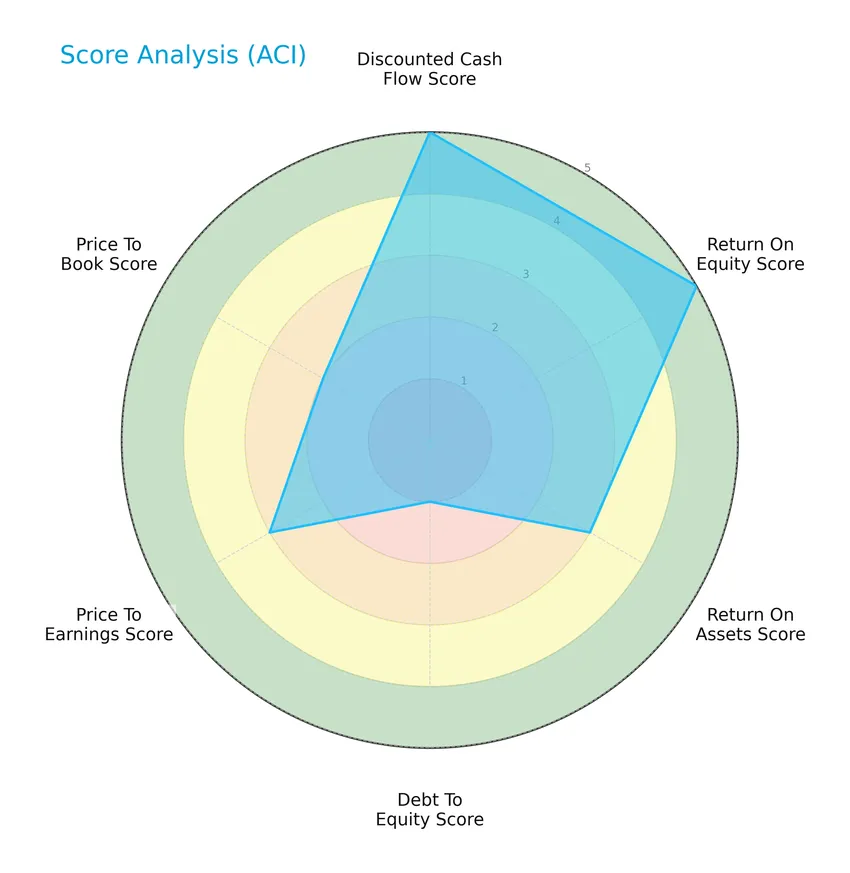
Albertsons shows very favorable scores in discounted cash flow and return on equity at 5 each, indicating strong valuation and profitability. Return on assets and price-to-earnings scores are moderate at 3, while debt-to-equity is very unfavorable at 1, reflecting high leverage. Price-to-book is moderately rated at 2.
Analysis of the company’s bankruptcy risk
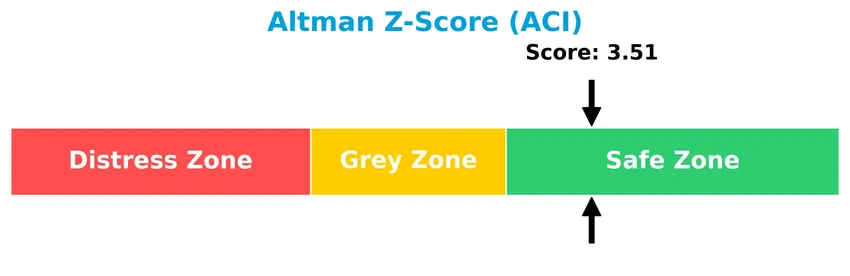
Albertsons Companies, Inc. presents an Altman Z-Score of 3.51, placing it securely in the safe zone and indicating a low probability of bankruptcy:
Is the company in good financial health?
The Piotroski Score diagram below provides insight into Albertsons Companies, Inc.’s financial strength:

With a Piotroski Score of 6 classified as average, the company demonstrates moderate financial health, suggesting reasonable profitability and operational efficiency but room for improvement in some areas.
Competitive Landscape & Sector Positioning
This sector analysis will examine Albertsons Companies, Inc.’s strategic positioning, revenue by segment, key products, main competitors, competitive advantages, and SWOT analysis. I will assess whether Albertsons holds a competitive advantage over other players in the grocery stores industry.
Strategic Positioning
Albertsons Companies, Inc. operates a diversified product portfolio including fresh goods (25.5B), non-perishables (40.1B), pharmacy (9.6B), fuel (4.0B), and other services (1.2B) across 2,276 stores in the US, reflecting broad geographic and category exposure within grocery and related retail sectors.
Revenue by Segment
The pie chart illustrates Albertsons Companies, Inc.’s revenue distribution by product segment for the fiscal year 2024, highlighting the company’s diversified income sources.
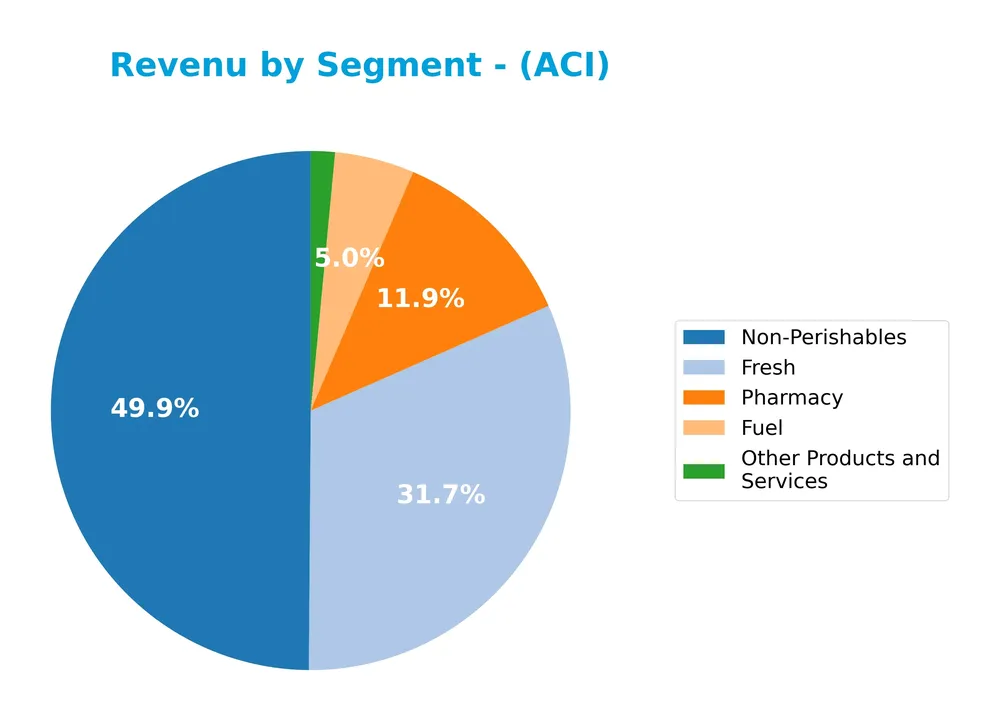
In 2024, Non-Perishables led with $40.1B, closely followed by Fresh at $25.5B, showing stable demand in staple grocery categories. Pharmacy revenue notably increased to $9.6B, reflecting growth in health-related products. Fuel revenue declined to $4.0B, indicating a contraction in that segment. Other Products and Services remained a minor contributor at $1.2B. Overall, the revenue concentration in core grocery segments remains strong with pharmacy gains driving recent growth.
Key Products & Brands
The table below outlines Albertsons Companies, Inc.’s principal product categories and brand segments:
| Product | Description |
|---|---|
| Fresh | Fresh food products including perishables such as produce, meat, and dairy categories. |
| Fuel | Fuel sales through 402 adjacent fuel centers located near stores. |
| Non-Perishables | Packaged grocery items and general merchandise with longer shelf life. |
| Pharmacy | Pharmacy operations including 1,722 pharmacies offering prescription and health products. |
| Other Products and Services | Additional items and services beyond core grocery and pharmacy offerings. |
| Store Banners | Operates 2,276 stores under various brand names such as Albertsons, Safeway, Vons, and others. |
Albertsons Companies generates revenue mainly from fresh and non-perishable grocery sales, supplemented by pharmacy services and fuel sales, supported by a broad multi-brand retail presence.
Main Competitors
Albertsons Companies, Inc. faces 2 main competitors in the Grocery Stores industry; below is a table of the top 2 leaders by market capitalization:
| Competitor | Market Cap. |
|---|---|
| The Kroger Co. | 41.7B |
| Albertsons Companies, Inc. | 9.4B |
Albertsons Companies, Inc. ranks 2nd among its competitors, holding about 22% of the market cap of the top player, The Kroger Co. The company is positioned below both the average market cap of the top 10 competitors (25.6B) and the median market cap within the sector. It also trails its closest competitor by a significant distance of +345.22%.
Comparisons with competitors
Check out how we compare the company to its competitors:
Does Albertsons Companies have a competitive advantage?
Albertsons Companies, Inc. currently does not demonstrate a clear competitive advantage, as it is shedding value with ROIC below WACC, despite a slightly favorable overall moat rating. The company’s profitability is increasing with a growing ROIC trend, suggesting improving capital efficiency over the 2020-2024 period.
Looking ahead, Albertsons operates a large network of stores, pharmacies, fuel centers, and manufacturing facilities, which may offer avenues for expansion and innovation. The company’s presence across various banners and digital platforms could enable it to explore new markets and product offerings to enhance future growth opportunities.
SWOT Analysis
This SWOT analysis highlights Albertsons Companies, Inc.’s key internal and external factors to guide strategic investment decisions.
Strengths
- Strong market position with 2,276 stores
- Favorable ROE at 28.31%
- Robust asset turnover ratio
Weaknesses
- Declining EBIT and net margin growth
- High debt-to-equity ratio at 4.19
- Low liquidity ratios (current 0.9, quick 0.22)
Opportunities
- Expansion of digital platforms and e-commerce
- Growing demand for health and beauty products
- Potential to improve operational efficiency
Threats
- Intense competition in grocery retail
- Economic downturn impacting consumer spending
- Rising supply chain and labor costs
Overall, Albertsons shows solid strengths in market presence and profitability metrics but faces financial weaknesses related to margins and leverage. Strategic focus should target margin improvement and debt management while capitalizing on digital growth and consumer trends to mitigate competitive and economic risks.
Stock Price Action Analysis
The following weekly stock chart illustrates Albertsons Companies, Inc. (ACI) price movements and trends over the past 12 months:
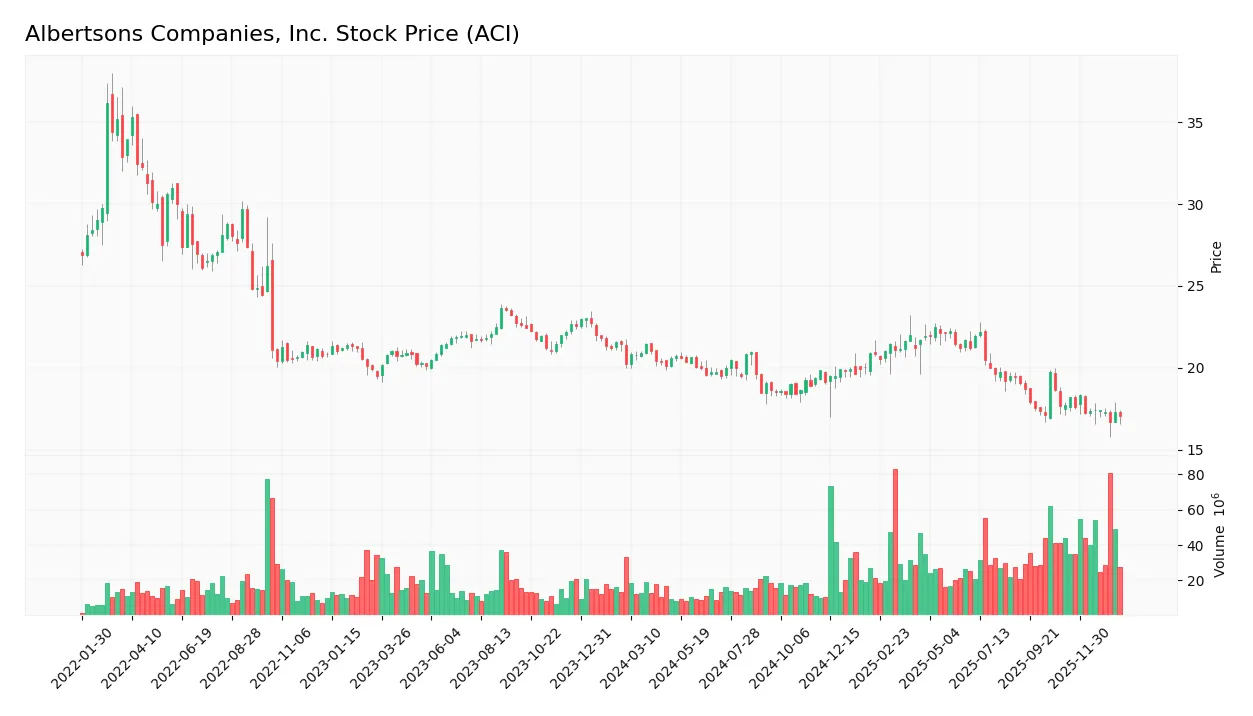
Trend Analysis
Over the past 12 months, ACI’s stock price declined by 15.75%, indicating a bearish trend with price deceleration. The stock fluctuated between a high of 22.47 and a low of 16.66, showing moderate volatility with a standard deviation of 1.43. Recent weeks confirm continuation of this downward momentum.
Volume Analysis
In the last three months, trading volume has been increasing, with a total buyer volume of 276M versus seller volume of 240M, reflecting slight buyer dominance at 53.49%. This suggests cautious optimism among investors, with market participation strengthening but not decisively bullish.
Target Prices
The current analyst consensus for Albertsons Companies, Inc. (ACI) target prices reflects moderate upside potential.
| Target High | Target Low | Consensus |
|---|---|---|
| 29 | 14 | 20.88 |
Analysts expect ACI’s share price to trade between $14 and $29, with a consensus target near $20.88, indicating cautious optimism about its near-term performance.

Don’t Let Luck Decide Your Entry Point
Optimize your entry points with our advanced ProRealTime indicators. You’ll get efficient buy signals with precise price targets for maximum performance. Start outperforming now!
Analyst & Consumer Opinions
This section reviews recent analyst ratings and consumer feedback related to Albertsons Companies, Inc. (ACI).
Stock Grades
Here is a summary of recent stock grades from established financial institutions for Albertsons Companies, Inc.:
| Grading Company | Action | New Grade | Date |
|---|---|---|---|
| Morgan Stanley | Downgrade | Underweight | 2026-01-15 |
| UBS | Maintain | Buy | 2026-01-08 |
| Telsey Advisory Group | Maintain | Outperform | 2026-01-08 |
| Barclays | Maintain | Underweight | 2026-01-08 |
| Wells Fargo | Maintain | Overweight | 2026-01-08 |
| JP Morgan | Maintain | Overweight | 2026-01-08 |
| BMO Capital | Maintain | Outperform | 2026-01-08 |
| Telsey Advisory Group | Maintain | Outperform | 2025-12-31 |
| Evercore ISI Group | Maintain | In Line | 2025-12-23 |
| Evercore ISI Group | Maintain | In Line | 2025-11-11 |
The consensus rating is “Buy,” supported by 11 buy recommendations against 10 holds and 2 sells. Most analysts maintain their ratings, with Morgan Stanley notably downgrading the stock to underweight, reflecting a cautious outlook.
Consumer Opinions
Albertsons Companies, Inc. (ACI) enjoys a mixed but generally positive sentiment among consumers, reflecting its strong presence in the grocery retail sector.
| Positive Reviews | Negative Reviews |
|---|---|
| “Wide variety of fresh products and competitive prices.” | “Checkout lines can be long during peak hours, causing delays.” |
| “Friendly staff and clean store environment.” | “Some locations have inconsistent stock availability.” |
| “Good loyalty program with valuable discounts.” | “Occasional issues with online order accuracy and delivery times.” |
Overall, consumers appreciate Albertsons for its product variety and customer service, though some express frustration with store crowding and occasional stock or online order issues. These areas may warrant attention to enhance customer satisfaction.
Risk Analysis
Below is a summary table highlighting key risks associated with Albertsons Companies, Inc., focusing on likelihood and potential impacts:
| Category | Description | Probability | Impact |
|---|---|---|---|
| Financial Leverage | High debt-to-equity ratio (4.19) increases financial risk | High | High |
| Liquidity | Low current (0.9) and quick ratios (0.22) indicate liquidity constraints | Medium | Medium |
| Profitability | Unfavorable net margin (1.19%) suggests thin profitability | Medium | Medium |
| Market Volatility | Low beta (0.308) limits stock price volatility but may reduce upside | Low | Low |
| Competitive Sector | Intense competition in grocery retail could pressure margins | Medium | High |
| Operational Risks | Supply chain disruptions or rising costs could impact earnings | Medium | Medium |
The most pressing risks are Albertsons’ high financial leverage and competitive pressures, which could affect stability despite a solid Altman Z-score (3.51, safe zone). Investors should monitor debt management and margin trends carefully.
Should You Buy Albertsons Companies, Inc.?
Albertsons Companies, Inc. appears to be improving profitability with growing ROIC but may be shedding value relative to WACC, suggesting a slightly favorable moat. Despite substantial leverage and moderate financial strength scores, its overall rating of B+ suggests a cautious yet potentially promising profile.
Strength & Efficiency Pillars
Albertsons Companies, Inc. exhibits solid profitability with a return on equity (ROE) of 28.31%, reflecting effective capital use. Its Altman Z-Score of 3.51 places the company securely in the safe zone, signaling robust financial health and low bankruptcy risk. The firm’s weighted average cost of capital (WACC) stands at 3.98%, comfortably below its return on invested capital (ROIC) of 5.75%, indicating it is a value creator. Favorable asset turnover ratios (2.74) and a dividend yield of 2.48% further underscore operational efficiency and shareholder returns.
Weaknesses and Drawbacks
Despite strengths, Albertsons faces notable risks. Its debt-to-equity ratio is elevated at 4.19, categorized as very unfavorable, raising concerns about leverage and financial flexibility. Liquidity is constrained, with a current ratio at 0.9 and a quick ratio of 0.22, both unfavorable and suggesting short-term solvency pressures. The price-to-book ratio of 3.52 is also unfavorable, indicating a relatively high valuation compared to book value. Moreover, the stock has experienced a bearish overall trend with a 15.75% decline, reflecting market pressure despite a recent slight buyer dominance.
Our Verdict about Albertsons Companies, Inc.
Albertsons presents a favorable long-term fundamental profile, supported by strong profitability and financial stability metrics. However, the bearish stock trend and elevated leverage imply caution. Despite recent slight buyer dominance, the overall market pressure suggests that investors might consider a wait-and-see approach for a more attractive entry point. The company’s profile may appear suitable for disciplined investors with a tolerance for short-term volatility.
Disclaimer: This content is for informational purposes only and does not constitute financial, investment, or other professional advice. Investing in financial markets involves a significant risk of loss, and past performance is not indicative of future results.
Additional Resources
- Albertsons® Companies, Inc. Announces Pricing of Its Senior Notes Offering – Business Wire (Jan 22, 2026)
- Massachusetts Financial Services Co. MA Increases Holdings in Albertsons Companies, Inc. $ACI – MarketBeat (Jan 20, 2026)
- BofA Maintains a Neutral Rating on Albertsons Companies, Inc. (ACI) – Yahoo Finance (Jan 14, 2026)
- Is the Options Market Predicting a Spike in Albertsons Companies Stock? – Zacks Investment Research (Jan 20, 2026)
- Albertsons: Is This Stock Too Good To Be True? (NYSE:ACI) – Seeking Alpha (Jan 22, 2026)
For more information about Albertsons Companies, Inc., please visit the official website: albertsonscompanies.com