Home > Analyses > Basic Materials > Albemarle Corporation
Albemarle Corporation powers the future with essential chemicals that drive electric vehicles, consumer electronics, and advanced industrial solutions. As a global leader in specialty chemicals, Albemarle stands out for its dominance in lithium production, vital for energy storage, alongside its innovative bromine and catalyst segments. The company’s reputation for quality and cutting-edge technology shapes multiple high-growth markets. Yet, the key question remains: do Albemarle’s fundamentals support its premium valuation and long-term growth prospects?

Table of contents
Business Model & Company Overview
Albemarle Corporation, founded in 1887 and headquartered in Charlotte, NC, leads the specialty chemicals industry with a comprehensive ecosystem spanning lithium, bromine, and catalysts. Its portfolio integrates critical materials for energy storage, pharmaceuticals, and automotive sectors, positioning it as a key enabler of innovation across multiple high-growth markets. This diversity fuels Albemarle’s stature as a dominant force in advanced chemical solutions.
The company’s revenue engine balances the sale of lithium compounds, bromine-based fire safety products, and catalytic additives, blending commodity and specialty chemicals with technical services. Albemarle’s strategic footprint spans the Americas, Europe, and Asia, capturing demand from electric vehicles, refining, and life sciences. Its robust economic moat derives from proprietary technologies and deep integration in global supply chains, securing long-term competitive advantage.
Financial Performance & Fundamental Metrics
I will analyze Albemarle Corporation’s income statement, key financial ratios, and dividend payout policy to assess its operational strength and shareholder returns.
Income Statement
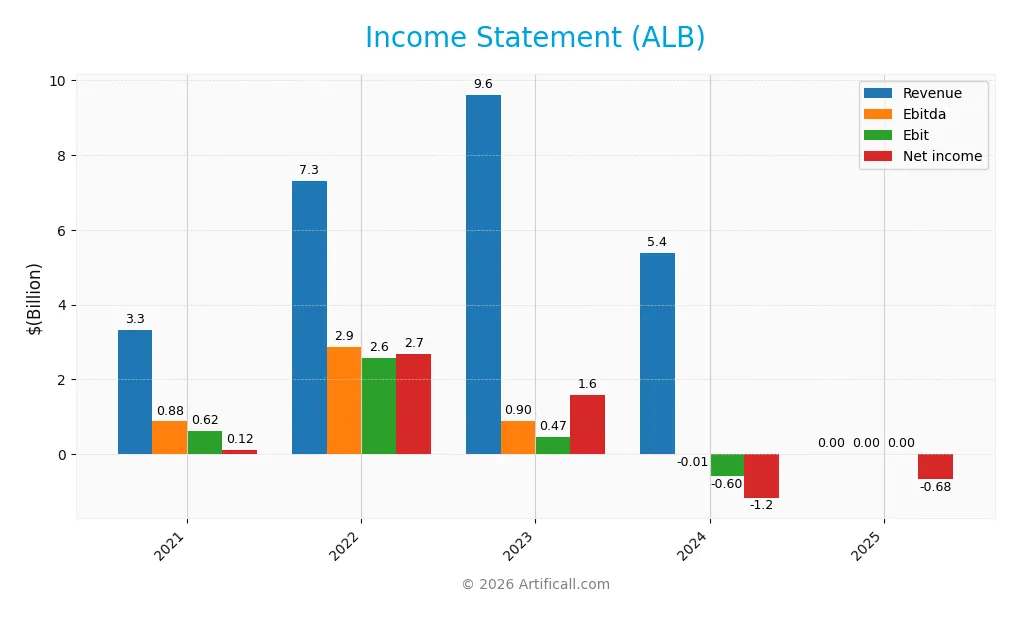
The table below presents Albemarle Corporation’s key income statement figures from 2021 through 2025, reflecting significant earnings volatility and margin shifts.
| 2021 | 2022 | 2023 | 2024 | 2025 | |
|---|---|---|---|---|---|
| Revenue | 3.33B | 7.32B | 9.62B | 5.38B | 0 |
| Cost of Revenue | 2.32B | 4.24B | 8.42B | 5.29B | 0 |
| Operating Expenses | 210M | 608M | 945M | 1.86B | 0 |
| Gross Profit | 1.01B | 3.08B | 1.20B | 84M | 0 |
| EBITDA | 875M | 2.87B | 897M | -9M | 0 |
| EBIT | 621M | 2.57B | 467M | -598M | 0 |
| Interest Expense | 61M | 123M | 116M | 166M | 0 |
| Net Income | 124M | 2.69B | 1.57B | -1.18B | -677M |
| EPS | 1.07 | 22.97 | 13.41 | -11.20 | -5.76 |
| Filing Date | 2023-01-26 | 2023-04-21 | 2024-03-28 | 2025-02-12 | 2026-02-11 |
Income Statement Evolution
Albemarle’s revenue declined sharply from $9.6B in 2023 to zero in 2025, a steep negative trend. Net income followed suit, swinging from a $1.57B profit in 2023 to a $677M loss in 2025. Margins deteriorated markedly, with gross and net margins collapsing to zero by 2025, signaling severe profitability erosion.
Is the Income Statement Favorable?
The 2025 income statement reveals a net loss of $677M and an EPS of -$5.76, reflecting a significant downturn. With zero reported revenue and expenses, the statement underscores a pause or disruption in operations. The unfavorable gross and net margins, alongside a steep revenue drop, indicate weak fundamentals in the latest fiscal year.
Financial Ratios
The table below presents key financial ratios for Albemarle Corporation (ALB) from 2021 to 2025, highlighting trends and liquidity measures:
| Ratios | 2021 | 2022 | 2023 | 2024 | 2025 |
|---|---|---|---|---|---|
| Net Margin | 3.7% | 36.7% | 16.4% | -21.9% | 0% |
| ROE | 2.2% | 33.7% | 16.7% | -11.8% | -110.7% |
| ROIC | 7.3% | 17.1% | 1.3% | -11.8% | 0% |
| P/E | 219x | 9.4x | 10.8x | -8.6x | 0 |
| P/B | 4.81x | 3.18x | 1.80x | 1.02x | 0 |
| Current Ratio | 1.06x | 1.89x | 1.47x | 1.95x | 3.16x |
| Quick Ratio | 0.64x | 1.13x | 0.86x | 1.19x | 1.54x |
| D/E | 0.45x | 0.42x | 0.45x | 0.36x | 0 |
| Debt-to-Assets | 23% | 21% | 23% | 22% | 0% |
| Interest Coverage | 13.0x | 20.1x | 2.2x | -10.7x | 0 |
| Asset Turnover | 0.30x | 0.47x | 0.53x | 0.32x | 0 |
| Fixed Asset Turnover | 0.55x | 1.03x | 1.00x | 0.57x | 0 |
| Dividend Yield | 0.66% | 0.73% | 1.10% | 3.08% | 0% |
Evolution of Financial Ratios
Albemarle’s Return on Equity (ROE) declined sharply to -110.7% in 2025, reflecting deteriorating profitability. The Current Ratio improved significantly to 3.16, indicating stronger short-term liquidity. The Debt-to-Equity Ratio remained stable at zero, suggesting no new leverage. Profitability metrics showed a clear downward trend, with margins dropping to zero or negative levels.
Are the Financial Ratios Fovorable?
In 2025, Albemarle’s liquidity appears mixed: the high Current Ratio contrasts with a low Interest Coverage Ratio of zero, signaling potential solvency issues. Profitability ratios like ROE and Net Margin are unfavorable, while leverage indicators such as Debt-to-Equity and Debt-to-Assets ratios are favorable. Efficiency ratios also remain weak. Overall, 57% of key ratios are unfavorable, indicating financial challenges despite pockets of strength.
Shareholder Return Policy
Albemarle Corporation does not currently pay dividends, as indicated by a zero dividend per share in 2025 and a negative dividend payout ratio. The company appears focused on reinvestment, supported by a current ratio of 3.16 and a free cash flow operating cash flow ratio of 0.54, signaling liquidity and operational cash flow retention.
The absence of dividends aligns with a strategy prioritizing capital allocation towards growth or debt management rather than shareholder distributions. There is no explicit mention of share buyback programs, suggesting the company’s return policy currently emphasizes sustainability over immediate shareholder cash returns, which may support long-term value creation.
Score analysis
The following radar chart presents Albemarle Corporation’s key financial scores for a comprehensive overview:
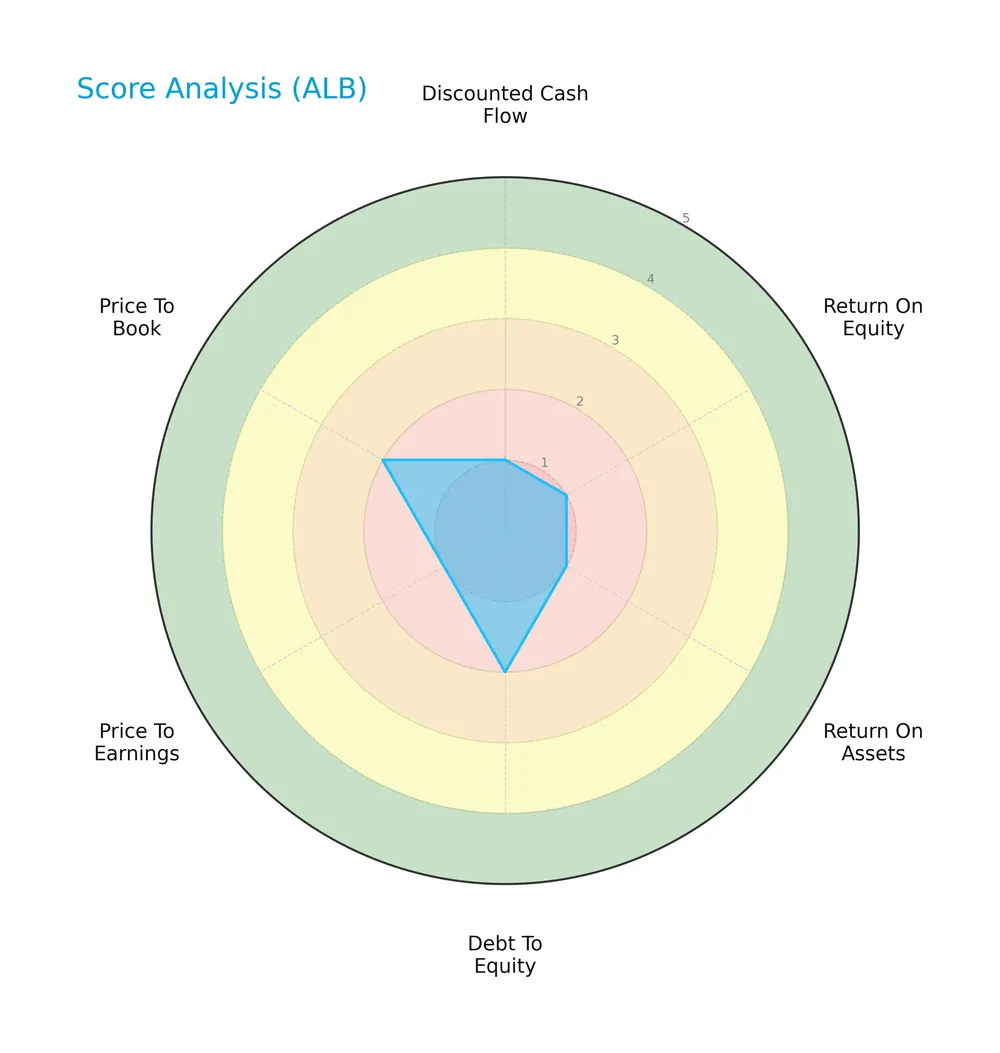
Albemarle’s scores reveal significant weaknesses in cash flow, profitability, and valuation metrics, with very unfavorable ratings in DCF, ROE, ROA, and P/E. Debt-to-equity and price-to-book scores are slightly better but remain unfavorable.
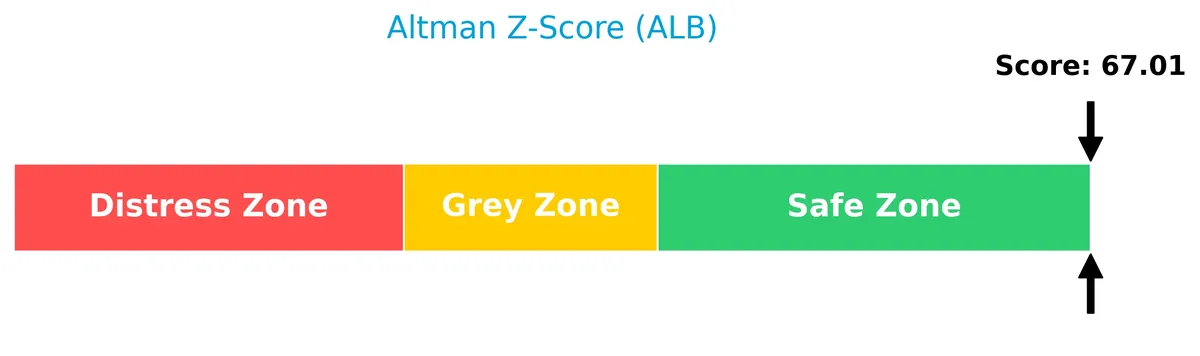
Analysis of the company’s bankruptcy risk
Albemarle’s Altman Z-Score places it firmly in the safe zone, indicating a very low risk of bankruptcy:
Is the company in good financial health?
The Piotroski Score diagram outlines Albemarle’s moderate financial health status:

With a Piotroski score of 5, Albemarle shows average financial strength, suggesting mixed signals in profitability, leverage, and liquidity metrics. This score indicates neither strong resilience nor significant distress.
Competitive Landscape & Sector Positioning
This section analyzes Albemarle Corporation’s strategic positioning, revenue segments, and key products within the specialty chemicals sector. I will assess whether Albemarle holds a competitive advantage over its main industry rivals.
Strategic Positioning
Albemarle concentrates its portfolio in specialty chemicals, focusing on Lithium, Bromine, and Catalysts segments. It generates most revenue internationally, with a significant U.S. presence (~890M in 2025). The company targets diverse industrial markets, emphasizing energy storage and chemical solutions.
Revenue by Segment
This pie chart illustrates Albemarle Corporation’s revenue distribution by key segments for the fiscal year 2025, highlighting where the company generates its sales.
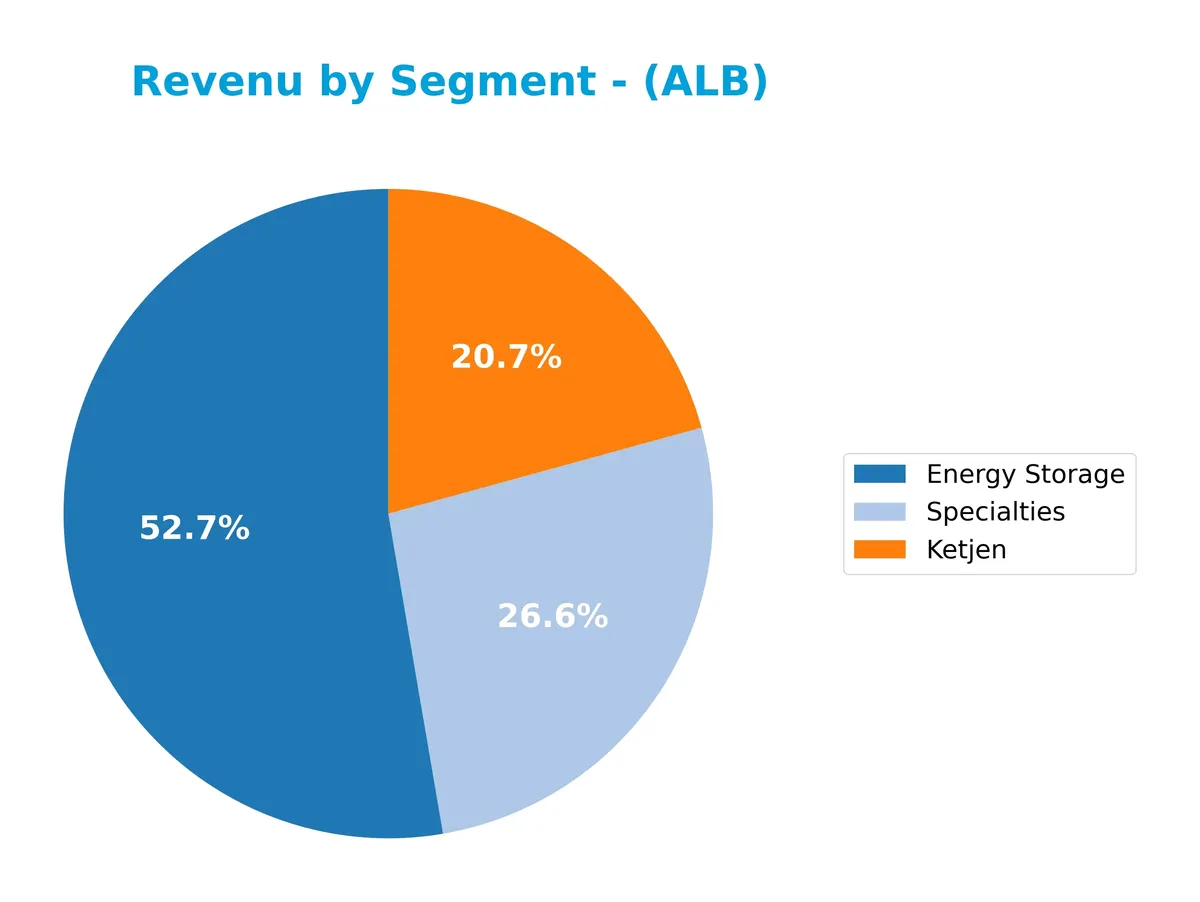
In 2025, Energy Storage leads with $2.7B, followed by Specialties at $1.4B and Ketjen at $1.1B. Energy Storage’s decline from $3.0B in 2024 signals a recent slowdown. The portfolio shows diversification, but Energy Storage remains the core driver, posing concentration risk if demand weakens further. Specialties and Ketjen provide steady support, cushioning volatility in the primary segment.
Key Products & Brands
The following table outlines Albemarle Corporation’s main products and brands by segment and application:
| Product | Description |
|---|---|
| Lithium Compounds | Includes lithium carbonate, lithium hydroxide, lithium chloride, and lithium specialties used in lithium batteries for electronics and electric vehicles, greases, elastomers, catalysts, pharmaceuticals, and life sciences markets. |
| Bromine Products | Comprises elemental bromine, alkyl and inorganic bromides, brominated activated carbon, and tertiary amines for fire safety, chemical synthesis, oil and gas drilling, water purification, and sanitizers. |
| Catalysts | Hydroprocessing, isomerization, alkylation catalysts, fluidized catalytic cracking catalysts and additives, plus organometallics and curatives serving petroleum refining, pharmaceuticals, and crop protection industries. |
| Cesium Products | Used in chemical and pharmaceutical applications. |
| Zirconium, Barium, Titanium Products | Applied in pyrotechnical uses such as airbag initiators. |
| Reagents | Butyllithium and lithium aluminum hydride for organic synthesis in steroids, vitamins, and pharmaceutical manufacturing. |
| Technical Services | Handling and use of reactive lithium products, including recycling of lithium-containing by-products. |
Albemarle’s portfolio centers on engineered specialty chemicals with a strong focus on lithium and bromine products, supported by catalysts and reagents. These products serve diverse markets including energy storage, automotive, pharmaceuticals, and refining, reflecting a broad industrial footprint.
Main Competitors
There are 9 competitors in the Basic Materials sector for Albemarle Corporation, with the table showing the top 10 leaders by market capitalization:
| Competitor | Market Cap. |
|---|---|
| Linde plc | 200B |
| The Sherwin-Williams Company | 81.5B |
| Ecolab Inc. | 74.5B |
| Air Products and Chemicals, Inc. | 56B |
| PPG Industries, Inc. | 23.4B |
| International Flavors & Fragrances Inc. | 17.4B |
| DuPont de Nemours, Inc. | 17.1B |
| Albemarle Corporation | 16.9B |
| LyondellBasell Industries N.V. | 14.3B |
Albemarle ranks 8th among its 9 competitors by market capitalization. Its scale represents roughly 9.3% of the sector leader, Linde plc. The company stands below both the average market cap of the top 10 competitors (56B) and the median market cap in the sector (23.4B). Albemarle maintains an 8.46% gap from the next competitor above, indicating a modest but meaningful distance in scale.
Comparisons with competitors
Check out how we compare the company to its competitors:
Does Albemarle Corporation have a competitive advantage?
Albemarle operates in specialty chemicals with diversified segments in lithium, bromine, and catalysts. However, key profitability metrics and ROIC trends are currently unfavorable or unavailable, limiting evidence of a sustainable competitive advantage.
Looking ahead, Albemarle serves growth markets like energy storage and electric vehicles. Its lithium product portfolio and catalysts position the company to capitalize on expanding demand in these sectors despite recent financial challenges.
SWOT Analysis
This analysis highlights Albemarle Corporation’s key internal and external factors shaping its strategic outlook.
Strengths
- Leading lithium producer
- Diverse specialty chemicals portfolio
- Strong presence in EV battery market
Weaknesses
- Declining revenue trend
- Weak profitability metrics
- Limited ROIC data availability
Opportunities
- Growing electric vehicle demand
- Expansion in sustainable materials
- Innovation in battery technology
Threats
- Volatile raw material prices
- Intense industry competition
- Economic sensitivity in chemicals sector
Albemarle’s strengths in lithium and specialty chemicals position it well against rising EV demand. However, weak recent financials require cautious capital allocation. The company must leverage innovation while managing commodity risks to sustain growth.
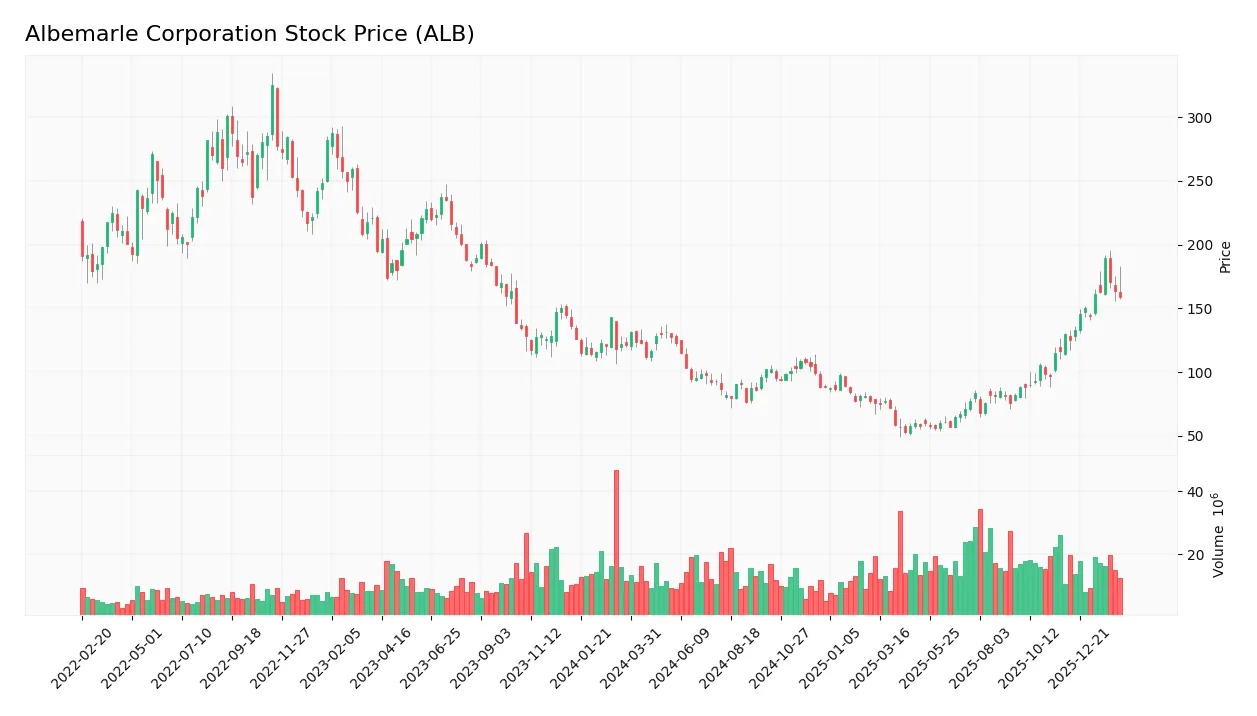
Stock Price Action Analysis
The weekly stock chart for Albemarle Corporation (ALB) over the past 12 months reveals significant price movement and volatility:
Trend Analysis
ALB’s stock price rose 31.5% over the past year, confirming a bullish trend with clear acceleration. The price ranged from a low of 52.91 to a high near 189.51. Volatility is elevated, with a standard deviation of 28.5, reflecting wide price swings.
Volume Analysis
Trading volume has increased, with total volume surpassing 1.85B shares. Recent activity shows slight buyer dominance at 57.44%, indicating growing investor interest. The volume trend suggests strengthening market participation and a bias toward accumulation.
Target Prices
Analysts show a bullish consensus on Albemarle Corporation with solid upside potential.
| Target Low | Target High | Consensus |
|---|---|---|
| 136 | 210 | 186.23 |
The target range suggests confidence in Albemarle’s growth prospects, with the consensus price indicating a significant premium over current levels.

Don’t Let Luck Decide Your Entry Point
Optimize your entry points with our advanced ProRealTime indicators. You’ll get efficient buy signals with precise price targets for maximum performance. Start outperforming now!
Analyst & Consumer Opinions
This section examines Albemarle Corporation’s analyst ratings alongside consumer feedback to provide balanced insight.
Stock Grades
Here are the latest verified analyst grades for Albemarle Corporation from established financial institutions:
| Grading Company | Action | New Grade | Date |
|---|---|---|---|
| Mizuho | Maintain | Neutral | 2026-02-12 |
| Jefferies | Maintain | Buy | 2026-01-28 |
| JP Morgan | Maintain | Neutral | 2026-01-28 |
| Wells Fargo | Maintain | Equal Weight | 2026-01-26 |
| Oppenheimer | Maintain | Outperform | 2026-01-21 |
| Citigroup | Maintain | Neutral | 2026-01-21 |
| Truist Securities | Upgrade | Buy | 2026-01-21 |
| Deutsche Bank | Upgrade | Buy | 2026-01-13 |
| Scotiabank | Upgrade | Sector Outperform | 2026-01-12 |
| UBS | Maintain | Buy | 2026-01-12 |
The grade trend shows a bias toward buy-oriented ratings, with multiple upgrades in January 2026. However, a significant portion of analysts maintain neutral or hold views, reflecting a balanced market outlook.
Consumer Opinions
Albemarle Corporation evokes a mix of admiration and critique from its consumer base, reflecting its complex footprint in specialty chemicals.
| Positive Reviews | Negative Reviews |
|---|---|
| High product quality and reliability | Pricing perceived as above average |
| Strong customer support and responsiveness | Delivery delays reported during peak demand |
| Innovative solutions in lithium production | Limited transparency on environmental impact |
Consumers consistently praise Albemarle’s innovation and customer service. However, concerns about pricing and supply chain efficiency suggest areas for operational improvement.
Risk Analysis
Below is a summary table outlining key risk categories, their descriptions, probabilities, and potential impacts on Albemarle Corporation:
| Category | Description | Probability | Impact |
|---|---|---|---|
| Financial Health | Weak profitability and negative ROE signal operational challenges. | High | High |
| Market Volatility | High beta (1.45) exposes the stock to amplified market swings. | High | Medium |
| Industry Demand | Lithium segment exposed to EV market fluctuations and regulatory shifts. | Medium | High |
| Liquidity | Current ratio above 3.0 suggests strong liquidity but quick ratio is borderline. | Low | Low |
| Debt Risk | Low debt and debt-to-assets ratio indicate low leverage risk. | Low | Low |
| Dividend Yield | Zero dividend yield may deter income-focused investors. | Medium | Low |
The most pressing risks are Albemarle’s unfavorable profitability and return on equity, which signal weak capital allocation and operational efficiency. Despite a strong Altman Z-score indicating no bankruptcy threat, the company’s stock suffers from high market volatility due to its 1.45 beta. Lithium demand fluctuations remain a critical factor, given its material impact on revenues. Investors should weigh these risks carefully against the company’s low leverage and solid liquidity profile.
Should You Buy Albemarle Corporation?
Albemarle Corporation appears to have a challenging profitability profile with declining returns on invested capital and operational efficiency. While its leverage profile seems manageable, the competitive moat is unclear. The overall rating stands at C-, suggesting cautious analytical interpretation.
Strength & Efficiency Pillars
Albemarle Corporation operates within a safe financial zone, supported by an Altman Z-Score of 67.01. However, profitability metrics reveal significant challenges with a net margin of 0% and a negative return on equity of -110.73%. Return on invested capital (ROIC) data is unavailable, preventing a clear assessment of value creation over its weighted average cost of capital (WACC). Despite these operational shortcomings, the company maintains a favorable debt-to-equity ratio and a strong quick ratio at 1.54, indicating some liquidity strength.
Weaknesses and Drawbacks
The company’s financial profile is burdened by critical weaknesses. Its gross margin, EBIT margin, and net margin all register as unfavorable at 0%, signaling operational inefficiency. The revenue has plunged by 100% over the last year, reflecting severe top-line contraction. While the current ratio is elevated at 3.16, it is flagged as unfavorable, suggesting possible inefficiencies in working capital management. The overall valuation metrics, including P/E and P/B, are favorable but may reflect market uncertainty given the unfavorable earnings growth and operational metrics.
Our Final Verdict about Albemarle Corporation
Despite Albemarle’s safe-zone solvency status, its operational and profitability metrics are deeply concerning. The bullish stock trend and recent buyer dominance offer some optimism. However, the firm’s persistent revenue decline and zero profitability suggest that the company might appear speculative and warrants a cautious, wait-and-see stance before considering long-term exposure.
Disclaimer: This content is for informational purposes only and does not constitute financial, investment, or other professional advice. Investing in financial markets involves a significant risk of loss, and past performance is not indicative of future results.
Additional Resources
- Albemarle Reports Fourth Quarter and Full Year 2025 Results – PR Newswire (Feb 11, 2026)
- Albemarle Corp (ALB) Q4 2025 Earnings Call Highlights: Strong Sales Growth Amidst Challenges – GuruFocus (Feb 12, 2026)
- JPMorgan Lifts Albemarle Corporation (NYSE:ALB) Price Target as Lithium Sentiment Turns – Yahoo Finance (Feb 09, 2026)
- Is Albemarle Setting Up for a Lithium-Fueled Rebound? – MarketBeat (Feb 12, 2026)
- Oppenheimer raises Albemarle stock price target to $216 on lithium outlook – Investing.com (Feb 12, 2026)
For more information about Albemarle Corporation, please visit the official website: albemarle.com