Home > Analyses > Technology > Akamai Technologies, Inc.
Akamai Technologies shapes the digital world by powering secure, fast, and reliable internet experiences for millions. It dominates cloud services that protect and accelerate content delivery, redefining how businesses and consumers interact online. Known for innovation in cybersecurity and edge computing, Akamai sets industry standards in performance and protection. As the internet evolves, I question whether Akamai’s fundamentals can sustain its growth and justify its current valuation in this competitive landscape.

Table of contents
Business Model & Company Overview
Akamai Technologies, Inc., founded in 1998 and headquartered in Cambridge, Massachusetts, stands as a leader in the Software – Infrastructure industry. It operates a cohesive ecosystem that secures, delivers, and optimizes online content and applications globally. Its platform protects websites, APIs, and users from cyber threats while enhancing performance across digital channels.
The company’s revenue engine balances cloud security, content delivery, and edge computing services. Akamai drives value through a mix of hardware-accelerated and recurring cloud solutions, serving customers in the Americas, Europe, and Asia. Its competitive advantage lies in a robust global network and deep integration, shaping the future of digital infrastructure with a durable economic moat.
Financial Performance & Fundamental Metrics
I will analyze Akamai Technologies, Inc.’s income statement, key financial ratios, and dividend payout policy to assess its fundamental strength and investment quality.
Income Statement
The table below summarizes Akamai Technologies, Inc.’s key income statement items for fiscal years 2021 through 2025, providing a clear view of revenue growth and profitability trends.

| 2021 | 2022 | 2023 | 2024 | 2025 | |
|---|---|---|---|---|---|
| Revenue | 3.46B | 3.62B | 3.81B | 3.99B | 4.21B |
| Cost of Revenue | 1.27B | 1.38B | 1.51B | 1.62B | 1.73B |
| Operating Expenses | 1.41B | 1.56B | 1.66B | 1.84B | 1.74B |
| Gross Profit | 2.19B | 2.23B | 2.30B | 2.37B | 2.48B |
| EBITDA | 1.35B | 1.26B | 1.24B | 1.26B | 1.33B |
| EBIT | 801M | 669M | 670M | 614M | 625M |
| Interest Expense | 72M | 11M | 18M | 27M | 31M |
| Net Income | 652M | 524M | 548M | 505M | 452M |
| EPS | 4.01 | 3.29 | 3.59 | 3.34 | 3.11 |
| Filing Date | 2022-02-28 | 2023-02-28 | 2023-12-31 | 2025-02-24 | 2026-02-20 |
Income Statement Evolution
From 2021 to 2025, Akamai Technologies’ revenue grew 21.6%, reflecting steady expansion. Gross margins remained stable near 59%, supporting solid profitability. However, net income declined 30.6%, driven by margin compression. Operating expenses rose in line with revenue, preserving operating income margins around 15%. The latest year showed revenue growth slowing to 5.4%, with net margins contracting notably.
Is the Income Statement Favorable?
In 2025, Akamai reported $4.21B revenue and $452M net income, yielding a 10.7% net margin. Operating income margin was favorable at 14.9%, while interest expense remained low at 0.7% of revenue. Despite revenue growth, net income and EPS fell over 6%, indicating margin pressure. Overall, fundamentals show resilience but reveal challenges sustaining bottom-line growth amid rising costs.
Financial Ratios
The table below summarizes key financial ratios for Akamai Technologies, Inc. over the last five fiscal years:
| Ratios | 2021 | 2022 | 2023 | 2024 | 2025 |
|---|---|---|---|---|---|
| Net Margin | 19% | 14% | 14% | 13% | 11% |
| ROE | 14% | 12% | 12% | 10% | 9% |
| ROIC | 9% | 7% | 6% | 5% | 4% |
| P/E | 29.2 | 25.6 | 33.0 | 28.7 | 28.1 |
| P/B | 4.20 | 3.08 | 3.93 | 2.97 | 2.55 |
| Current Ratio | 2.43 | 2.41 | 2.16 | 1.23 | 2.36 |
| Quick Ratio | 2.43 | 2.41 | 2.16 | 1.23 | 2.36 |
| D/E | 0.63 | 0.73 | 0.99 | 0.95 | 1.39 |
| Debt-to-Assets | 35% | 38% | 46% | 45% | 60% |
| Interest Coverage | 10.8 | 61.0 | 36.0 | 19.7 | 20.3 |
| Asset Turnover | 0.43 | 0.44 | 0.39 | 0.38 | 0.37 |
| Fixed Asset Turnover | 1.39 | 1.54 | 1.39 | 1.33 | 1.11 |
| Dividend Yield | 0% | 0% | 0% | 0% | 0% |
Evolution of Financial Ratios
Akamai’s Return on Equity (ROE) declined from 14.38% in 2021 to 9.08% in 2025, signaling reduced profitability. The Current Ratio improved notably, rising from 2.43 in 2021 to 2.36 in 2025, indicating stronger liquidity. However, the Debt-to-Equity Ratio increased from 0.63 to 1.39, reflecting heavier leverage and higher financial risk over this period.
Are the Financial Ratios Favorable?
In 2025, Akamai shows favorable liquidity with a Current Ratio of 2.36 and strong Interest Coverage of 20.32, suggesting solid short-term financial health and debt servicing ability. Profitability metrics like Net Margin (10.74%) are favorable, though ROE (9.08%) and ROIC (4.32%) lag behind the cost of capital (WACC 5.72%), indicating constraints on value creation. Leverage ratios remain unfavorable, with Debt-to-Equity at 1.39 and Debt-to-Assets at 60.18%. Overall, the ratio profile is slightly unfavorable.
Shareholder Return Policy
Akamai Technologies, Inc. does not pay dividends, reflecting a strategy focused on reinvestment and growth rather than immediate shareholder payouts. The company’s free cash flow supports potential share buybacks, although no specific buyback program is indicated.
This approach aligns with Akamai’s emphasis on capital allocation toward innovation and expansion. While the lack of dividends limits direct income, the focus on sustainable long-term value creation appears consistent with its financial profile and market positioning.
Score analysis
The following radar chart illustrates key financial scores evaluating Akamai Technologies, Inc.’s valuation and profitability metrics:

The company scores very favorably on discounted cash flow (5), indicating solid intrinsic value. Return on equity and assets both show moderate profitability (3 each). However, debt-to-equity is very unfavorable (1), signaling high leverage risk. Price multiples reflect moderate to unfavorable valuations with P/E at 2 and P/B at 3.
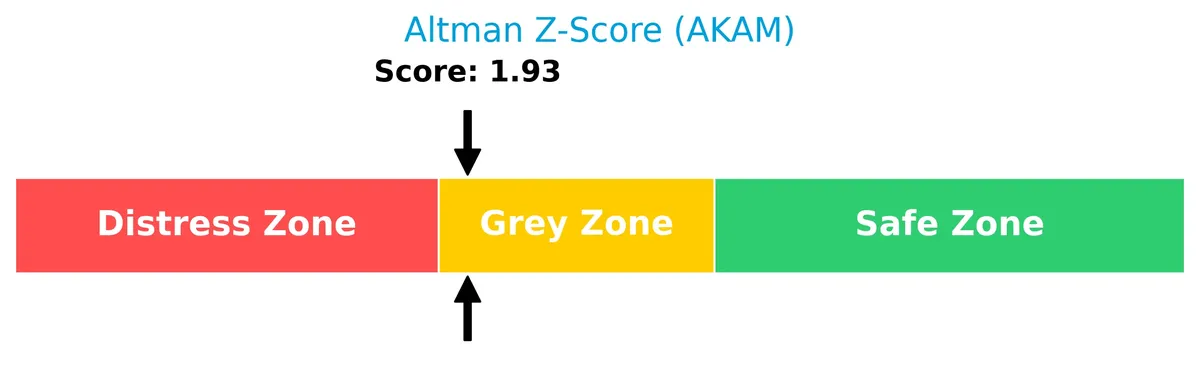
Analysis of the company’s bankruptcy risk
Akamai’s Altman Z-Score places it in the grey zone, indicating a moderate risk of bankruptcy but no immediate distress:
Is the company in good financial health?
This Piotroski diagram depicts Akamai’s financial strength based on profitability, leverage, and efficiency criteria:
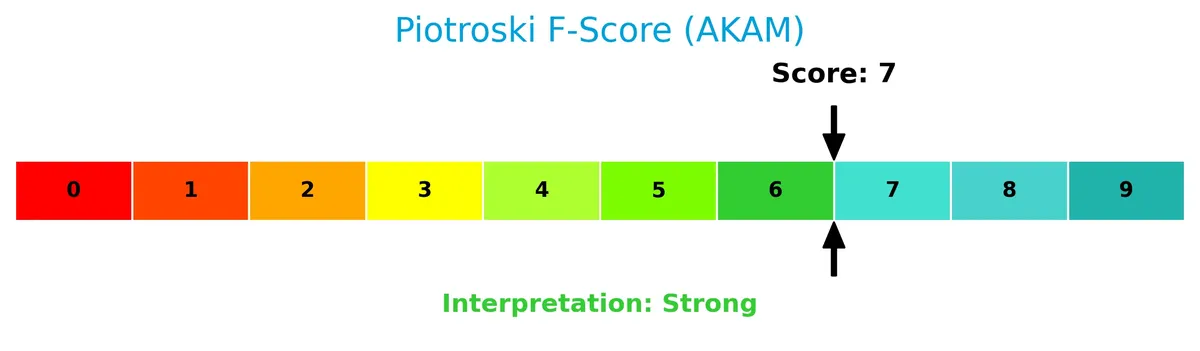
With a Piotroski score of 7, Akamai demonstrates strong financial health. This score suggests robust fundamentals, although not at the very strongest level, supporting a generally solid financial position.
Competitive Landscape & Sector Positioning
This sector analysis will explore Akamai Technologies’ strategic positioning, revenue segments, key products, and main competitors. I will assess whether Akamai holds a competitive advantage over its peers in the software infrastructure industry.
Strategic Positioning
Akamai Technologies concentrates its product portfolio in cloud-based security, content delivery, and edge computing solutions. Geographically, it balances revenue evenly between the US (2.14B in 2025) and international markets (2.07B in 2025), reflecting a diversified global presence.
Revenue by Segment
The pie chart illustrates Akamai Technologies’ revenue distribution for the reportable segment over the fiscal years 2024 and 2025.
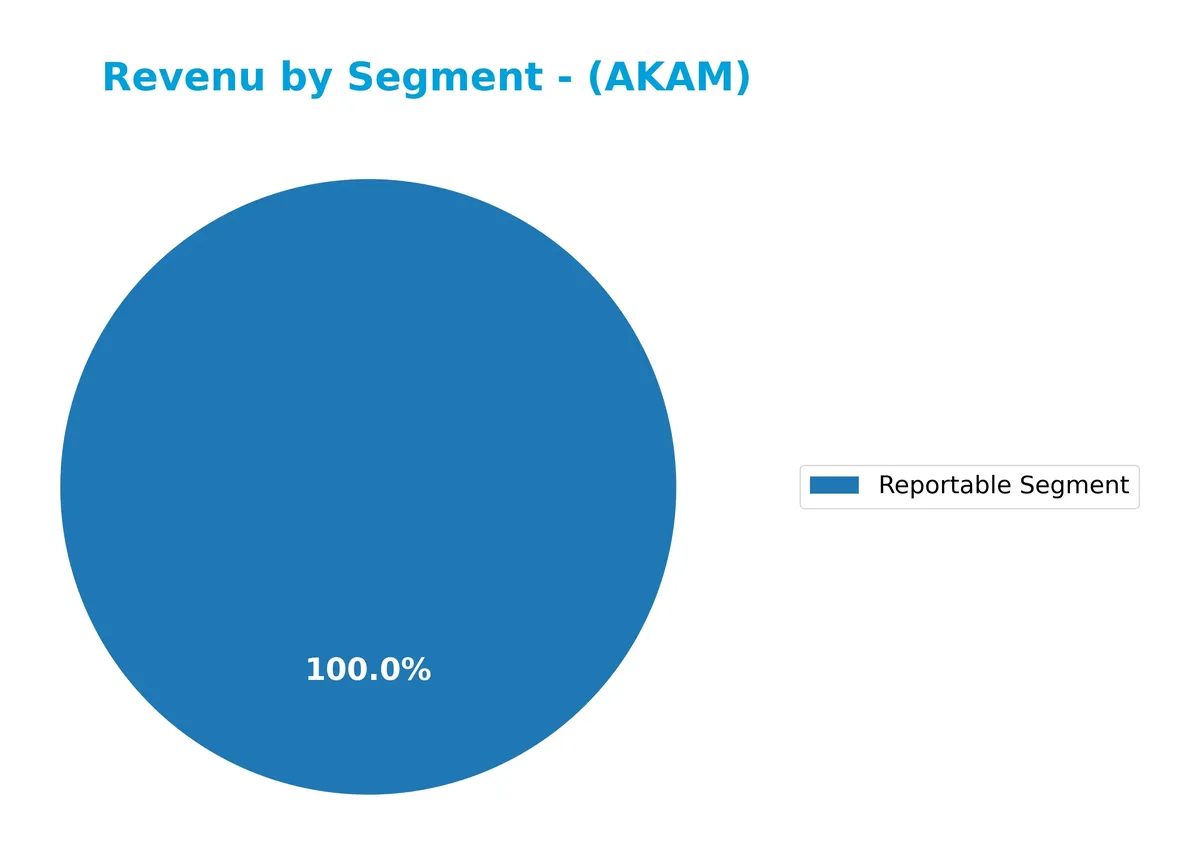
Akamai’s revenue from its reportable segment increased from 3.99B in 2024 to 4.21B in 2025. This steady growth signals a solid core business driving overall performance. The concentration on a single reportable segment suggests focus but also a potential risk if diversification remains limited. The recent acceleration in revenue underscores effective market positioning in a competitive technology landscape.
Key Products & Brands
Akamai Technologies offers a diverse range of cloud and security solutions for internet content and applications:
| Product | Description |
|---|---|
| Cloud Security Solutions | Protects infrastructure, websites, APIs, and users from cyberattacks and online threats. |
| Web and Mobile Performance | Optimizes dynamic websites and applications for faster, reliable user experiences. |
| Media Delivery Solutions | Supports video streaming, game/software delivery, and broadcast operations. |
| Edge Compute Solutions | Enables developers to deploy and distribute code at the network edge for low latency. |
| Carrier Offerings | Provides cybersecurity, parental controls, DNS infrastructure, and content delivery services. |
| Service and Support | Assists customers in integrating, configuring, optimizing, and managing Akamai’s solutions. |
Akamai’s portfolio centers on cloud infrastructure and cybersecurity, emphasizing performance and protection for digital content delivery.
Main Competitors
Akamai Technologies, Inc. competes in a field of 32 companies; below is the top 10 ranked by market capitalization:
| Competitor | Market Cap. |
|---|---|
| Microsoft Corporation | 3.52T |
| Oracle Corporation | 553B |
| Palantir Technologies Inc. | 383B |
| Adobe Inc. | 140B |
| Palo Alto Networks, Inc. | 120B |
| CrowdStrike Holdings, Inc. | 113B |
| Synopsys, Inc. | 92B |
| Cloudflare, Inc. | 69B |
| Fortinet, Inc. | 59B |
| Block, Inc. | 40B |
Akamai ranks 23rd among 32 competitors in the Software – Infrastructure sector. Its market cap is just 0.39% of Microsoft’s, the leader. Akamai sits below both the average market cap of the top 10 (508B) and the sector median (18.8B). The company is 2.37% smaller than the next competitor above, indicating a narrow gap to close for upward momentum.
Comparisons with competitors
Check out how we compare the company to its competitors:
Does AKAM have a competitive advantage?
Akamai Technologies does not currently present a competitive advantage, as its return on invested capital (ROIC) falls below its cost of capital (WACC) by 1.4%, indicating value destruction. The company’s ROIC has declined by over 53% from 2021 to 2025, signaling weakening profitability and an unfavorable moat position.
Looking ahead, Akamai plans to expand its cloud services portfolio, including edge compute and cybersecurity solutions, targeting both U.S. and international markets. These efforts could unlock future growth opportunities, although the company must address its profitability challenges to sustain competitive strength.
SWOT Analysis
This SWOT analysis highlights Akamai Technologies’ key internal and external factors shaping its market position and future prospects.
Strengths
- strong cloud security portfolio
- favorable net margin of 10.7%
- robust current and quick ratios at 2.36
Weaknesses
- declining ROIC well below WACC
- unfavorable net income and EPS trends
- high debt-to-assets ratio at 60%
Opportunities
- growing demand for edge computing
- international revenue expansion
- increasing cybersecurity threats driving need for solutions
Threats
- intense competition in software infrastructure
- technology obsolescence risk
- macroeconomic uncertainty affecting IT budgets
Akamai’s strengths in cloud security and liquidity provide a solid base. However, value destruction from declining ROIC and high leverage signals caution. Strategic focus must emphasize innovation and debt management to capitalize on edge computing growth while mitigating competitive and economic risks.
Stock Price Action Analysis
The weekly chart below illustrates Akamai Technologies, Inc.’s stock price movement over the past 100 weeks, highlighting key fluctuations and trend shifts:
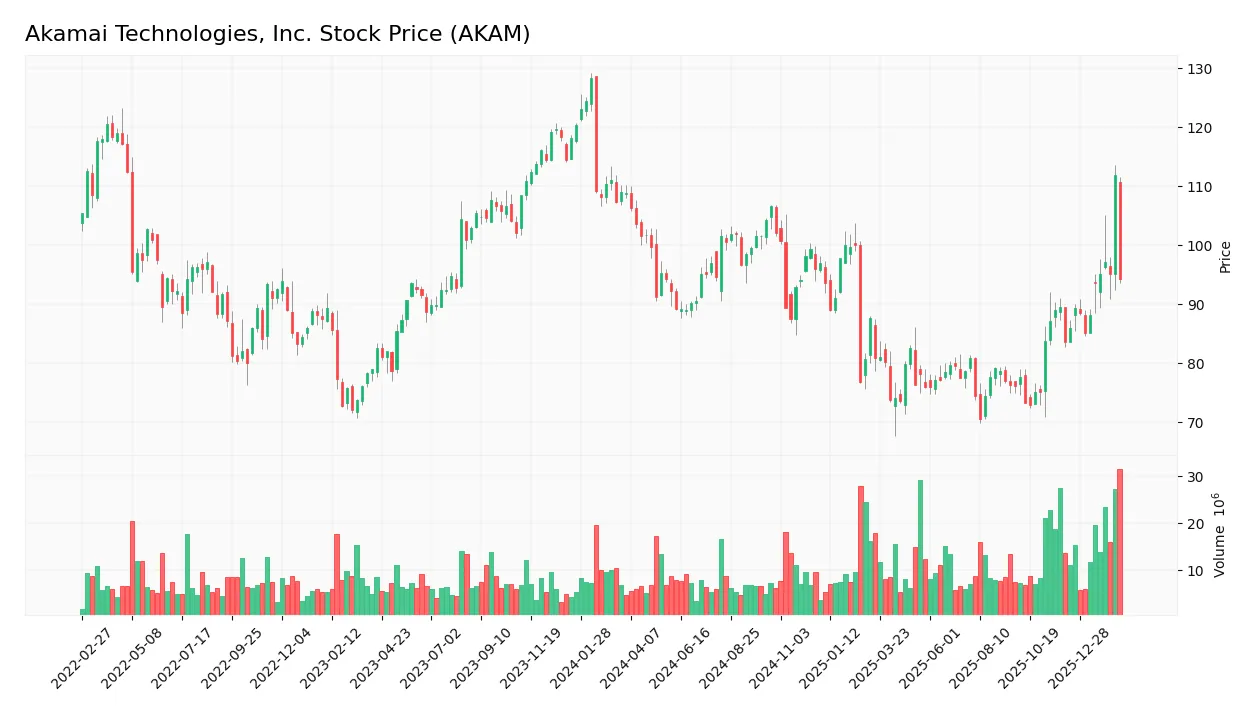
Trend Analysis
Over the past 12 months, AKAM’s stock price declined by 13.41%, signaling a bearish trend with accelerating downward momentum. The price ranged from a high of 111.76 to a low of 70.53, with volatility measured by a standard deviation of 10.29, indicating significant price swings during this period.
Volume Analysis
Trading volume for AKAM has increased, totaling 1.23B shares with buyers accounting for 57.1%. In the recent three-month span, buyer dominance strengthened to 62.77%, reflecting growing positive investor engagement and suggesting buyer-driven market participation.
Target Prices
Analysts set a confident target consensus for Akamai Technologies, reflecting optimistic growth expectations.
| Target Low | Target High | Consensus |
|---|---|---|
| 89 | 120 | 113.22 |
The range between 89 and 120 shows some variance in risk appetite, but the 113.22 consensus confirms a bullish outlook.

Don’t Let Luck Decide Your Entry Point
Optimize your entry points with our advanced ProRealTime indicators. You’ll get efficient buy signals with precise price targets for maximum performance. Start outperforming now!
Analyst & Consumer Opinions
I will examine the latest analyst ratings and consumer feedback to provide a balanced view of Akamai Technologies, Inc.
Stock Grades
The following table presents the latest verified stock grades for Akamai Technologies, Inc., reflecting analysts’ current views and actions:
| Grading Company | Action | New Grade | Date |
|---|---|---|---|
| Scotiabank | Maintain | Sector Outperform | 2026-02-20 |
| Evercore ISI Group | Maintain | Outperform | 2026-02-20 |
| Susquehanna | Maintain | Positive | 2026-02-20 |
| Baird | Maintain | Outperform | 2026-02-20 |
| Keybanc | Maintain | Overweight | 2026-02-20 |
| TD Cowen | Maintain | Hold | 2026-02-20 |
| RBC Capital | Maintain | Sector Perform | 2026-02-20 |
| UBS | Maintain | Neutral | 2026-02-20 |
| DA Davidson | Maintain | Buy | 2026-02-13 |
| Citigroup | Maintain | Neutral | 2026-01-16 |
Most analysts maintain a positive stance, with several favoring Outperform or equivalent grades, while a roughly equal number remain neutral or hold. The consensus currently leans toward Hold, reflecting balanced investor sentiment.
Consumer Opinions
Consumer sentiment around Akamai Technologies, Inc. reveals a blend of admiration for its robust service and frustration over occasional technical issues.
| Positive Reviews | Negative Reviews |
|---|---|
| Reliable and fast content delivery | Customer support can be slow to respond |
| Strong security features enhance trust | Pricing is perceived as high by some users |
| Scales well for large enterprises | Occasional service interruptions reported |
Overall, consumers praise Akamai’s performance and security, essential for enterprise clients. However, support responsiveness and pricing remain common pain points, signaling areas for improvement.
Risk Analysis
Below is a summary table highlighting key risks facing Akamai Technologies, Inc. in 2026:
| Category | Description | Probability | Impact |
|---|---|---|---|
| Financial Leverage | High debt-to-equity ratio (1.39) and debt-to-assets (60.18%) | Medium | High |
| Profitability | ROIC (4.32%) below WACC (5.72%), signaling weak capital returns | Medium | Medium |
| Market Volatility | Beta of 0.723 suggests moderate sensitivity to market swings | Low | Medium |
| Valuation Risk | Elevated P/E of 28.07 compared to industry average | Medium | Medium |
| Dividend Policy | No dividend yield, potentially deterring income-focused investors | High | Low |
| Bankruptcy Risk | Altman Z-Score of 1.93 in the grey zone | Low | High |
The most concerning risks are Akamai’s substantial leverage and its ROIC falling short of WACC, which erodes shareholder value. The grey-zone Altman Z-Score warns of moderate financial distress risk, warranting close monitoring. Despite these, a strong Piotroski Score (7) signals solid operational fundamentals, partially offsetting these risks.
Should You Buy Akamai Technologies, Inc.?
Akamai appears to be a company with moderate profitability yet a deteriorating competitive moat, suggesting value destruction. Despite a challenging leverage profile and mixed financial strength indicators, its overall rating could be seen as cautiously favorable.
Strength & Efficiency Pillars
Akamai Technologies, Inc. maintains solid operational margins with a gross margin of 58.95% and an EBIT margin of 14.85%, reflecting effective cost control. The net margin stands at a favorable 10.74%, underscoring profitability resilience. However, the return on invested capital (ROIC) at 4.32% falls short of the weighted average cost of capital (WACC) at 5.72%, signaling value erosion rather than creation. Despite moderate returns on equity (9.08%), operational efficiency remains a bright spot amid broader challenges.
Weaknesses and Drawbacks
The company resides in the Altman Z-Score grey zone at 1.93, signaling moderate bankruptcy risk and caution. Leverage is elevated, with a debt-to-equity ratio of 1.39 and debt-to-assets at 60.18%, raising solvency concerns. Valuation metrics are stretched; the price-to-earnings ratio of 28.07 indicates a premium that may not be justified by earnings growth. Additionally, asset turnover is weak at 0.37, and the absence of a dividend yield limits income appeal, all of which introduce meaningful headwinds.
Our Final Verdict about Akamai Technologies, Inc.
Akamai’s profile is mixed. Although operational margins and liquidity ratios are favorable, the company’s grey zone Altman Z-Score and high leverage inject material solvency risk. Coupled with a bearish long-term stock trend and recent bullish buyer dominance, the outlook suggests caution. Despite some financial strength, this stock might appear too risky for conservative capital and may warrant a wait-and-see approach for timing an entry.
Disclaimer: This content is for informational purposes only and does not constitute financial, investment, or other professional advice. Investing in financial markets involves a significant risk of loss, and past performance is not indicative of future results.
Additional Resources
- Decoding Akamai Technologies Inc (AKAM): A Strategic SWOT Insigh – GuruFocus (Feb 21, 2026)
- Akamai crashes as investors fret over weak guidance (AKAM:NASDAQ) – Seeking Alpha (Feb 19, 2026)
- Why Akamai Technologies (AKAM) Shares Are Sliding Today – Finviz (Feb 20, 2026)
- Akamai Technologies’s (NASDAQ:AKAM) Q4 CY2025 Sales Beat Estimates But Stock Drops – Yahoo Finance (Feb 19, 2026)
- Akamai Technologies: Q4 Earnings Snapshot – kare11.com (Feb 19, 2026)
For more information about Akamai Technologies, Inc., please visit the official website: akamai.com