Home > Analyses > Basic Materials > Air Products and Chemicals, Inc.
Air Products and Chemicals, Inc. powers industries and innovations by delivering essential gases that fuel everything from manufacturing to clean energy solutions. As a pioneer in specialty and atmospheric gases, its cutting-edge technologies and global reach have cemented its leadership in the chemicals sector. With a strong reputation for quality and strategic partnerships, the company stands at a crossroads—does its robust foundation still support ambitious growth, or are investors facing new challenges ahead?

Table of contents
Business Model & Company Overview
Air Products and Chemicals, Inc., established in 1940 and headquartered in Allentown, Pennsylvania, stands as a dominant player in the specialty chemicals industry. The company operates a cohesive ecosystem delivering atmospheric, process, and specialty gases alongside advanced equipment for gas production and processing. Its integrated solutions serve diverse sectors, including refining, manufacturing, electronics, and energy, underpinning its core mission to advance industrial gas applications globally.
The company’s revenue engine balances hardware, such as air separation units and gas processing equipment, with recurring sales of atmospheric and specialty gases like oxygen, hydrogen, and helium. Air Products extends its footprint across the Americas, Europe, and Asia, leveraging strategic collaborations like the one with Baker Hughes for hydrogen compression systems. This global reach and diversified portfolio form a robust economic moat, positioning Air Products as a key architect of the industrial gas landscape’s future.
Financial Performance & Fundamental Metrics
I will analyze Air Products and Chemicals, Inc.’s income statement, key financial ratios, and dividend payout policy to assess its overall financial health and investment potential.
Income Statement
The table below summarizes the key income statement figures for Air Products and Chemicals, Inc. (APD) over the last five fiscal years, expressed in USD.
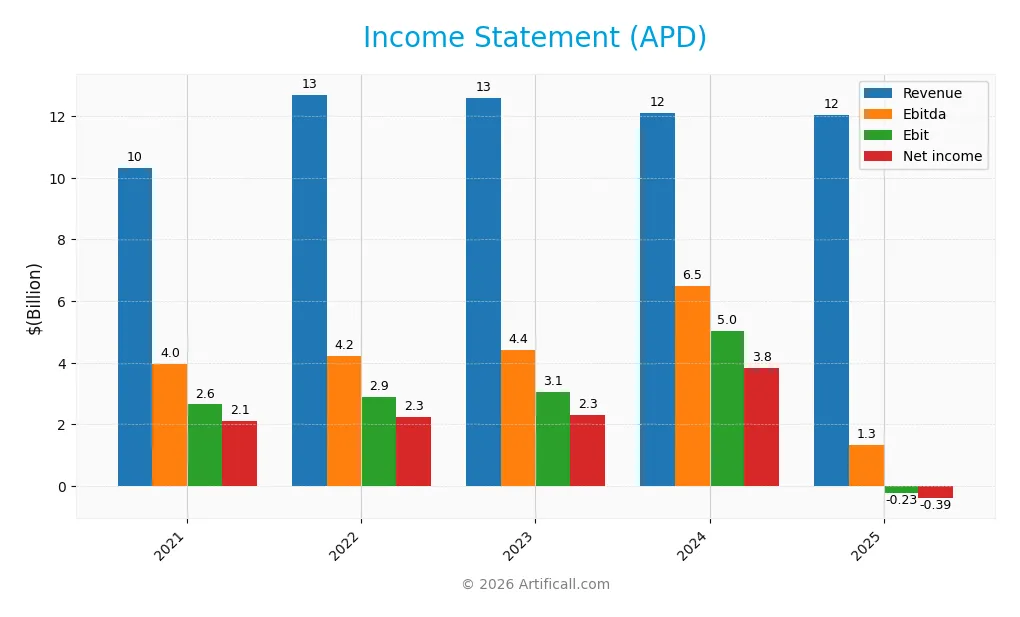
| 2021 | 2022 | 2023 | 2024 | 2025 | |
|---|---|---|---|---|---|
| Revenue | 10.32B | 12.70B | 12.60B | 12.10B | 12.04B |
| Cost of Revenue | 7.19B | 9.34B | 8.83B | 8.17B | 8.26B |
| Operating Expenses | 869M | 1.02B | 1.27B | -534M | 4.66B |
| Gross Profit | 3.14B | 3.36B | 3.77B | 3.93B | 3.78B |
| EBITDA | 3.97B | 4.22B | 4.42B | 6.49B | 1.34B |
| EBIT | 2.65B | 2.88B | 3.06B | 5.04B | -227M |
| Interest Expense | 142M | 128M | 178M | 219M | 214M |
| Net Income | 2.10B | 2.26B | 2.30B | 3.83B | -395M |
| EPS | 9.16 | 10.11 | 10.31 | 17.21 | -1.77 |
| Filing Date | 2021-11-18 | 2022-11-22 | 2023-11-16 | 2024-11-21 | 2025-11-20 |
Income Statement Evolution
From 2021 to 2025, Air Products and Chemicals, Inc. saw a 16.61% increase in revenue, reaching $12.0B in 2025, but net income declined sharply by 118.79%, turning negative to -$395M. Gross margin remained relatively stable and favorable at 31.41%, while EBIT and net margins deteriorated significantly, reflecting worsening profitability and operational challenges over the period.
Is the Income Statement Favorable?
The 2025 income statement reveals unfavorable fundamentals with a negative EBIT margin of -1.88% and a net margin of -3.28%. Revenue declined slightly by 0.52% from the previous year, while EBIT fell drastically by 104.5%. Despite a favorable gross margin and manageable interest expense, overall profitability metrics and earnings per share experienced substantial negative growth, resulting in an unfavorable global income statement evaluation.
Financial Ratios
The following table presents key financial ratios for Air Products and Chemicals, Inc. (APD) over the fiscal years 2021 to 2025, reflecting profitability, valuation, liquidity, leverage, and efficiency metrics:
| Ratios | 2021 | 2022 | 2023 | 2024 | 2025 |
|---|---|---|---|---|---|
| Net Margin | 20% | 18% | 18% | 32% | -3% |
| ROE | 16% | 17% | 16% | 22% | -3% |
| ROIC | 8% | 8% | 7% | 10% | -2% |
| P/E | 27.0 | 22.9 | 27.4 | 17.3 | -154.0 |
| P/B | 4.19 | 3.93 | 4.40 | 3.89 | 4.04 |
| Current Ratio | 3.0 | 1.8 | 1.3 | 1.5 | 1.4 |
| Quick Ratio | 2.8 | 1.7 | 1.2 | 1.3 | 1.2 |
| D/E | 0.61 | 0.63 | 0.77 | 0.88 | 1.23 |
| Debt-to-Assets | 31% | 31% | 34% | 38% | 45% |
| Interest Coverage | 16.1 | 18.3 | 14.1 | 20.4 | -4.1 |
| Asset Turnover | 0.38 | 0.47 | 0.39 | 0.31 | 0.29 |
| Fixed Asset Turnover | 0.75 | 0.85 | 0.68 | 0.50 | 0.46 |
| Dividend Yield | 2.2% | 2.7% | 2.4% | 2.4% | 2.6% |
Evolution of Financial Ratios
Over the period, Air Products and Chemicals, Inc. saw a decline in Return on Equity (ROE), turning negative at -2.63% in 2025 from positive levels above 15% in prior years. The Current Ratio decreased from a high of nearly 3.0 in 2021 to 1.38 in 2025, indicating reduced liquidity. The Debt-to-Equity Ratio increased notably to 1.23 in 2025, reflecting higher leverage and a shift toward greater debt usage.
Are the Financial Ratios Favorable?
In 2025, profitability ratios such as net margin (-3.28%), ROE (-2.63%), and return on invested capital (-1.83%) were unfavorable, signaling profit challenges. Liquidity ratios showed mixed signals with a neutral Current Ratio (1.38) but a favorable Quick Ratio (1.20). Leverage metrics, including a high debt-to-equity ratio (1.23) and negative interest coverage (-1.06), were unfavorable, while market valuation ratios showed a favorable Price-to-Earnings ratio but an unfavorable Price-to-Book ratio. Overall, 57% of key ratios were unfavorable, indicating financial stresses despite some positive aspects.
Shareholder Return Policy
Air Products and Chemicals, Inc. maintains a consistent dividend policy with a dividend yield around 2.6% in 2025, supported by a dividend payout ratio that turned negative due to net losses and free cash flow deficits. The company also engages in share buybacks, though coverage by free cash flow is currently weak.
This approach reflects challenges in profitability and cash flow, raising concerns about sustainability of distributions and buybacks. The policy’s alignment with long-term shareholder value is uncertain given ongoing losses and negative free cash flow, suggesting cautious monitoring is warranted.
Score analysis
The following radar chart illustrates key financial performance scores for Air Products and Chemicals, Inc.:
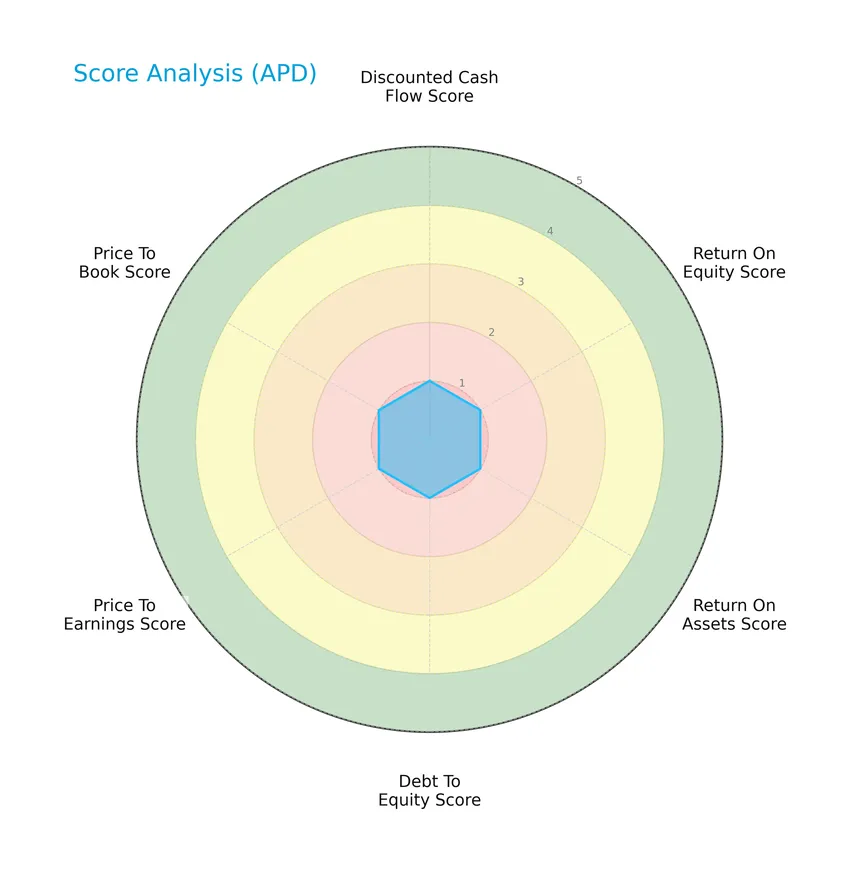
All evaluated metrics—including discounted cash flow, return on equity, return on assets, debt to equity, price to earnings, and price to book ratios—are rated very unfavorable with scores of 1 each, indicating significant weaknesses across these financial indicators.
Analysis of the company’s bankruptcy risk
The Altman Z-Score places the company in the grey zone, indicating a moderate risk of bankruptcy:

Is the company in good financial health?
Presented below is the Piotroski Score diagram reflecting the company’s financial strength:

With a Piotroski Score of 2, Air Products and Chemicals, Inc. is classified as very weak financially, suggesting limited financial strength according to this metric.
Competitive Landscape & Sector Positioning
This sector analysis will examine Air Products and Chemicals, Inc.’s strategic positioning, revenue by segment, key products, main competitors, competitive advantages, and SWOT analysis. I will assess whether the company maintains a competitive advantage over its industry peers.
Strategic Positioning
Air Products and Chemicals, Inc. maintains a diversified product portfolio focused on atmospheric, process, and specialty gases alongside equipment sales. Geographically, it has broad exposure with significant revenue from the Americas (5.1B), Asia (3.3B), and Europe (3B), reflecting a balanced global footprint in specialty chemicals.
Revenue by Segment
This pie chart presents Air Products and Chemicals, Inc.’s revenue distribution by segment for the fiscal year 2025, illustrating how different business areas contributed to the overall sales.
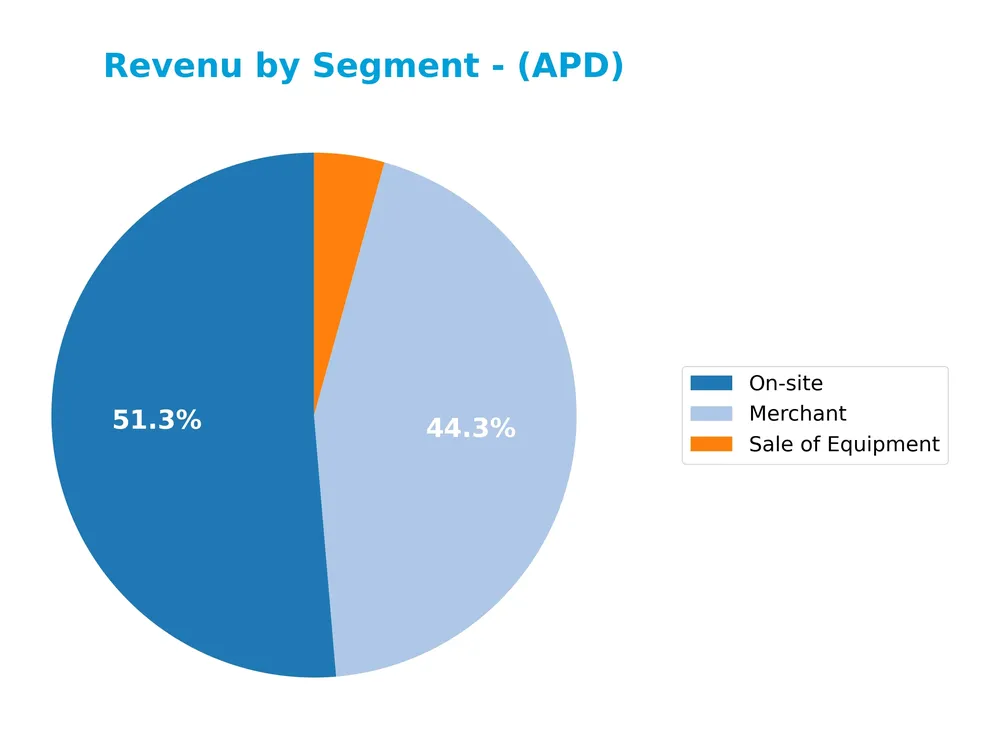
In 2025, the On-site segment led revenue generation with 6.18B, followed by Merchant at 5.34B, while Sale of Equipment contributed a smaller 520M. The On-site segment showed a steady increase from 5.89B in 2024, indicating growth in long-term customer contracts, whereas Merchant revenue remained relatively flat. Sale of Equipment declined notably from 878M in 2024, signaling a potential slowdown or strategic shift away from this area. Overall, the business remains concentrated in On-site and Merchant gases, with cautious observation needed on equipment sales.
Key Products & Brands
The table below presents Air Products and Chemicals, Inc.’s main products and brand categories with their descriptions:
| Product | Description |
|---|---|
| Atmospheric Gases | Includes oxygen, nitrogen, and argon supplied globally for various industrial applications. |
| Process Gases | Gases such as hydrogen, helium, carbon dioxide, carbon monoxide, and syngas used in refining, chemical, and energy sectors. |
| Specialty Gases | Specialized gases tailored for electronics, manufacturing, and medical imaging industries. |
| Merchant Gases | Gases sold in bulk to customers, supporting diverse industrial needs. |
| On-site Gases | Gases produced and delivered directly at customer facilities, often for continuous industrial processes. |
| Sale of Equipment | Equipment for gas production and processing, including air separation units, hydrocarbon recovery systems, and purification technology. |
Air Products and Chemicals, Inc. operates primarily in atmospheric, process, and specialty gases, alongside equipment sales, serving numerous industries worldwide. Merchant and on-site gas sales constitute significant revenue streams.
Main Competitors
There are 9 competitors in total, with the table below listing the top 10 leaders by market capitalization:
| Competitor | Market Cap. |
|---|---|
| Linde plc | 200.4B |
| The Sherwin-Williams Company | 81.5B |
| Ecolab Inc. | 74.5B |
| Air Products and Chemicals, Inc. | 55.8B |
| PPG Industries, Inc. | 23.4B |
| International Flavors & Fragrances Inc. | 17.4B |
| DuPont de Nemours, Inc. | 17.1B |
| Albemarle Corporation | 16.9B |
| LyondellBasell Industries N.V. | 14.3B |
Air Products and Chemicals, Inc. ranks 4th among its competitors with a market capitalization about 29.0% of the sector leader, Linde plc. The company is positioned above both the average market cap of the top 10 competitors (55.7B) and the sector median (23.4B). It holds a strong lead over the next competitor below, with a 27.98% market cap gap above.
Comparisons with competitors
Check out how we compare the company to its competitors:
Does APD have a competitive advantage?
Air Products and Chemicals, Inc. currently does not present a competitive advantage, as it shows a very unfavorable economic moat with a ROIC significantly below its WACC and a declining profitability trend. The company is shedding value, indicating inefficiencies in using invested capital and decreasing returns.
Looking ahead, APD has strategic collaborations in hydrogen compression systems and operates in multiple global markets including the Americas, Asia, and Europe, offering opportunities to expand its product portfolio and geographic reach. These developments could impact its future competitive positioning.
SWOT Analysis
This SWOT analysis highlights the key internal and external factors influencing Air Products and Chemicals, Inc.’s strategic position and investment potential.
Strengths
- Strong global presence with diversified geographic revenue
- Leading supplier of specialty and process gases
- Strategic collaboration on hydrogen compression systems
Weaknesses
- Negative net margin and declining profitability
- Unfavorable return on equity and asset turnover
- Weak financial health scores and declining ROIC
Opportunities
- Growing demand for clean energy and hydrogen solutions
- Expansion potential in Asia and Middle East markets
- Innovation in gas processing and purification equipment
Threats
- Intense competition in specialty chemicals sector
- Economic sensitivity impacting industrial demand
- Regulatory and environmental compliance costs
Overall, Air Products faces significant financial challenges that pressure profitability and value creation. However, leveraging its market leadership and growth in clean energy could help reverse current weaknesses. Cautious investment consideration is advised due to ongoing risks and financial instability.
Stock Price Action Analysis
The following weekly chart illustrates the price movements of Air Products and Chemicals, Inc. (APD) over the past 12 months, highlighting key fluctuations and trend patterns:
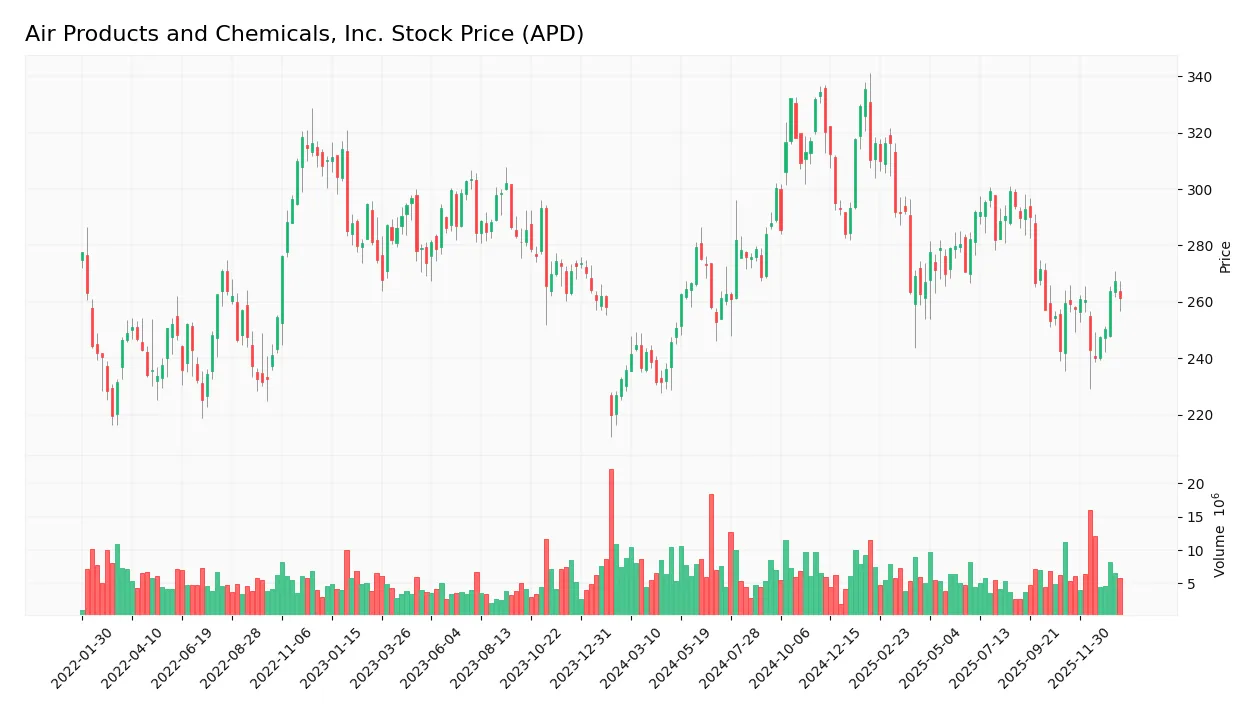
Trend Analysis
Over the past 12 months, APD’s stock price increased by 10.74%, indicating a bullish trend with acceleration. Price volatility is high, with a standard deviation of 25.88. The stock reached a high of 335.26 and a low of 231.53, confirming significant upward momentum.
Volume Analysis
In the last three months, trading volume has been decreasing, with seller volume exceeding buyer volume (56.95% seller dominance). This slightly seller-driven activity suggests cautious investor sentiment and reduced market participation despite the overall bullish price trend.
Target Prices
The current analyst consensus for Air Products and Chemicals, Inc. (APD) indicates a positive outlook with a solid range of target prices.
| Target High | Target Low | Consensus |
|---|---|---|
| 335 | 250 | 280 |
Analysts expect APD’s stock price to trade between $250 and $335, with a consensus target around $280, reflecting moderate upside potential.

Don’t Let Luck Decide Your Entry Point
Optimize your entry points with our advanced ProRealTime indicators. You’ll get efficient buy signals with precise price targets for maximum performance. Start outperforming now!
Analyst & Consumer Opinions
This section examines the latest analyst ratings and consumer feedback concerning Air Products and Chemicals, Inc. (APD).
Stock Grades
Here is a summary of recent stock grades for Air Products and Chemicals, Inc. from leading financial institutions:
| Grading Company | Action | New Grade | Date |
|---|---|---|---|
| Citigroup | Maintain | Neutral | 2026-01-21 |
| B of A Securities | Upgrade | Neutral | 2026-01-08 |
| Wells Fargo | Downgrade | Equal Weight | 2025-12-19 |
| Mizuho | Maintain | Outperform | 2025-12-18 |
| Citigroup | Downgrade | Neutral | 2025-12-15 |
| UBS | Downgrade | Neutral | 2025-12-12 |
| Argus Research | Maintain | Buy | 2025-12-11 |
| Evercore ISI Group | Maintain | Outperform | 2025-11-11 |
| Wells Fargo | Maintain | Overweight | 2025-11-07 |
| UBS | Maintain | Buy | 2025-11-07 |
The overall trend shows a shift toward more cautious ratings, with several downgrades from Buy or Overweight to Neutral or Equal Weight. However, some firms maintain Outperform and Buy ratings, reflecting a mixed but predominantly moderate outlook.
Consumer Opinions
Air Products and Chemicals, Inc. has garnered mixed consumer sentiment, reflecting both strong product quality and occasional service concerns.
| Positive Reviews | Negative Reviews |
|---|---|
| “Reliable and high-quality industrial gases.” | “Customer service response times can be slow.” |
| “Innovative solutions that improve efficiency.” | “Pricing is sometimes higher than competitors.” |
| “Strong commitment to safety and sustainability.” | “Delivery delays during peak demand periods.” |
Overall, consumers appreciate Air Products’ product reliability and innovation, but some express concerns about customer service responsiveness and pricing consistency.
Risk Analysis
The following table outlines key risks associated with investing in Air Products and Chemicals, Inc., highlighting their probability and potential impact:
| Category | Description | Probability | Impact |
|---|---|---|---|
| Financial Health | Negative net margin (-3.28%) and ROE (-2.63%) indicate ongoing profitability challenges. | High | High |
| Leverage & Debt | Debt-to-equity ratio of 1.23 and negative interest coverage (-1.06) raise solvency concerns. | Medium | High |
| Market Volatility | Stock price range between 229.11 and 341.14 with beta 0.879 suggests moderate market sensitivity. | Medium | Medium |
| Operational Risk | Low asset turnover (0.29) and fixed asset turnover (0.46) signal inefficiencies in asset usage. | High | Medium |
| Credit & Bankruptcy | Altman Z-Score of 2.43 places the company in the grey zone, indicating moderate bankruptcy risk. | Medium | High |
| Financial Strength | Very weak Piotroski Score of 2 reflects poor financial fundamentals and weak investment appeal. | High | Medium |
The most pressing risks for Air Products are its financial health and leverage issues, with negative margins and weak returns signaling operational stress. Its Altman Z-Score in the grey zone underscores a moderate bankruptcy risk, while the very weak Piotroski Score confirms fragile financial strength in 2026. Investors should monitor cash flow and debt management closely before investing.
Should You Buy Air Products and Chemicals, Inc.?
Air Products and Chemicals, Inc. appears to be experiencing declining profitability and a deteriorating competitive moat, suggesting value destruction and weakening operational efficiency. Despite a manageable debt profile, its overall rating stands at D+, reflecting a very unfavorable financial health profile.
Strength & Efficiency Pillars
Air Products and Chemicals, Inc. shows pockets of financial stability with a gross margin of 31.41% and a favorable weighted average cost of capital (WACC) at 6.83%. The company’s Altman Z-Score of 2.43 places it in the grey zone, indicating moderate financial risk but avoiding distress territory. However, key profitability metrics such as return on invested capital (ROIC) at -1.83% and return on equity (ROE) at -2.63% are negative, signaling operational inefficiencies and value erosion rather than creation. The weak Piotroski score of 2 further underlines fragile financial health.
Weaknesses and Drawbacks
APD’s valuation and leverage metrics raise concern. The price-to-book ratio stands at 4.04, reflecting a premium valuation despite unfavorable earnings performance. The debt-to-equity ratio of 1.23 signals elevated leverage, while interest coverage is negative at -1.06, highlighting difficulties in servicing debt. Recent seller dominance with buyers accounting for only 43.05% of volume adds short-term selling pressure. Additionally, net margin is negative at -3.28%, and earnings per share have declined sharply, signaling deteriorating profitability and earnings quality.
Our Verdict about Air Products and Chemicals, Inc.
The fundamental profile of APD appears unfavorable due to sustained value destruction and weak profitability metrics. Although the long-term stock trend remains bullish with a 10.74% price increase and accelerating momentum, recent market behavior shows slight seller dominance, suggesting caution. Despite some financial health signals, the current environment may warrant a wait-and-see approach before committing, as valuation and leverage risks persist.
Disclaimer: This content is for informational purposes only and does not constitute financial, investment, or other professional advice. Investing in financial markets involves a significant risk of loss, and past performance is not indicative of future results.
Additional Resources
- Air Products and Chemicals, Inc. (APD): A Bull Case Theory – Yahoo Finance (Jan 20, 2026)
- Citi Issues Upward Revision in Price Target for Air Products and Chemicals (APD) – Insider Monkey (Jan 23, 2026)
- Massachusetts Financial Services Co. MA Decreases Position in Air Products and Chemicals, Inc. $APD – MarketBeat (Jan 19, 2026)
- What 12 Analyst Ratings Have To Say About Air Products – Benzinga (Jan 21, 2026)
- Air Products and Yara in Advanced Negotiations to Partner on Low-emission Ammonia Projects – Air Products (Dec 08, 2025)
For more information about Air Products and Chemicals, Inc., please visit the official website: airproducts.com