Home > Analyses > Financial Services > Aflac Incorporated
Aflac Incorporated profoundly shapes how millions manage health risks with its supplemental insurance products. It dominates the life insurance sector through innovation and trusted coverage, especially in Japan and the U.S. Known for its strong brand and diverse product suite, Aflac consistently delivers stability and growth in a competitive market. As 2026 unfolds, I question whether Aflac’s robust fundamentals continue to support its current valuation and future expansion potential.

Table of contents
Business Model & Company Overview
Aflac Incorporated, founded in 1955 and headquartered in Columbus, Georgia, dominates the supplemental health and life insurance sector. It operates a cohesive ecosystem through two main segments: Aflac Japan and Aflac U.S. These segments offer a comprehensive suite of insurance products, including cancer, medical, and life insurance plans, designed to provide financial security across diverse markets. This dual-segment structure underscores Aflac’s strategic focus on tailored insurance solutions for individual and corporate clients alike.
The company’s revenue engine balances recurring premiums from supplemental insurance products with a broad distribution network comprising sales associates, brokers, and agencies across the Americas and Asia. This global footprint drives steady cash flow and market penetration in key regions. Aflac’s deep integration into insurance markets and diversified product mix create a robust economic moat, positioning it as a pivotal player shaping the future of supplemental insurance worldwide.
Financial Performance & Fundamental Metrics
I analyze Aflac Incorporated’s income statement, key financial ratios, and dividend payout policy to reveal its operational efficiency and shareholder value creation.
Income Statement
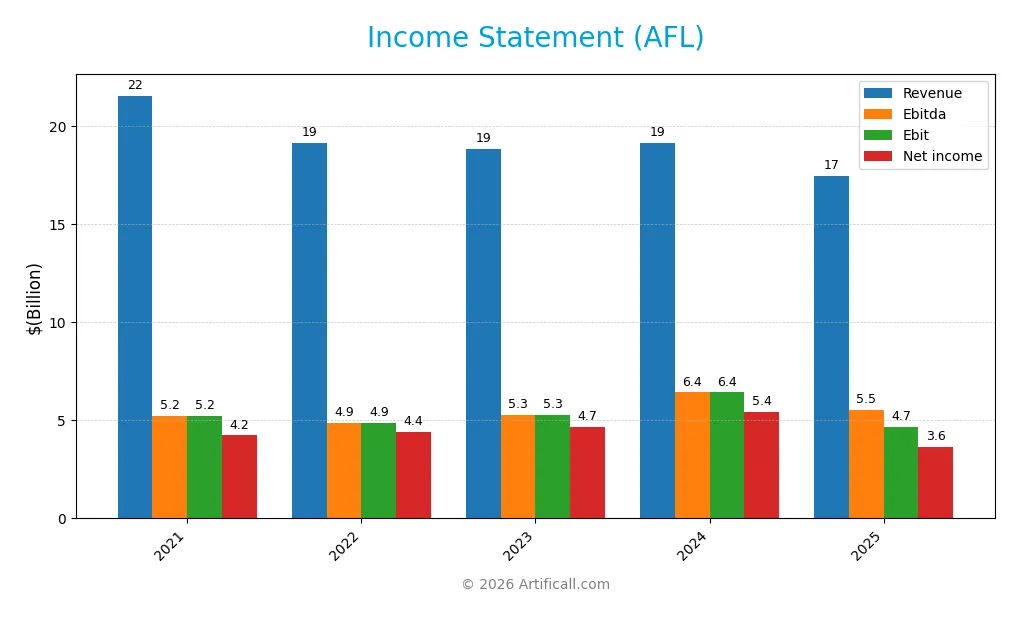
This table summarizes Aflac Incorporated’s key income statement figures for fiscal years 2021 through 2025, showing revenue, expenses, profits, and earnings per share.
| 2021 | 2022 | 2023 | 2024 | 2025 | |
|---|---|---|---|---|---|
| Revenue | 21.5B | 19.2B | 18.8B | 19.1B | 17.4B |
| Cost of Revenue | 0 | 0 | 0 | 12.3B | 10.7B |
| Operating Expenses | 16.3B | 14.3B | 13.6B | 398M | 2.1B |
| Gross Profit | 21.5B | 19.2B | 18.8B | 6.8B | 6.8B |
| EBITDA | 5.2B | 4.9B | 5.3B | 6.4B | 5.5B |
| EBIT | 5.2B | 4.9B | 5.3B | 6.4B | 4.7B |
| Interest Expense | 238M | 226M | 195M | 197M | 220M |
| Net Income | 4.2B | 4.4B | 4.7B | 5.4B | 3.6B |
| EPS | 6.42 | 6.96 | 7.81 | 9.68 | 6.86 |
| Filing Date | 2022-02-23 | 2023-02-24 | 2024-02-22 | 2025-02-26 | 2026-02-25 |
Income Statement Evolution
From 2021 to 2025, Aflac’s revenue declined 19%, with a sharp 8.8% drop in 2025 alone. Net income fell 14% over the period, driven by a 27.5% EBIT contraction in the last year. Despite this, net margin improved 6.5%, reaching nearly 21%, reflecting better cost control amid falling top-line figures.
Is the Income Statement Favorable?
The 2025 income statement shows mixed fundamentals. Revenue and net income both contracted significantly, signaling top-line pressure. However, gross margin near 39% and EBIT margin at 26.7% remain solid, while interest expense is low at 1.26% of revenue. The 21% net margin is favorable but masks weakening earnings growth, resulting in an overall unfavorable assessment.
Financial Ratios
The following table presents key financial ratios for Aflac Incorporated (AFL) over the past five fiscal years, highlighting profitability, valuation, liquidity, leverage, efficiency, and dividend metrics:
| Ratios | 2021 | 2022 | 2023 | 2024 | 2025 |
|---|---|---|---|---|---|
| Net Margin | 19.6% | 23.1% | 24.7% | 28.5% | 20.9% |
| ROE | 12.7% | 21.9% | 21.2% | 20.9% | 12.4% |
| ROIC | N/A | N/A | N/A | 0.0% | 3.2% |
| P/E | 9.3 | 10.3 | 10.6 | 10.6 | 16.0 |
| P/B | 1.18 | 2.27 | 2.24 | 2.21 | 1.98 |
| Current Ratio | 0.0 | 0.0 | 0.0 | 0.0 | 0.0 |
| Quick Ratio | 0.0 | 0.0 | 0.0 | 0.0 | 0.0 |
| D/E | 0.24 | 0.37 | 0.33 | 0.29 | 0.29 |
| Debt-to-Assets | 5.1% | 5.6% | 5.8% | 6.4% | 7.2% |
| Interest Coverage | 21.9 | 21.5 | 27.0 | 32.6 | 21.1 |
| Asset Turnover | 0.14 | 0.15 | 0.15 | 0.16 | 0.15 |
| Fixed Asset Turnover | 40.0 | 36.1 | 42.3 | 49.4 | 49.7 |
| Dividend Yield | 2.17% | 2.14% | 1.96% | 1.88% | 6.54% |
Note: Current and quick ratios are reported as zero, indicating missing or unavailable data rather than a liquidity concern. ROIC is not consistently reported; 2024 shows zero, while 2025 reports 3.2%.
Evolution of Financial Ratios
From 2021 to 2025, Aflac’s Return on Equity (ROE) showed fluctuation, peaking around 21% in 2023-2024 then declining to 12.36% in 2025. The Current Ratio remained at zero throughout, indicating no available data or liquidity concerns. Debt-to-Equity ratios slightly decreased from 0.33 in 2023 to 0.29 in 2025, reflecting stable leverage with modest improvements in profitability margins over the period.
Are the Financial Ratios Favorable?
In 2025, Aflac’s net profit margin of 20.91% is favorable, but ROE at 12.36% is neutral, showing moderate shareholder returns. The low asset turnover (0.15) and zero current ratio signal efficiency and liquidity weaknesses. Favorable debt metrics, including a Debt-to-Equity of 0.29 and strong interest coverage of 21.14, indicate conservative leverage. Overall, the ratios present a slightly favorable financial position with clear areas for improvement.
Shareholder Return Policy
Aflac maintains a consistent dividend policy with a payout ratio slightly above 100% in 2025, supported by a robust 6.5% annual yield. The dividend per share has grown steadily over recent years, and share buybacks complement distributions, funded by strong free cash flow coverage.
While the high payout ratio poses a risk of unsustainable distribution, free cash flow coverage near 1.0 mitigates this concern. The combined approach of dividends and buybacks aligns with sustaining long-term shareholder value, provided profitability and cash flow remain stable.
Score analysis
The following radar chart presents a clear view of Aflac Incorporated’s key financial metric scores:
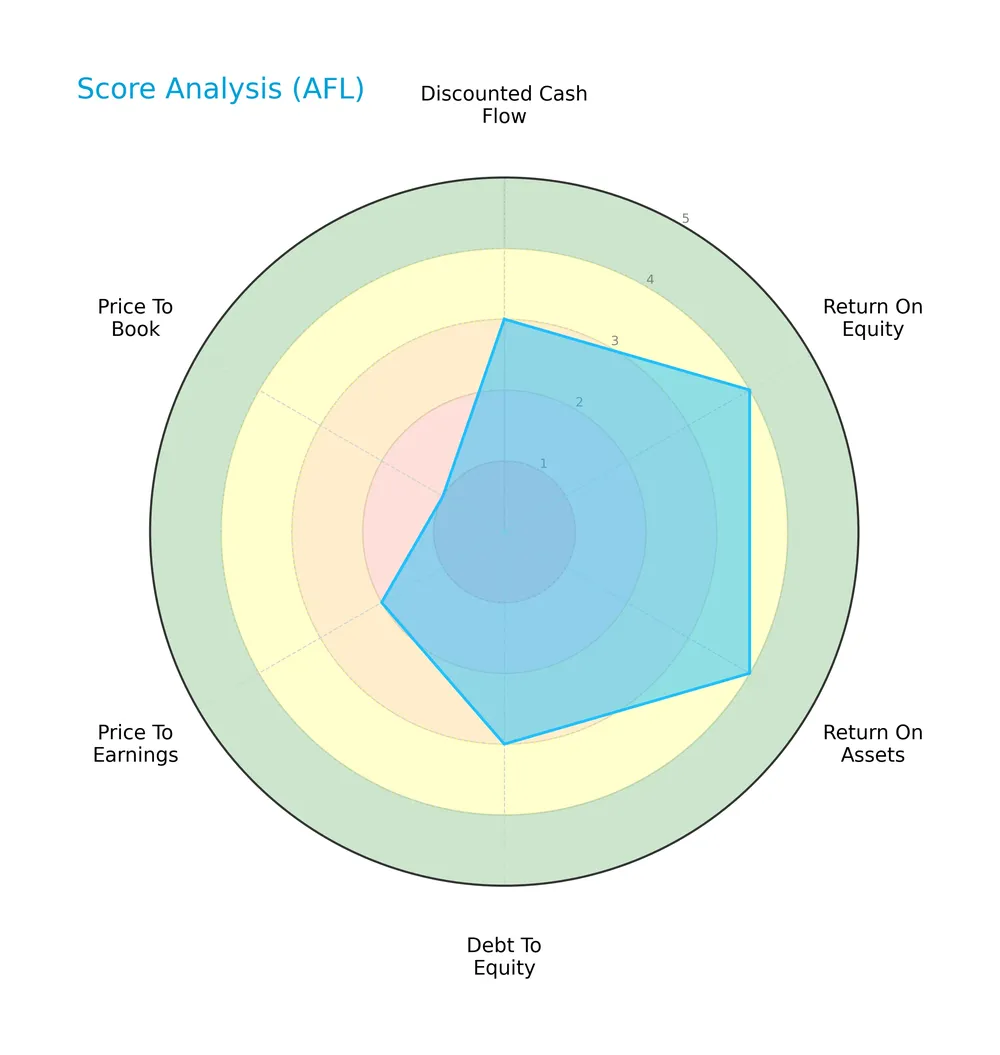
Aflac shows moderate scores in discounted cash flow and debt-to-equity, with favorable returns on equity and assets. However, valuation metrics like price-to-earnings and price-to-book ratios appear unfavorable to very unfavorable.
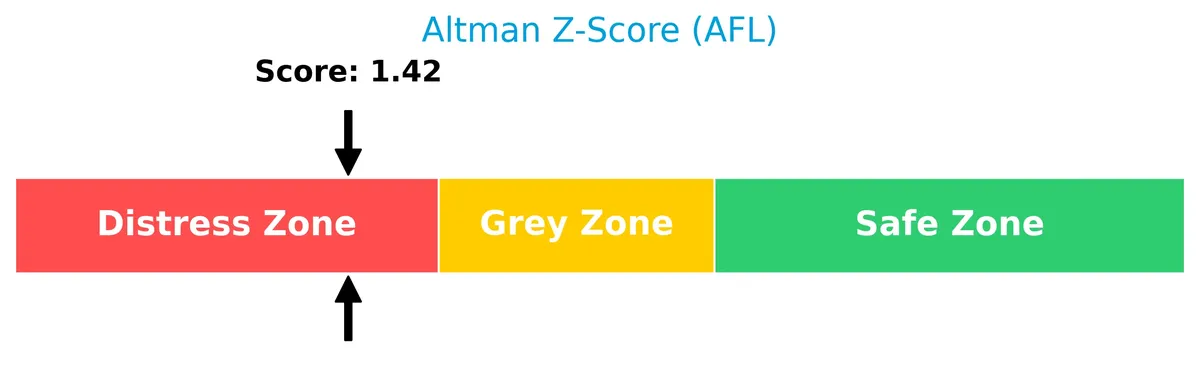
Analysis of the company’s bankruptcy risk
Aflac’s Altman Z-Score places it in the distress zone, indicating a significant risk of financial distress and potential bankruptcy:
Is the company in good financial health?
This Piotroski diagram illustrates Aflac’s financial strength based on its Piotroski Score:

With a score of 6, Aflac’s financial health ranks as average, suggesting moderate strength but leaving some room for improvement in profitability and efficiency metrics.
Competitive Landscape & Sector Positioning
This analysis reviews Aflac Incorporated’s position within the life insurance sector, focusing on strategic and product dynamics. I will assess whether Aflac holds a competitive advantage over its primary industry rivals.
Strategic Positioning
Aflac focuses on supplemental health and life insurance, primarily split between Japan and the U.S. In 2025, Japan contributed $9.36B, the U.S. $6.90B, showing geographic concentration in these two markets with diversified product offerings across cancer, disability, and life insurance segments.
Revenue by Segment
This pie chart presents Aflac Incorporated’s revenue distribution by segment for the fiscal year 2025, illustrating the relative size of each business unit.
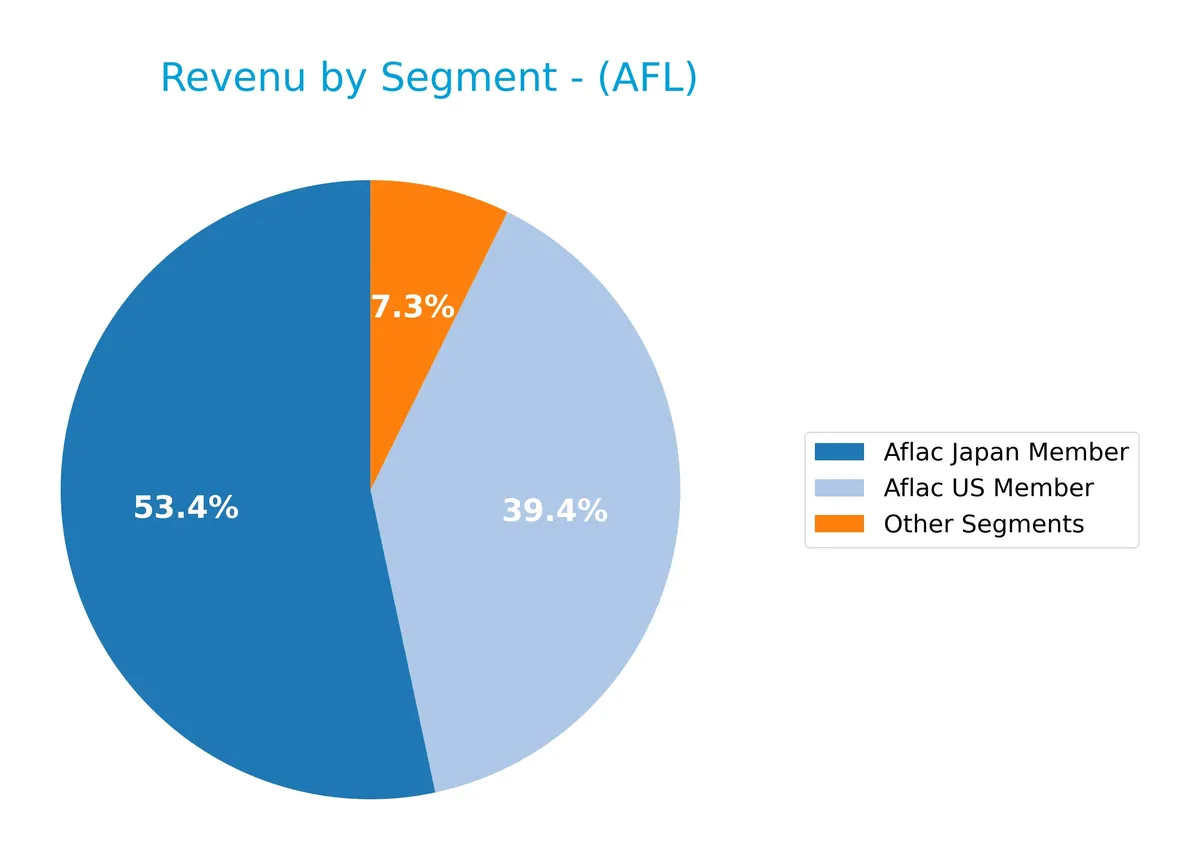
The Aflac Japan Member segment remains the dominant revenue driver at $9.4B, followed by Aflac US Member at $6.9B. Other Segments contribute a smaller $1.3B. Notably, Japan’s revenue has contracted over recent years, signaling a slowdown. Meanwhile, US revenue shows modest growth, reflecting a gradual shift in geographic concentration and potential emerging risks in Japan’s market exposure.
Key Products & Brands
The following table outlines Aflac Incorporated’s main insurance products and brands in Japan and the U.S.:
| Product | Description |
|---|---|
| Aflac Japan Insurance | Offers cancer, medical, nursing care income support, GIFT, whole and term life insurance, WAYS, and child endowment plans. |
| Aflac U.S. Insurance | Provides cancer, accident, short-term disability, critical illness, hospital indemnity, dental, vision, long-term care, and life insurance products. |
| Other Segments | Includes additional unspecified insurance and related financial services segments. |
Aflac’s product portfolio focuses on supplemental health and life insurance, split primarily between its Japan and U.S. markets. The Japan segment dominates revenue, reflecting its mature market presence and product diversity.
Main Competitors
There are 4 competitors in total; the table lists the top 4 leaders by market capitalization:
| Competitor | Market Cap. |
|---|---|
| Aflac Incorporated | 59.6B |
| MetLife, Inc. | 52.9B |
| Prudential Financial, Inc. | 40.2B |
| Globe Life Inc. | 11.0B |
Aflac Incorporated ranks 1st among its 4 competitors. Its market cap is 98.8% of the top player’s scale, reflecting a dominant position. The company stands above both the average market cap of the top 10 and the median sector market cap. It holds an 11.35% lead over its closest rival, MetLife.
Comparisons with competitors
Check out how we compare the company to its competitors:
Does Aflac have a competitive advantage?
Aflac does not present a competitive advantage as its return on invested capital (ROIC) falls below its weighted average cost of capital (WACC), indicating value destruction. Its profitability remains stable, but the company struggles to generate excess returns over its cost of capital.
Looking ahead, Aflac’s presence in Japan and the U.S. positions it to capitalize on supplemental health and life insurance demand. Future opportunities may arise from expanding its product range in cancer and disability insurance, as well as growing markets in both regions.
SWOT Analysis
This analysis highlights Aflac Incorporated’s internal capabilities and external environment to guide strategic positioning.
Strengths
- Strong brand in supplemental insurance
- Favorable net margin at 20.9%
- Low debt-to-assets ratio at 7.2%
Weaknesses
- Declining revenue trend over five years
- ROIC below WACC, indicating value destruction
- Weak liquidity ratios (current and quick ratio at 0)
Opportunities
- Expansion in Japan’s aging population market
- Growth in supplemental insurance demand in the US
- Digital transformation to improve cost efficiency
Threats
- Intense competition in life and health insurance
- Regulatory changes in US and Japan markets
- Economic downturn impacting premium growth
Aflac’s solid profitability and low leverage provide a reliable foundation. However, persistent revenue decline and poor liquidity pose risks. Strategic focus should target revitalizing growth and improving capital efficiency to sustain its competitive edge.
Stock Price Action Analysis
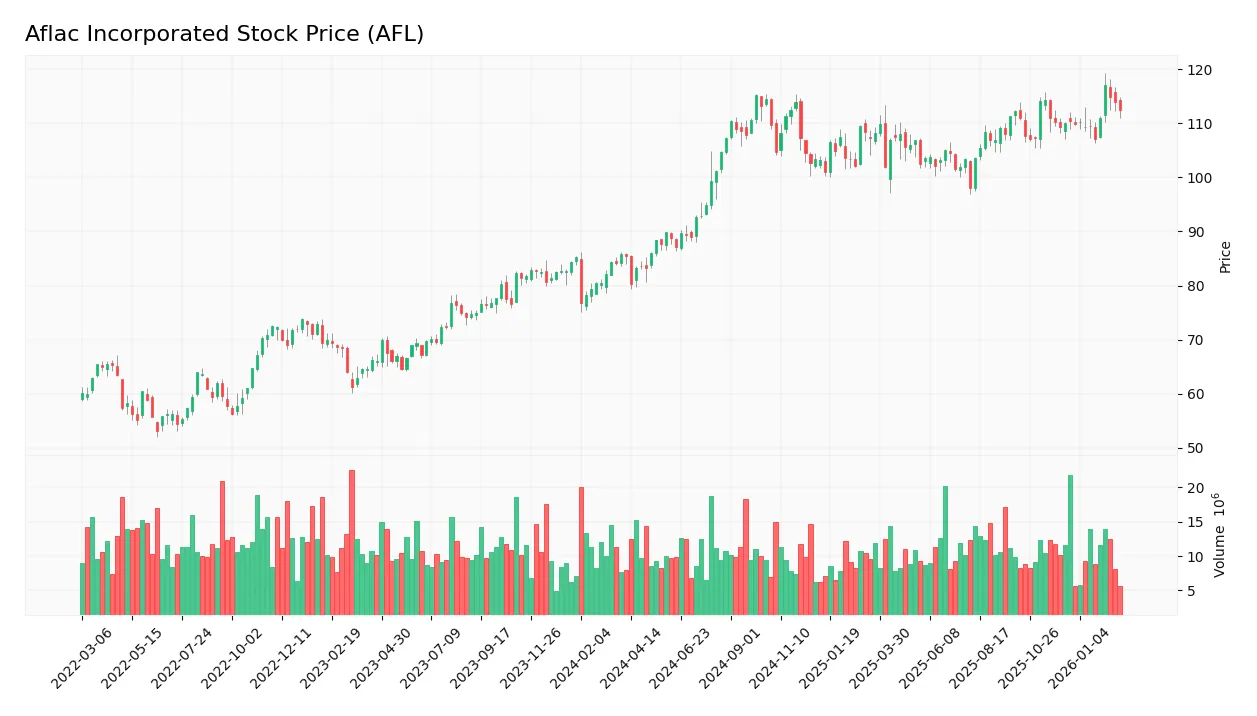
The following weekly stock chart illustrates Aflac Incorporated’s price movements over the past 12 months, highlighting key support and resistance levels:
Trend Analysis
Over the past 12 months, AFL’s stock price rose 31.63%, indicating a bullish trend with accelerating momentum. The price fluctuated between a low of 80.28 and a high of 117.15. Notably, recent three-month data show a modest 2.17% increase with a gentle upward slope of 0.46, reflecting steady but slower growth.
Volume Analysis
Trading volume has increased overall, with buyers accounting for 56.12% of total activity. In the recent three-month period, buyer dominance strengthened to 61.17%, suggesting strong investor interest and positive market participation. This buyer-driven volume trend reinforces confidence in the stock’s upward momentum.
Target Prices
Analysts present a confident target consensus for Aflac Incorporated, reflecting moderate upside potential.
| Target Low | Target High | Consensus |
|---|---|---|
| 101 | 125 | 113.83 |
The target range suggests that analysts expect Aflac’s stock price to appreciate, with a consensus near 114, indicating steady market confidence.

Don’t Let Luck Decide Your Entry Point
Optimize your entry points with our advanced ProRealTime indicators. You’ll get efficient buy signals with precise price targets for maximum performance. Start outperforming now!
Analyst & Consumer Opinions
This section examines recent analyst ratings and consumer feedback regarding Aflac Incorporated’s performance and market perception.
Stock Grades
Here are the latest verified stock grades from established financial firms for Aflac Incorporated:
| Grading Company | Action | New Grade | Date |
|---|---|---|---|
| Wells Fargo | Maintain | Equal Weight | 2026-02-25 |
| Barclays | Maintain | Underweight | 2026-01-08 |
| JP Morgan | Maintain | Neutral | 2026-01-05 |
| Raymond James | Maintain | Outperform | 2025-12-30 |
| TD Cowen | Maintain | Hold | 2025-12-22 |
| Morgan Stanley | Maintain | Equal Weight | 2025-11-17 |
| Wells Fargo | Maintain | Equal Weight | 2025-11-07 |
| Evercore ISI Group | Maintain | Underperform | 2025-11-07 |
| Barclays | Maintain | Underweight | 2025-11-05 |
| JP Morgan | Maintain | Neutral | 2025-11-05 |
The consensus remains cautious with a majority holding a “Hold” stance. Ratings range from “Underperform” to “Outperform,” signaling mixed analyst views without recent upgrades or downgrades.
Consumer Opinions
Aflac Incorporated earns mixed consumer sentiment, reflecting both trust in its products and concerns about service.
| Positive Reviews | Negative Reviews |
|---|---|
| “Reliable coverage and quick claim payments.” | “Customer service wait times are frustrating.” |
| “Affordable premiums with strong benefits.” | “Policy details can be confusing to understand.” |
| “Helpful representatives and clear communication.” | “Limited options for customization in some plans.” |
Overall, consumers praise Aflac’s dependable benefits and affordability. However, recurring issues include customer service delays and complexity in policy terms, signaling areas where the company must improve clarity and responsiveness.
Risk Analysis
Below is a detailed table outlining key risks Aflac Incorporated faces, including their probability and potential impact:
| Category | Description | Probability | Impact |
|---|---|---|---|
| Financial Stability | Altman Z-Score at 1.42 signals distress zone, indicating bankruptcy risk. | Medium | High |
| Liquidity | Current and quick ratios reported as zero, reflecting poor short-term liquidity. | High | Medium |
| Profitability | ROIC (3.21%) below WACC (6.28%) shows value destruction risk. | Medium | Medium |
| Valuation | Unfavorable P/E and very unfavorable P/B ratios may limit upside potential. | Medium | Medium |
| Market Volatility | Beta of 0.66 suggests lower volatility but may underperform in bull markets. | Low | Low |
| Operational Efficiency | Low asset turnover (0.15) signals inefficient asset use compared to peers. | Medium | Medium |
Aflac’s most pressing risk is its financial distress signal via the Altman Z-Score, coupled with alarming liquidity issues. Despite a strong dividend yield (6.54%) and stable debt metrics, the company’s inability to generate returns above its cost of capital and poor short-term liquidity could pressure its financial health if market conditions worsen. Investors must weigh these risks against Aflac’s established market position and current valuation metrics.
Should You Buy Aflac Incorporated?
Aflac appears to be a company with improving profitability and moderate leverage, yet its competitive moat seems unfavorable due to persistent value destruction. While its overall rating is a solid B, caution may be warranted given distress-zone bankruptcy risk signals.
Strength & Efficiency Pillars
Aflac Incorporated sustains solid operational margins with a gross margin of 38.93% and an EBIT margin of 26.67%, underlining strong core profitability. The net margin stands at a favorable 20.91%, reflecting efficient cost management. However, the return on invested capital (ROIC) at 3.21% falls short of the weighted average cost of capital (WACC) at 6.28%, signaling value destruction rather than creation. ROE at 12.36% remains moderate, indicating room for improvement in shareholder returns.
Weaknesses and Drawbacks
Aflac is in financial distress with an Altman Z-Score of 1.42, placing it squarely in the Distress Zone and indicating a heightened bankruptcy risk. This solvency red flag overshadows other metrics. Additionally, valuation metrics are cautious; the P/E ratio of 16.03 and P/B ratio near 1.98 suggest neutral market pricing but lack compelling undervaluation. Liquidity ratios are unfavorable, with a current ratio and quick ratio reported at zero, highlighting potential short-term funding concerns despite a low debt-to-equity ratio of 0.29.
Our Final Verdict about Aflac Incorporated
Despite operational profitability, Aflac’s profile is overshadowed by its poor solvency standing with a Z-Score in the Distress Zone (1.42), making the investment highly speculative. The company’s value destruction and liquidity weaknesses compound risks. Although recent market behavior is buyer-dominant and the stock trend bullish, the solvency risk suggests that Aflac might appear too risky for conservative capital at this stage.
Disclaimer: This content is for informational purposes only and does not constitute financial, investment, or other professional advice. Investing in financial markets involves a significant risk of loss, and past performance is not indicative of future results.
Additional Resources
- Decoding Aflac Inc (AFL): A Strategic SWOT Insight – GuruFocus (Feb 26, 2026)
- Wells Fargo Raises Aflac (AFL) Target, Revises Earnings Outlook and Valuation Approach – Finviz (Feb 26, 2026)
- Aflac Incorporated Announces Fourth Quarter Results, Reports Fourth Quarter Net Earnings of $1.4 Billion, Reiterates Increase in First Quarter Dividend of 5.2% – Aflac (Feb 04, 2026)
- Fox Run Management L.L.C. Takes $1.86 Million Position in Aflac Incorporated $AFL – MarketBeat (Feb 25, 2026)
- Q4 Rundown: Aflac (NYSE:AFL) Vs Other Life Insurance Stocks – Yahoo Finance (Feb 25, 2026)
For more information about Aflac Incorporated, please visit the official website: aflac.com