Home > Analyses > Technology > Advanced Micro Devices, Inc.
Advanced Micro Devices, Inc. (AMD) powers the digital world by delivering cutting-edge semiconductor technologies that shape computing, graphics, and data center performance. Known for its flagship Ryzen and EPYC processors alongside Radeon graphics cards, AMD has redefined industry standards with innovation and competitive quality. As market dynamics evolve rapidly, the key question for investors is whether AMD’s robust fundamentals and growth trajectory continue to justify its premium valuation and long-term potential in a fiercely competitive sector.
Table of contents
Business Model & Company Overview
Advanced Micro Devices, Inc., founded in 1969 and headquartered in Santa Clara, California, stands as a leading semiconductor company globally. Its core mission revolves around delivering a unified ecosystem of high-performance computing and graphics solutions, spanning desktop and notebook processors, discrete and integrated GPUs, and server and embedded processors. AMD’s product suite under brands like Ryzen, Radeon, and EPYC forms an integrated platform powering personal computing, gaming consoles, and data centers.
AMD’s revenue engine balances robust hardware sales with complementary development services, serving diverse markets across the Americas, Europe, and Asia. Its strategic presence in consumer, enterprise, and cloud sectors drives recurring demand for advanced processors and graphics accelerators. This multi-segment approach, combined with innovation in semi-custom SoC products, fortifies AMD’s competitive advantage and cements its pivotal role in shaping the semiconductor industry’s future.
Financial Performance & Fundamental Metrics
This section analyzes Advanced Micro Devices, Inc.’s income statement, key financial ratios, and dividend payout policy to assess its overall financial health and investment appeal.
Income Statement
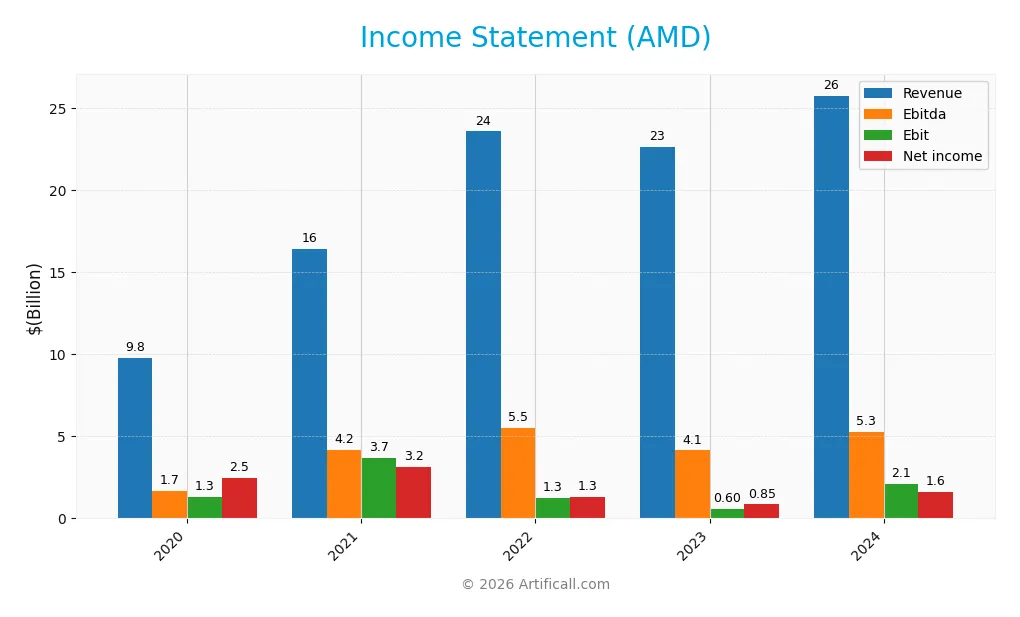
The table below summarizes Advanced Micro Devices, Inc.’s key income statement figures over the past five fiscal years, highlighting its revenue, expenses, profits, and earnings per share.
| 2020 | 2021 | 2022 | 2023 | 2024 | |
|---|---|---|---|---|---|
| Revenue | 9.8B | 16.4B | 23.6B | 22.7B | 25.8B |
| Cost of Revenue | 5.4B | 8.5B | 13.0B | 12.2B | 13.1B |
| Operating Expenses | 3.0B | 4.3B | 9.3B | 10.1B | 10.8B |
| Gross Profit | 4.3B | 7.9B | 10.6B | 10.5B | 12.7B |
| EBITDA | 1.7B | 4.2B | 5.5B | 4.1B | 5.3B |
| EBIT | 1.3B | 3.7B | 1.3B | 0.6B | 2.1B |
| Interest Expense | 47M | 34M | 88M | 106M | 92M |
| Net Income | 2.5B | 3.2B | 1.3B | 0.9B | 1.6B |
| EPS | 2.10 | 2.61 | 0.85 | 0.53 | 1.01 |
| Filing Date | 2021-01-29 | 2022-02-03 | 2023-02-27 | 2024-01-31 | 2025-02-05 |
Income Statement Evolution
From 2020 to 2024, AMD’s revenue grew substantially by 164.11%, reaching $25.8B in 2024, with a favorable 13.69% increase from 2023. Gross profit also rose notably by 21.65% in the last year, improving margins to 49.35%. However, net income declined overall by 34.1%, with net margin shrinking by 75.05%, despite a strong rebound in 2024. EBIT margin remained stable and neutral at 8.07%.
Is the Income Statement Favorable?
In 2024, AMD showed a favorable income statement with a net margin of 6.36%, supported by an EBIT margin of 8.07% and a low interest expense ratio of 0.36%. The company demonstrated strong growth in revenue, gross profit, EBIT, and EPS over the past year, reflecting improving operational efficiency. Despite previous net income declines, the fundamentals in the most recent year appear generally favorable with solid profitability and controlled expenses.
Financial Ratios
The following table summarizes key financial ratios for Advanced Micro Devices, Inc. (AMD) over the fiscal years 2020 to 2024:
| Ratios | 2020 | 2021 | 2022 | 2023 | 2024 |
|---|---|---|---|---|---|
| Net Margin | 25.5% | 19.2% | 5.6% | 3.8% | 6.4% |
| ROE | 42.7% | 42.2% | 2.4% | 1.5% | 2.9% |
| ROIC | 21.0% | 37.0% | 2.1% | 0.6% | 2.5% |
| P/E | 43.7 | 56.1 | 76.6 | 278.6 | 123.6 |
| P/B | 18.6 | 23.6 | 1.8 | 4.3 | 3.5 |
| Current Ratio | 2.54 | 2.02 | 2.36 | 2.51 | 2.62 |
| Quick Ratio | 1.96 | 1.56 | 1.77 | 1.86 | 1.83 |
| D/E | 0.09 | 0.09 | 0.05 | 0.05 | 0.04 |
| Debt-to-Assets | 6.0% | 5.3% | 4.2% | 4.4% | 3.2% |
| Interest Coverage | 29.1 | 107.3 | 14.4 | 3.8 | 20.7 |
| Asset Turnover | 1.09 | 1.32 | 0.35 | 0.33 | 0.37 |
| Fixed Asset Turnover | 11.5 | 15.4 | 12.0 | 10.2 | 10.6 |
| Dividend Yield | 0 | 0 | 0 | 0 | 0 |
Evolution of Financial Ratios
From 2020 to 2024, AMD’s Return on Equity (ROE) declined significantly from 42.66% to 2.85%, indicating a slowdown in profitability. The Current Ratio improved steadily, rising from 2.54 to 2.62, reflecting enhanced liquidity. The Debt-to-Equity Ratio decreased from 0.09 to 0.04, showing reduced leverage. Overall, profitability margins have contracted, highlighting a period of profit margin compression.
Are the Financial Ratios Favorable?
In 2024, AMD’s financial ratios present a mixed picture. Liquidity is favorable with a Current Ratio of 2.62 and Quick Ratio of 1.83, while leverage is low, evidenced by a Debt-to-Equity Ratio of 0.04 and Debt-to-Assets at 3.2%. However, profitability metrics such as ROE (2.85%) and Return on Invested Capital (2.49%) are unfavorable, alongside a high Price-to-Earnings ratio of 123.59. Efficiency is also weak with an Asset Turnover of 0.37. Overall, the ratios are slightly unfavorable.
Shareholder Return Policy
Advanced Micro Devices, Inc. (AMD) does not pay dividends, reflecting its focus on reinvestment and growth rather than direct shareholder payouts. The company also does not engage in share buybacks, indicating a strategy prioritizing capital allocation towards operational and developmental needs.
This approach aligns with a high-growth technology firm concentrating on long-term value creation through innovation and expansion. The absence of distributions supports sustainable shareholder value by preserving resources for future opportunities instead of immediate returns.
Score analysis
Here is an overview of the company’s key financial scores, illustrating its valuation and profitability metrics:
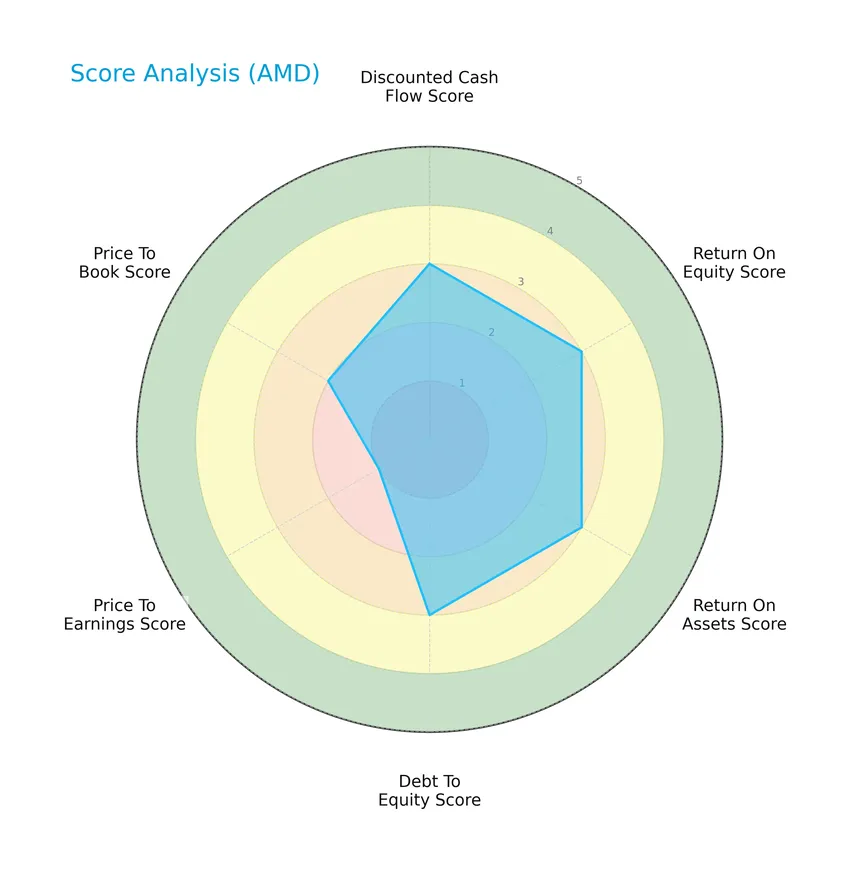
Advanced Micro Devices, Inc. shows moderate scores in discounted cash flow, return on equity, return on assets, and debt to equity, indicating balanced financial health. However, the price to earnings score is very unfavorable, while the price to book score remains moderate.
Analysis of the company’s bankruptcy risk
The Altman Z-Score places the company firmly in the safe zone, suggesting a low risk of bankruptcy and strong financial stability:

Is the company in good financial health?
This Piotroski diagram highlights the company’s financial strength based on nine key criteria:

With a Piotroski Score of 6, the company demonstrates average financial health, indicating moderate strength but room for improvement in operational efficiency and profitability.
Competitive Landscape & Sector Positioning
This sector analysis will examine Advanced Micro Devices, Inc.’s strategic positioning, revenue by segment, key products, main competitors, competitive advantages, and SWOT analysis. I will assess whether AMD holds a competitive advantage over its rivals in the semiconductor industry.
Strategic Positioning
Advanced Micro Devices, Inc. operates a diversified product portfolio spanning client processors, data center solutions, embedded systems, and gaming technologies, with significant revenue growth in data center (USD 12.6B in 2024). Geographically, AMD has broad exposure across the United States (USD 8.7B), China (USD 6.2B), Taiwan (USD 3.3B), and other key markets.
Revenue by Segment
This pie chart illustrates Advanced Micro Devices, Inc. (AMD) revenue distribution by segment for the fiscal year 2024, highlighting the company’s business areas and their relative contributions.
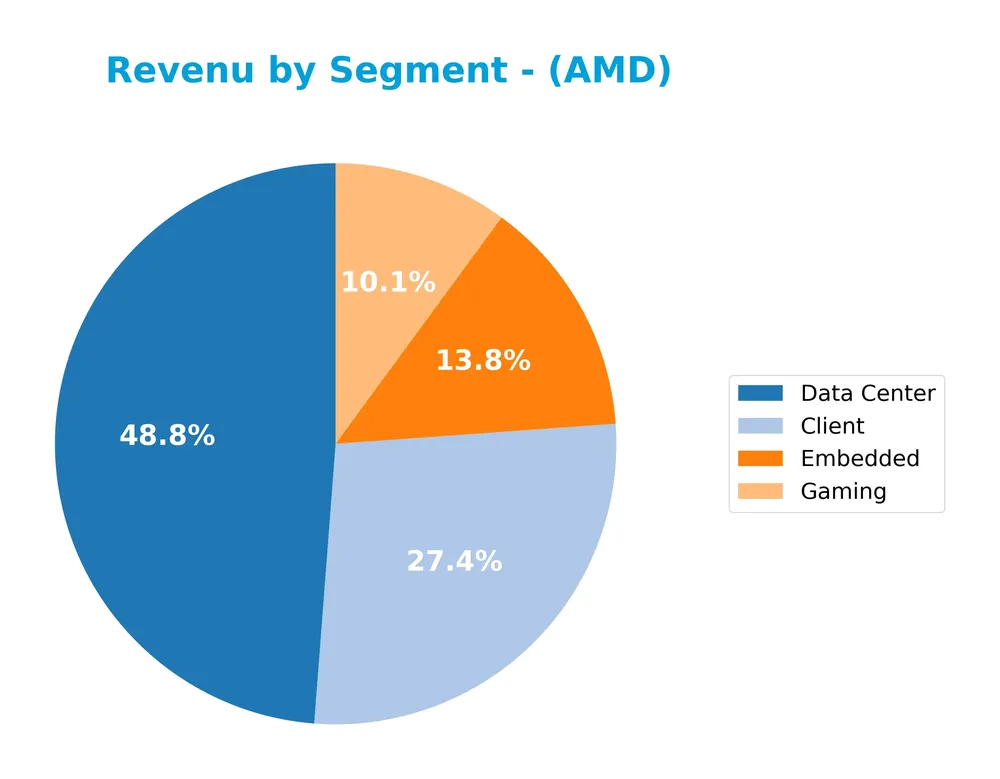
In 2024, AMD’s revenue is primarily driven by the Data Center segment with $12.6B, followed by Client at $7.1B. Embedded and Gaming segments contribute $3.6B and $2.6B respectively. The Data Center segment shows a strong acceleration compared to prior years, indicating a strategic focus shift, while Gaming revenue declined significantly from $6.2B in 2023, highlighting some concentration risk and market challenges in that segment.
Key Products & Brands
The following table presents Advanced Micro Devices, Inc.’s key products and brands along with their descriptions:
| Product | Description |
|---|---|
| AMD Ryzen, Ryzen PRO, Threadripper, Threadripper PRO | Processors for desktop and notebook personal computers, targeting high-performance computing needs. |
| AMD Athlon, Athlon PRO, FX, A-Series, PRO A-Series | Additional lines of processors for desktops and notebooks, addressing various performance segments. |
| AMD Radeon Graphics, Embedded Radeon Graphics | Discrete graphics processing units (GPUs) for desktop and notebook PCs, including embedded solutions. |
| AMD Radeon Pro, AMD FirePro | Professional graphics products designed for workstations and professional applications. |
| Radeon Instinct, Radeon PRO V-series, AMD Instinct | Accelerators designed for server and data center applications, focusing on high-performance computing and AI workloads. |
| AMD EPYC | Microprocessors for servers, delivering high core counts and performance for enterprise and cloud applications. |
| AMD Athlon, Geode, Ryzen, EPYC, R-Series, G-Series | Embedded processor solutions for specialized computing environments and devices. |
| Semi-custom System-on-Chip (SoC) products | Customizable SoC products for game consoles and other customer-specific applications. |
| Chipsets under AMD trademark | Supporting chipsets complementing AMD CPU and GPU products for various computing platforms. |
Advanced Micro Devices, Inc. offers a comprehensive portfolio of processors and graphics products covering client computing, data center, embedded systems, and gaming markets, supported by semi-custom solutions and targeted chipsets.
Main Competitors
There are 38 competitors in the Technology Semiconductors sector, with the table below listing the top 10 leaders by market capitalization:
| Competitor | Market Cap. |
|---|---|
| NVIDIA Corporation | 4.60T |
| Broadcom Inc. | 1.64T |
| Taiwan Semiconductor Manufacturing Company Limited | 1.58T |
| ASML Holding N.V. | 415B |
| Advanced Micro Devices, Inc. | 363B |
| Micron Technology, Inc. | 353B |
| Lam Research Corporation | 232B |
| Applied Materials, Inc. | 214B |
| QUALCOMM Incorporated | 185B |
| Intel Corporation | 173B |
Advanced Micro Devices, Inc. ranks 5th among its 38 competitors, with a market cap approximately 9.2% that of the sector leader NVIDIA Corporation. AMD’s market capitalization is below the average of the top 10 competitors (974.8B) but stands above the sector median (30.7B). It is positioned just 1.91% behind the next competitor above, ASML Holding N.V., indicating a close competition for the fourth spot.
Comparisons with competitors
Check out how we compare the company to its competitors:
Does AMD have a competitive advantage?
Advanced Micro Devices, Inc. (AMD) currently does not demonstrate a competitive advantage, as its return on invested capital (ROIC) is significantly below its weighted average cost of capital (WACC), indicating value destruction and declining profitability. The company’s ROIC trend from 2020 to 2024 is sharply negative, emphasizing its struggle to generate excess returns on invested capital.
Looking ahead, AMD’s diverse product portfolio across computing, graphics, enterprise, and semi-custom segments offers opportunities for growth in data centers, gaming consoles, and embedded solutions. Expansion in key geographic markets such as China, Singapore, and Taiwan further supports potential revenue growth, though the company faces challenges in sustaining profitability levels.
SWOT Analysis
This SWOT analysis highlights Advanced Micro Devices, Inc.’s (AMD) key internal and external factors to guide informed investment decisions.
Strengths
- Strong revenue growth of 164% over 5 years
- Favorable gross margin at 49.35%
- Robust market cap of $423B
Weaknesses
- Declining net income and EPS over 5 years
- Unfavorable ROE and ROIC below WACC
- High P/E ratio at 124 indicating overvaluation
Opportunities
- Expanding presence in China and Asia markets
- Growth in data centers and cloud computing demand
- Innovation in GPUs and semi-custom solutions for gaming consoles
Threats
- Intense competition from industry giants
- Geopolitical risks impacting supply chain
- Market volatility affecting tech valuations
Overall, AMD demonstrates solid growth and strong margins but faces profitability challenges and valuation concerns. Strategic focus should emphasize improving returns on capital while leveraging growth opportunities in emerging markets and technology segments, with careful risk management around competition and geopolitical factors.
Stock Price Action Analysis
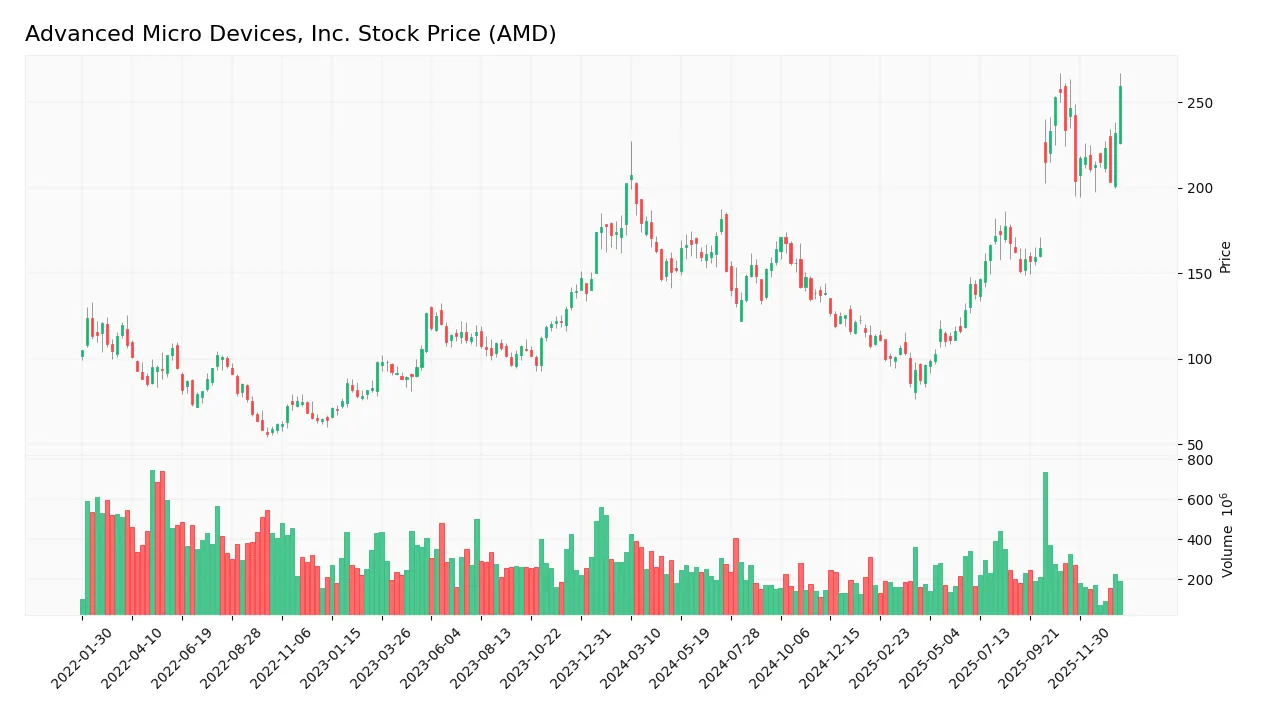
The following weekly chart illustrates Advanced Micro Devices, Inc. (AMD) stock price movements over the last 100 weeks, highlighting recent trends and volatility:
Trend Analysis
Over the past 100 weeks, AMD stock increased by 28.15%, indicating a bullish trend with acceleration. The price ranged between a low of 85.76 and a high of 259.68, with high volatility reflected by a 40.51 standard deviation. The recent 11-week period shows continued upward momentum with an 11.19% gain and decelerated volatility at 16.39 standard deviation.
Volume Analysis
In the last three months, trading volume shows a decreasing trend despite buyer dominance at 62.37%. Buyers accounted for 1.41B shares versus 848M sellers, indicating sustained investor interest but reduced market participation, suggesting cautious optimism among market participants.
Target Prices
The consensus target prices for Advanced Micro Devices, Inc. (AMD) indicate a generally optimistic outlook among analysts.
| Target High | Target Low | Consensus |
|---|---|---|
| 380 | 225 | 289.56 |
Analysts expect AMD’s stock to trade between 225 and 380, with a consensus target around 290, reflecting confidence in the company’s growth potential.

Don’t Let Luck Decide Your Entry Point
Optimize your entry points with our advanced ProRealTime indicators. You’ll get efficient buy signals with precise price targets for maximum performance. Start outperforming now!
Analyst & Consumer Opinions
This section examines the latest grades from financial analysts alongside consumer feedback on Advanced Micro Devices, Inc. (AMD).
Stock Grades
The following table presents the latest verified stock grades from recognized financial institutions for Advanced Micro Devices, Inc.:
| Grading Company | Action | New Grade | Date |
|---|---|---|---|
| Bernstein | Maintain | Market Perform | 2026-01-21 |
| Keybanc | Upgrade | Overweight | 2026-01-13 |
| Truist Securities | Maintain | Buy | 2025-12-19 |
| Roth Capital | Maintain | Buy | 2025-11-12 |
| Piper Sandler | Maintain | Overweight | 2025-11-12 |
| B of A Securities | Maintain | Buy | 2025-11-12 |
| Evercore ISI Group | Maintain | Outperform | 2025-11-12 |
| Rosenblatt | Maintain | Buy | 2025-11-12 |
| Wedbush | Maintain | Outperform | 2025-11-12 |
| Wells Fargo | Maintain | Overweight | 2025-11-12 |
Overall, the grades indicate a predominantly positive outlook with a majority of buy and overweight recommendations, while Bernstein remains cautious with a market perform rating, reflecting a generally favorable but measured market sentiment.
Consumer Opinions
Consumers have shared a mix of enthusiasm and concerns about Advanced Micro Devices, Inc. (AMD), reflecting its strong market presence and areas for improvement.
| Positive Reviews | Negative Reviews |
|---|---|
| “AMD’s processors deliver excellent performance for gaming and professional use.” | “Some users experience driver issues after updates.” |
| “Great value for the price compared to competitors.” | “Occasional overheating reported in high-end models.” |
| “Innovative technology with strong multi-core capabilities.” | “Support response times can be slow.” |
Overall, consumers appreciate AMD’s high performance and competitive pricing but frequently mention driver stability and customer support as areas needing attention.
Risk Analysis
Below is a table summarizing the key risks associated with investing in Advanced Micro Devices, Inc. (AMD):
| Category | Description | Probability | Impact |
|---|---|---|---|
| Market Volatility | High beta of 1.95 indicates AMD’s stock price is highly sensitive to market swings. | High | High |
| Valuation Risk | Unfavorable P/E ratio at 123.59 suggests the stock may be overvalued relative to earnings. | Medium | High |
| Profitability | Low ROE (2.85%) and ROIC (2.49%) point to weak profitability and capital efficiency. | Medium | Medium |
| Competitive Pressure | Intense competition in the semiconductor industry could impact AMD’s market share and margins. | Medium | High |
| No Dividend Yield | Absence of dividends limits income for investors seeking cash flow. | Low | Low |
| Financial Health | Strong Altman Z-Score (14.95) indicates low bankruptcy risk; solid liquidity ratios support stability. | Low | Low |
The most critical risks for AMD investors are market volatility due to its high beta and valuation risk signaled by the very high P/E ratio. These factors combined with competitive pressures in semiconductors pose the greatest threat to returns despite AMD’s solid financial stability.
Should You Buy Advanced Micro Devices, Inc.?
Advanced Micro Devices, Inc. appears to be navigating a challenging period with declining profitability and a deteriorating competitive moat that suggests value erosion. Despite a manageable leverage profile and a B- rating indicating moderate financial health, overall risk remains elevated, warranting cautious analytical interpretation.
Strength & Efficiency Pillars
Advanced Micro Devices, Inc. exhibits solid financial health with an Altman Z-score of 14.95, placing it well within the safe zone and indicating low bankruptcy risk. The Piotroski score of 6 suggests average financial strength, reflecting moderate operational efficiency. The company maintains favorable liquidity metrics, such as a current ratio of 2.62 and a debt-to-equity ratio of 0.04, underscoring prudent leverage management. While its ROIC of 2.49% falls short of the 13% WACC, indicating value erosion rather than creation, AMD benefits from a net margin of 6.36% and strong interest coverage of 22.62, pointing to operational resilience.
Weaknesses and Drawbacks
AMD faces valuation challenges, with a notably elevated P/E ratio of 123.59 and a P/B ratio of 3.52, signaling a premium market valuation that may not be fully supported by fundamentals. Return on equity is weak at 2.85%, and ROIC lags behind WACC, suggesting declining profitability and value destruction. Asset turnover is low at 0.37, hinting at potential inefficiencies in asset utilization. Additionally, the absence of dividend yield may deter income-focused investors. These factors, combined with slightly unfavorable ratio evaluations, introduce risks that could weigh on the stock’s medium-term performance.
Our Verdict about Advanced Micro Devices, Inc.
The long-term fundamental profile of AMD appears moderately favorable, supported by strong liquidity and safe financial footing. Coupled with a bullish overall stock trend and buyer dominance in recent periods, the profile may appear attractive for long-term exposure. However, elevated valuation multiples and profitability pressures suggest that investors could benefit from a cautious approach, monitoring for improved earnings efficiency before committing significant capital.
Disclaimer: This content is for informational purposes only and does not constitute financial, investment, or other professional advice. Investing in financial markets involves a significant risk of loss, and past performance is not indicative of future results.
Additional Resources
- AMD: A Solid Second-Best (NASDAQ:AMD) – Seeking Alpha (Jan 23, 2026)
- Tata Consultancy Services Announces Strategic Collaboration with Advanced Micro Devices (AMD) – Finviz (Jan 23, 2026)
- What’s Going On With Advanced Micro Devices Stock Friday? – Benzinga (Jan 23, 2026)
- Advanced Micro Devices (AMD) Exceeds Market Returns: Some Facts to Consider – Yahoo Finance (Jan 22, 2026)
- Tata Consultancy Services Announces Strategic Collaboration with Advanced Micro Devices (AMD) – Insider Monkey (Jan 23, 2026)
For more information about Advanced Micro Devices, Inc., please visit the official website: amd.com