Home > Analyses > Technology > Adobe Inc.
Adobe Inc. transforms how millions create, communicate, and engage with digital content every day, shaping the creative landscape across industries. As a pioneer in software infrastructure, Adobe leads with its flagship Creative Cloud suite, empowering professionals and enthusiasts alike with cutting-edge tools. Its innovative Digital Experience platform further cements its role in driving business growth through data-driven customer engagement. But in a fast-evolving market, the key question remains: does Adobe’s robust foundation still support its ambitious growth and valuation?
Table of contents
Business Model & Company Overview
Adobe Inc., founded in 1982 and headquartered in San Jose, California, stands as a dominant force in the software infrastructure industry. It delivers a cohesive ecosystem through three segments—Digital Media, Digital Experience, and Publishing and Advertising—enabling content creation, customer engagement, and digital communication worldwide. Its flagship Creative Cloud subscription exemplifies Adobe’s mission to empower individuals and enterprises across creative and marketing fields.
The company’s revenue engine balances recurring subscription services like Creative Cloud and Document Cloud with strategic software solutions for marketing and publishing. Adobe’s global footprint spans the Americas, Europe, and Asia, serving diverse clients from marketers to developers. This integrated approach cements Adobe’s competitive advantage and positions it as a pivotal player shaping the future of digital content and experience management.
Financial Performance & Fundamental Metrics
In this section, I analyze Adobe Inc.’s income statement, key financial ratios, and dividend payout policy to provide a comprehensive fundamental overview.
Income Statement
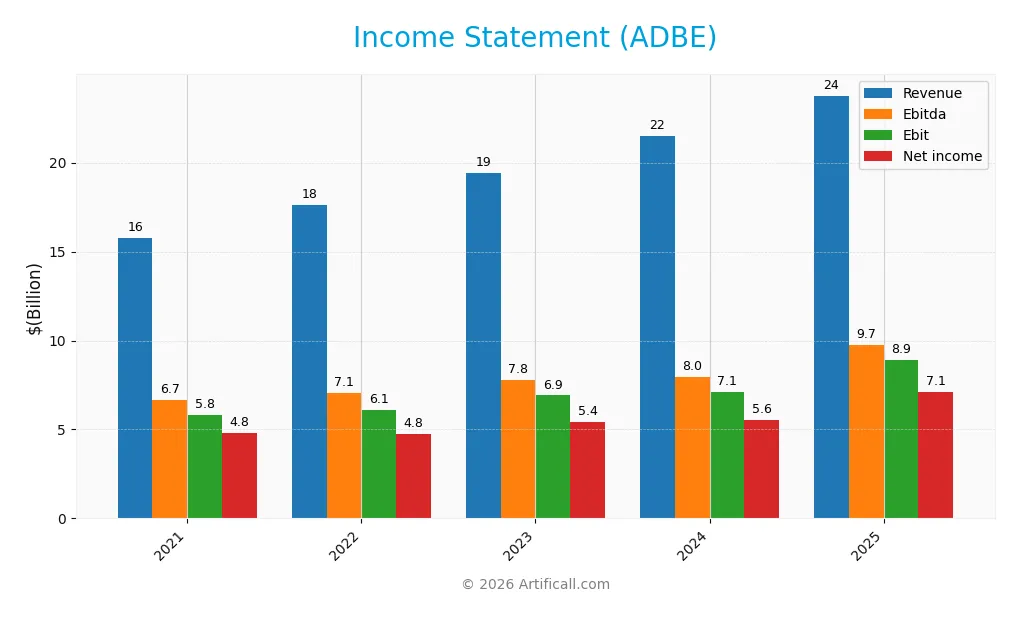
The table below presents Adobe Inc.’s key income statement figures for the fiscal years 2021 through 2025, showing revenue, expenses, profits, and earnings per share.
| 2021 | 2022 | 2023 | 2024 | 2025 | |
|---|---|---|---|---|---|
| Revenue | 15.8B | 17.6B | 19.4B | 21.5B | 23.8B |
| Cost of Revenue | 1.9B | 2.2B | 2.4B | 2.4B | 2.7B |
| Operating Expenses | 8.1B | 9.3B | 10.4B | 12.4B | 12.4B |
| Gross Profit | 13.9B | 15.4B | 17.1B | 19.1B | 21.1B |
| EBITDA | 6.7B | 7.1B | 7.8B | 7.9B | 9.7B |
| EBIT | 5.8B | 6.1B | 6.9B | 7.1B | 8.9B |
| Interest Expense | 113M | 112M | 113M | 164M | 263M |
| Net Income | 4.8B | 4.8B | 5.4B | 5.6B | 7.1B |
| EPS | 10.1 | 10.1 | 11.9 | 12.4 | 16.7 |
| Filing Date | 2022-01-21 | 2023-01-17 | 2024-01-16 | 2025-01-13 | 2026-01-15 |
Income Statement Evolution
Adobe Inc. has shown a steady increase in revenue, growing 10.53% from 2024 to 2025 and 50.58% over the 2021-2025 period. Net income followed a similar positive trend, rising 16.02% year-over-year and 47.86% overall. Margins remain strong, with gross margin at 88.61% and net margin at 30.0%, although net margin slightly declined by 1.8% over the longer term.
Is the Income Statement Favorable?
The 2025 income statement reflects solid fundamentals, marked by a 37.57% EBIT margin and a modest interest expense ratio of 1.11%. Earnings per share increased significantly by 35.11% in the latest year, supporting profitability growth. Overall, 92.86% of the income statement metrics are favorable, indicating a generally positive financial position for Adobe as of 2025.
Financial Ratios
The following table presents key financial ratios for Adobe Inc. over the last five fiscal years, offering a snapshot of profitability, efficiency, liquidity, leverage, and shareholder returns:
| Ratios | 2021 | 2022 | 2023 | 2024 | 2025 |
|---|---|---|---|---|---|
| Net Margin | 30.5% | 27.0% | 28.0% | 25.9% | 30.0% |
| ROE | 32.6% | 33.8% | 32.9% | 39.4% | 61.3% |
| ROIC | 24.0% | 24.6% | 24.6% | 25.4% | 36.7% |
| P/E | 61.0 | 33.8 | 51.6 | 41.5 | 19.1 |
| P/B | 19.9 | 11.4 | 16.9 | 16.4 | 11.7 |
| Current Ratio | 1.25 | 1.11 | 1.34 | 1.07 | 1.00 |
| Quick Ratio | 1.25 | 1.11 | 1.34 | 1.07 | 1.00 |
| D/E | 0.32 | 0.33 | 0.25 | 0.43 | 0.57 |
| Debt-to-Assets | 17.2% | 17.1% | 13.7% | 20.0% | 22.5% |
| Interest Coverage | 51.3 | 54.4 | 58.8 | 41.1 | 33.1 |
| Asset Turnover | 0.58 | 0.65 | 0.65 | 0.71 | 0.81 |
| Fixed Asset Turnover | 7.46 | 7.61 | 8.13 | 9.70 | 10.9 |
| Dividend Yield | 0% | 0% | 0% | 0% | 0% |
Evolution of Financial Ratios
Over the period, Adobe Inc.’s Return on Equity (ROE) showed a notable increase, reaching 61.34% in 2025, indicating improved profitability. The Current Ratio declined from above 1.3 in earlier years to just under 1.0 in 2025, suggesting reduced short-term liquidity. Meanwhile, the Debt-to-Equity Ratio rose moderately to 0.57, reflecting a stable but slightly increased leverage position.
Are the Financial Ratios Favorable?
In 2025, Adobe’s profitability ratios, including net margin (30.0%) and ROE (61.34%), are favorable, supported by a strong interest coverage ratio of 33.96. Liquidity is less favorable with a current ratio near 1.0, while leverage ratios like debt-to-equity (0.57) are neutral. Market valuation metrics such as price-to-book ratio (11.73) are unfavorable. Overall, the financial ratios present a slightly favorable profile.
Shareholder Return Policy
Adobe Inc. does not pay dividends, reflecting a strategy focused on reinvestment and growth rather than direct shareholder payouts. The company maintains solid free cash flow and operating cash flow coverage, supporting capital expenditure and potential share buybacks.
Although no dividend is distributed, Adobe’s approach prioritizes sustainable long-term value creation by reinvesting earnings and potentially repurchasing shares, rather than risking unsustainable distributions. This policy aligns with preserving financial flexibility and supporting future growth opportunities.
Score analysis
The following radar chart illustrates Adobe Inc.’s key financial scores across valuation, profitability, and leverage metrics:
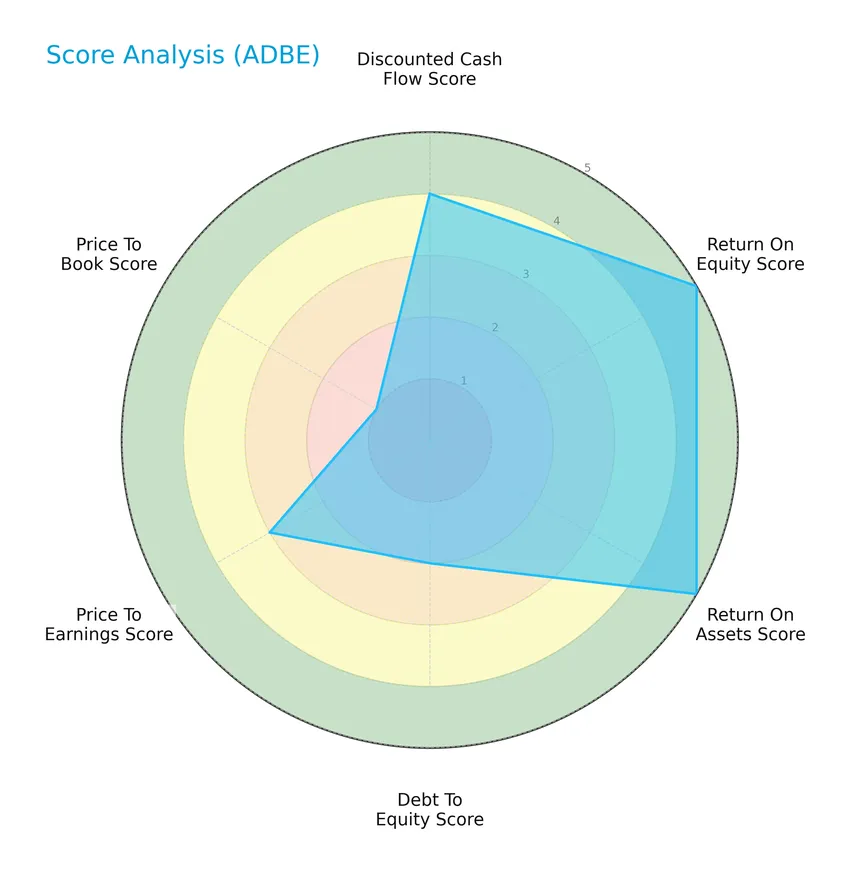
Adobe shows very favorable profitability scores with a 5 in both Return on Equity and Return on Assets. Its discounted cash flow score is favorable at 4, while leverage and valuation metrics are more moderate to unfavorable, including a low Price to Book score of 1.
Analysis of the company’s bankruptcy risk
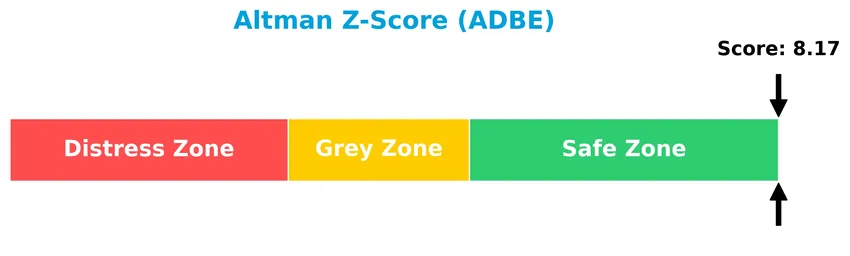
Adobe’s Altman Z-Score indicates a strong financial position, placing the company safely away from bankruptcy risk:
Is the company in good financial health?
The Piotroski F-Score diagram provides insight into Adobe’s overall financial health based on nine performance criteria:

With a Piotroski score of 6, Adobe’s financial health is assessed as average, suggesting moderate strength but room for improvement in some operating and financial efficiency areas.
Competitive Landscape & Sector Positioning
This sector analysis will examine Adobe Inc.’s strategic positioning, revenue by segment, key products, main competitors, and competitive advantages. I will also assess whether Adobe holds a competitive advantage over its industry peers.
Strategic Positioning
Adobe Inc. maintains a diversified product portfolio across Digital Media, Digital Experience, and Print and Publishing segments, with Digital Media dominating at $40.4B in 2025. Geographically, it generates significant revenue mainly from the Americas ($14.1B) and EMEA ($6.3B), reflecting broad international exposure.
Revenue by Segment
This pie chart illustrates Adobe Inc.’s revenue distribution by segment for the fiscal year 2025, highlighting the company’s business focus across Digital Media, Digital Experience, and Print And Publishing.
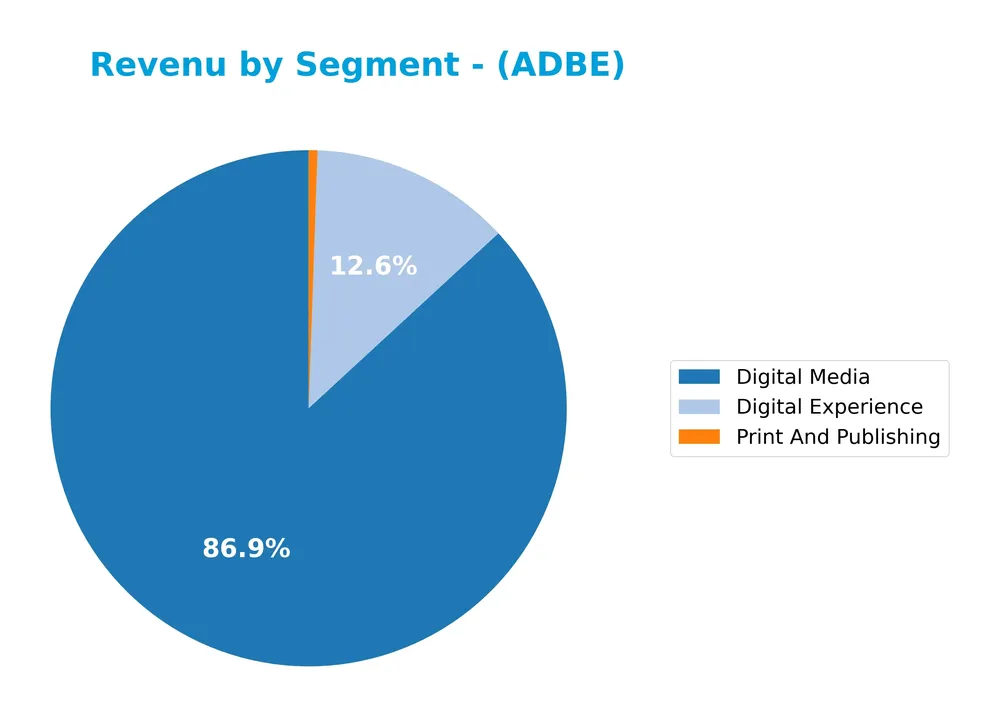
In 2025, Digital Media remains Adobe’s dominant revenue driver at 40.4B, showing strong growth from prior years. Digital Experience also continues its steady rise, reaching 5.9B, reflecting expanding customer engagement tools. Print And Publishing revenue has declined to 256M, indicating a shift away from traditional products. The recent acceleration in Digital Media revenue underscores Adobe’s successful adaptation to digital transformation trends, although reliance on this segment suggests some concentration risk.
Key Products & Brands
The following table outlines Adobe Inc.’s main products and brands along with their descriptions:
| Product | Description |
|---|---|
| Creative Cloud | Flagship subscription service providing access to Adobe’s creative software products for individuals and enterprises. |
| Document Cloud | Unified cloud-based document services platform for creating, managing, and promoting digital documents. |
| Digital Experience | Integrated platform offering applications and services for brands to manage, measure, and optimize customer experiences. |
| Publishing and Advertising | Products and services including e-learning, technical publishing, web conferencing, document platforms, and Advertising Cloud. |
Adobe’s portfolio spans creative software, document management, digital experience platforms, and publishing solutions, serving a broad range of users from individual creators to enterprise clients.
Main Competitors
There are 32 competitors in the Technology sector, with the table below listing the top 10 leaders by market capitalization:
| Competitor | Market Cap. |
|---|---|
| Microsoft Corporation | 3.52T |
| Oracle Corporation | 553B |
| Palantir Technologies Inc. | 383B |
| Adobe Inc. | 140B |
| Palo Alto Networks, Inc. | 120B |
| CrowdStrike Holdings, Inc. | 113B |
| Synopsys, Inc. | 92B |
| Cloudflare, Inc. | 69B |
| Fortinet, Inc. | 59B |
| Block, Inc. | 40B |
Adobe Inc. ranks 4th among 32 competitors in its sector, with a market cap representing 3.59% of the top player, Microsoft Corporation. Adobe’s market cap is below the average of the top 10 competitors (508B) but remains above the sector median (18.8B). The company shows a substantial 204.26% gap to the next competitor above, Oracle Corporation, indicating a significant distance to the third-ranked firm.
Comparisons with competitors
Check out how we compare the company to its competitors:
Does ADBE have a competitive advantage?
Adobe Inc. demonstrates a durable competitive advantage, evidenced by a ROIC exceeding its WACC by 26%, alongside a strong 53% growth in ROIC over 2021-2025, signaling efficient capital use and value creation. This very favorable moat status reflects Adobe’s ability to sustain high profitability and generate excess returns consistently.
Looking ahead, Adobe’s diverse software segments—including Digital Media, Digital Experience, and Publishing and Advertising—position it well to capitalize on growing demand for cloud-based creative, marketing, and document solutions. Expansion opportunities in emerging markets and ongoing innovation in integrated platforms support a positive outlook for sustaining its competitive edge.
SWOT Analysis
This SWOT analysis highlights Adobe Inc.’s core strengths, weaknesses, opportunities, and threats to guide informed investment decisions.
Strengths
- strong market position with $126B market cap
- high gross margin at 88.6%
- diversified revenue streams across Digital Media and Experience
Weaknesses
- high price-to-book ratio at 11.73
- no dividend yield
- current ratio of 1.0 indicates liquidity risk
Opportunities
- expanding global digital transformation
- growth in cloud-based services
- increasing demand for AI-powered creative tools
Threats
- intense competition in software industry
- economic downturns affecting enterprise spending
- cybersecurity risks impacting customer trust
Overall, Adobe demonstrates robust profitability and a durable competitive moat, but investors should watch its valuation metrics and liquidity. The company’s strategic focus on innovation and cloud expansion positions it well for sustained growth amid evolving market challenges.
Stock Price Action Analysis
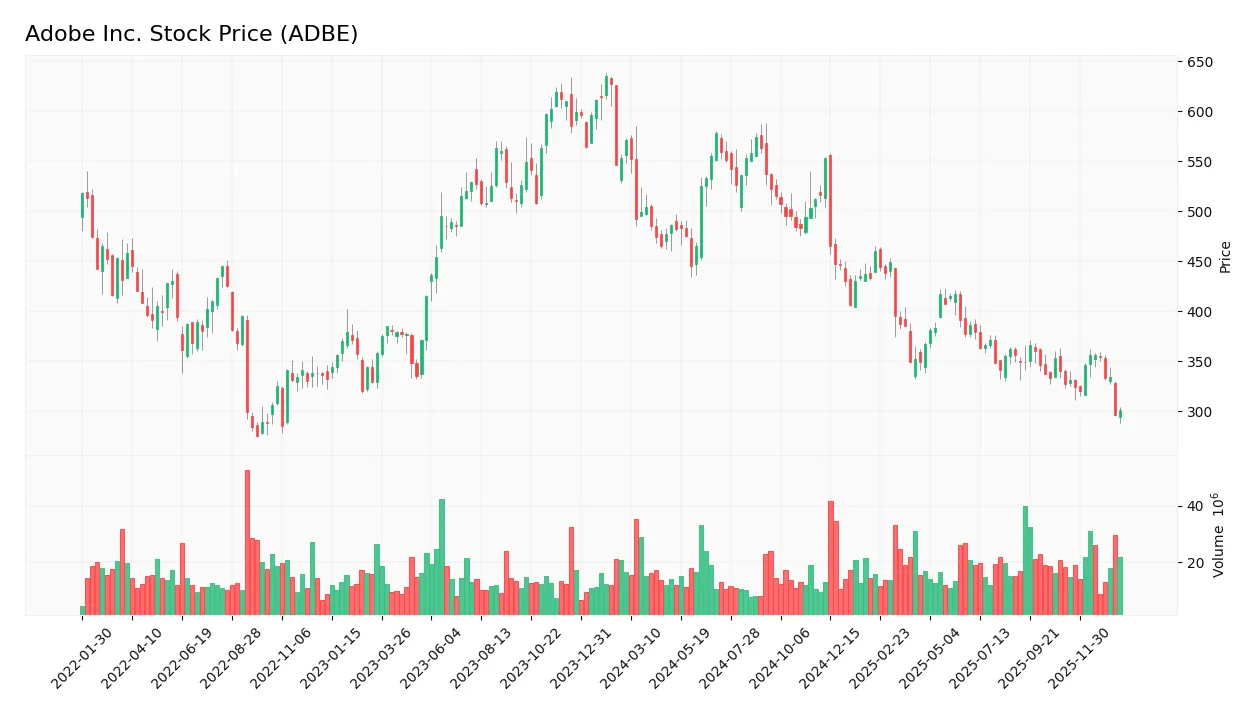
The following weekly stock chart illustrates Adobe Inc.’s price movements over the past 12 months, highlighting key highs, lows, and overall volatility trends:
Trend Analysis
Over the past 12 months, Adobe Inc. (ADBE) stock price declined by 47.27%, indicating a clear bearish trend with accelerating downward momentum. The price fluctuated between a high of 578.34 and a low of 296.12, with significant volatility reflected by a standard deviation of 78.56. Recent weeks show a continued negative slope of -1.55 and moderate volatility at 18.97.
Volume Analysis
Trading volume for Adobe has been increasing, totaling over 2B shares recently. Sellers dominate with 55.53% of volume, including in the last three months where selling pressure remains slightly stronger at 54.5%. This suggests cautious investor sentiment with persistent selling interest outweighing buying activity.
Target Prices
The consensus target prices for Adobe Inc. indicate a generally optimistic outlook among analysts.
| Target High | Target Low | Consensus |
|---|---|---|
| 500 | 280 | 399.5 |
Analysts expect Adobe’s stock to trade between $280 and $500, with an average consensus target of $399.5, reflecting moderate confidence in future growth potential.

Don’t Let Luck Decide Your Entry Point
Optimize your entry points with our advanced ProRealTime indicators. You’ll get efficient buy signals with precise price targets for maximum performance. Start outperforming now!
Analyst & Consumer Opinions
This section examines recent analyst ratings and consumer feedback regarding Adobe Inc., providing an overview of market sentiment.
Stock Grades
Here is the latest summary of Adobe Inc.’s stock grades from notable financial institutions for early 2026:
| Grading Company | Action | New Grade | Date |
|---|---|---|---|
| Oppenheimer | Downgrade | Perform | 2026-01-13 |
| BMO Capital | Downgrade | Market Perform | 2026-01-09 |
| Jefferies | Downgrade | Hold | 2026-01-05 |
| Citigroup | Maintain | Neutral | 2025-12-17 |
| BMO Capital | Maintain | Outperform | 2025-12-15 |
| Keybanc | Downgrade | Underweight | 2025-12-15 |
| TD Cowen | Maintain | Hold | 2025-12-11 |
| Morgan Stanley | Maintain | Equal Weight | 2025-12-11 |
| Jefferies | Maintain | Buy | 2025-12-11 |
| DA Davidson | Maintain | Buy | 2025-12-11 |
Recent ratings reflect a cautious shift with several downgrades to hold or market perform levels, though some firms continue to maintain buy or outperform stances, indicating mixed but generally moderate confidence across analysts.
Consumer Opinions
Consumers express a mix of admiration and constructive criticism for Adobe Inc., reflecting its influential role in creative software alongside areas needing improvement.
| Positive Reviews | Negative Reviews |
|---|---|
| Intuitive interfaces and powerful tools. | High subscription costs deter some users. |
| Frequent updates enhance functionality. | Occasional software bugs impact workflow. |
| Excellent customer support and tutorials. | Steep learning curve for beginners. |
Overall, Adobe is praised for its innovative features and strong support, but users often cite pricing and complexity as key challenges. Balancing cost and usability remains crucial for customer satisfaction.
Risk Analysis
The following table summarizes key risks associated with investing in Adobe Inc., focusing on their likelihood and potential impact:
| Category | Description | Probability | Impact |
|---|---|---|---|
| Market Volatility | Adobe’s beta of 1.526 indicates higher sensitivity to market swings, potentially increasing risk. | High | Moderate |
| Valuation Risks | Unfavorable price-to-book ratio (11.73) suggests overvaluation, which may limit upside potential. | Medium | High |
| Liquidity Concerns | Current ratio of 1.0 signals tight short-term liquidity, possibly restricting operational flexibility. | Medium | Moderate |
| Competitive Pressure | Rapid innovation in software infrastructure requires continuous investment to maintain edge. | Medium | High |
| Dividend Policy | Absence of dividends might deter income-focused investors, impacting stock attractiveness. | Low | Low |
| Debt Management | Moderate debt-to-equity ratio (0.57) with favorable debt-to-assets ratio (22.54%) shows balanced leverage. | Low | Low |
The most significant risks for Adobe stem from market volatility and valuation concerns due to its relatively high beta and elevated price-to-book ratio. Despite strong profitability and financial stability indicated by favorable ROE and Altman Z-Score, investors should remain cautious about potential market corrections and valuation adjustments.
Should You Buy Adobe Inc.?
Adobe Inc. appears to be a robust profitability profile supported by a durable competitive moat with growing returns, while its leverage profile could be seen as moderate. Overall, the company suggests a favorable financial health with an A- rating, indicating strong value creation potential.
Strength & Efficiency Pillars
Adobe Inc. stands out as a robust value creator, evidenced by a return on invested capital (ROIC) of 36.69% that comfortably exceeds its weighted average cost of capital (WACC) at 10.66%. This impressive spread underscores Adobe’s ability to generate returns above its capital costs, signaling sustainable value creation. Profitability metrics further reinforce this strength, with a net margin of 30.0% and a return on equity (ROE) of 61.34%, demonstrating exceptional operational efficiency. Financial health is solid, with an Altman Z-Score of 8.17 placing the company well within the safe zone and a Piotroski score of 6 indicating average but stable fundamentals.
Weaknesses and Drawbacks
Despite Adobe’s financial robustness, certain valuation and liquidity metrics raise caution. The company’s price-to-book ratio at 11.73 is very unfavorable, suggesting a premium valuation that may limit upside potential. The current ratio of 1.0 is on the lower boundary, indicating tight short-term liquidity and potential risk in meeting immediate obligations. Additionally, a slight seller dominance of 54.5% in the recent period, alongside a significant overall price decline of 47.27%, reflects considerable market pressure and bearish sentiment, which may weigh on near-term stock performance and investor confidence.
Our Verdict about Adobe Inc.
Adobe Inc.’s long-term fundamental profile appears favorable, supported by strong profitability and value creation metrics. However, the recent period’s seller dominance combined with the bearish price trend suggests caution. Despite the company’s underlying strength, these market pressures may imply a wait-and-see approach could be prudent for investors seeking a more attractive entry point. The profile may appear suitable for long-term exposure, but timing and risk management remain critical.
Disclaimer: This content is for informational purposes only and does not constitute financial, investment, or other professional advice. Investing in financial markets involves a significant risk of loss, and past performance is not indicative of future results.
Additional Resources
- Earnings Preview: What To Expect From Adobe’s Report – Yahoo Finance (Jan 23, 2026)
- Wealth Enhancement Advisory Services LLC Decreases Stock Holdings in Adobe Inc. $ADBE – MarketBeat (Jan 20, 2026)
- Jim Cramer Reveals Why He Might Cancel His Adobe (ADBE) Subscription – Yahoo Finance (Jan 22, 2026)
- UNIVEST FINANCIAL Corp Grows Holdings in Adobe Inc. $ADBE – MarketBeat (Jan 23, 2026)
- Adobe Inc. (ADBE) is Attracting Investor Attention: Here is What You Should Know – Yahoo Finance (Jan 21, 2026)
For more information about Adobe Inc., please visit the official website: adobe.com