Home > Analyses > Consumer Defensive > Acme United Corporation
Acme United Corporation crafts essential tools that shape everyday safety and creativity worldwide. It leads the Household & Personal Products sector with iconic brands like Westcott, Camillus, and First Aid Only, known for innovation and reliable quality. I’ve observed that its diverse portfolio spans schools, offices, and industrial markets, reinforcing steady demand. The key question: can Acme United’s solid fundamentals sustain its growth and justify its current market valuation in 2026?

Table of contents
Business Model & Company Overview
Acme United Corporation, founded in 1867 and headquartered in Shelton, Connecticut, dominates the Household & Personal Products sector. Its portfolio forms a cohesive ecosystem of cutting, measuring, and first aid products spanning school, office, and industrial markets. The company’s brands—Westcott, Clauss, Camillus, and others—deliver precision tools and safety solutions that resonate strongly with diverse consumer needs.
The company’s revenue engine balances durable hardware like scissors and knives with recurring sales of first aid kits and safety supplies. Acme commands strategic presence across North America and Europe, leveraging direct sales and broad retail partnerships. Its competitive advantage lies in blending trusted brands with global reach, creating a durable economic moat that shapes industry standards and customer loyalty.
Financial Performance & Fundamental Metrics
I will analyze Acme United Corporation’s income statement, key financial ratios, and dividend payout policy to assess its profitability and financial health.
Income Statement
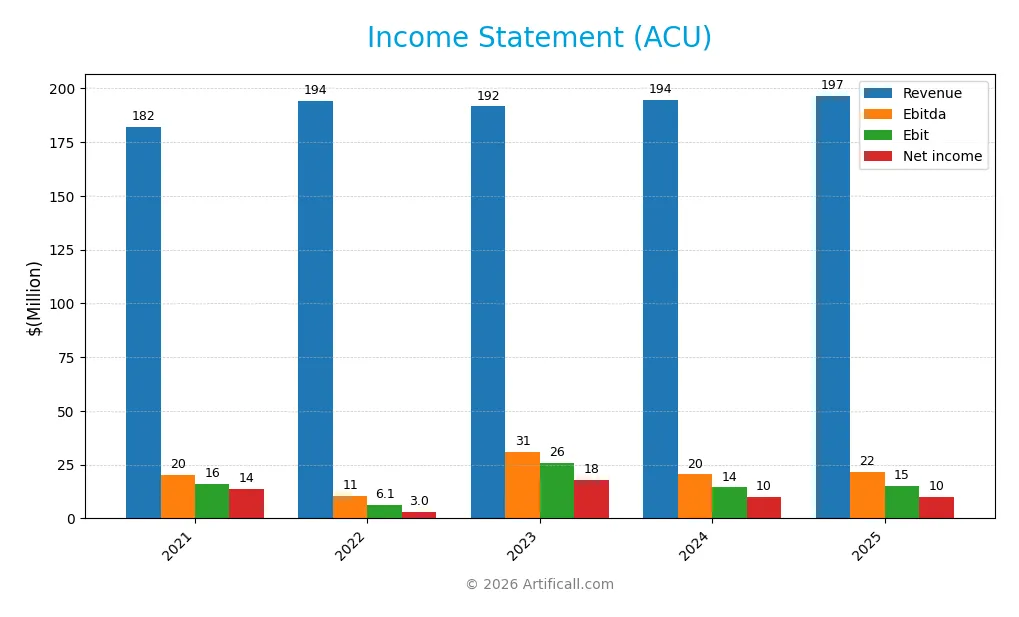
The table summarizes Acme United Corporation’s key income statement figures for fiscal years 2021 through 2025 in USD.
| 2021 | 2022 | 2023 | 2024 | 2025 | |
|---|---|---|---|---|---|
| Revenue | 182.1M | 194.0M | 191.5M | 194.5M | 196.5M |
| Cost of Revenue | 117.3M | 130.4M | 119.3M | 118.1M | 119.1M |
| Operating Expenses | 52.0M | 57.3M | 59.0M | 62.2M | 62.7M |
| Gross Profit | 64.8M | 63.6M | 72.2M | 76.4M | 77.4M |
| EBITDA | 20.3M | 10.6M | 30.9M | 20.4M | 21.6M |
| EBIT | 16.1M | 6.1M | 25.8M | 14.4M | 15.2M |
| Interest Expense | 0.9M | 2.4M | 3.1M | 2.1M | 1.7M |
| Net Income | 13.7M | 3.0M | 17.8M | 10.0M | 10.2M |
| EPS | 3.93 | 0.86 | 4.98 | 2.71 | 2.69 |
| Filing Date | 2022-03-30 | 2023-03-10 | 2024-03-07 | 2025-03-06 | 2026-03-11 |
Income Statement Evolution
Acme United’s revenue showed modest growth, rising 1.06% in 2025 after a 7.94% increase over five years. Net income declined sharply over the period, down 25.42%. Gross margin remained steady near 39.4%, while EBIT margin was neutral at 7.75%. Net margin held favorably at 5.18%, indicating controlled costs despite slower revenue gains.
Is the Income Statement Favorable?
In 2025, fundamentals appear generally favorable. Revenue increased slightly, while EBIT grew 5.9%, signaling improved operating efficiency. Interest expense was low at 0.86% of revenue, supporting net margin stability. However, net income and EPS growth remain neutral, reflecting some pressure on profitability. Overall, the income statement shows resilience but warrants attention to margin trends.
Financial Ratios
The table below presents key financial ratios for Acme United Corporation over the last five fiscal years, offering insight into profitability, leverage, liquidity, and market valuation:
| Ratios | 2021 | 2022 | 2023 | 2024 | 2025 |
|---|---|---|---|---|---|
| Net Margin | 7.5% | 1.6% | 9.3% | 5.2% | 5.2% |
| ROE | 17.7% | 3.8% | 18.2% | 9.4% | 8.7% |
| ROIC | 9.2% | 3.6% | 8.3% | 8.2% | 7.5% |
| P/E | 8.6 | 25.5 | 8.8 | 13.8 | 15.0 |
| P/B | 1.5 | 1.0 | 1.6 | 1.3 | 1.3 |
| Current Ratio | 4.7 | 4.8 | 3.5 | 4.2 | 4.2 |
| Quick Ratio | 2.1 | 1.9 | 1.4 | 1.7 | 4.2 |
| D/E | 0.6 | 0.8 | 0.3 | 0.3 | 0.2 |
| Debt-to-Assets | 33% | 39% | 17% | 20% | 16% |
| Interest Coverage | 13.9 | 2.6 | 4.3 | 6.8 | 8.7 |
| Asset Turnover | 1.3 | 1.2 | 1.3 | 1.2 | 1.1 |
| Fixed Asset Turnover | 6.7 | 6.7 | 6.4 | 5.3 | 4.3 |
| Dividend Yield | 1.5% | 2.5% | 1.3% | 1.6% | 1.5% |
Evolution of Financial Ratios
Return on Equity (ROE) declined from about 18% in 2023 to 8.66% in 2025, signaling decreased shareholder profitability. The Current Ratio remained high, above 4.0, indicating strong short-term liquidity but potential inefficiency. Debt-to-Equity Ratio improved, falling to 0.24 in 2025, reflecting a more conservative leverage stance. Profit margins stabilized near 5%.
Are the Financial Ratios Favorable?
Most 2025 ratios indicate a favorable financial position. Profitability is neutral, with net margin at 5.18% and ROIC near WACC, suggesting limited value creation. Liquidity shows mixed signals: an unfavorable Current Ratio but a favorable Quick Ratio. Leverage is conservative with a debt-to-equity of 0.24 and strong interest coverage. Market multiples like P/E and P/B ratios are favorable, supporting a positive valuation outlook overall.
Shareholder Return Policy
Acme United Corporation maintains a consistent dividend policy with a payout ratio around 23% and dividend per share rising from $0.52 in 2021 to $0.62 in 2025. The annual dividend yield averages near 1.5%, supported by moderate free cash flow coverage and occasional share buybacks.
This balanced approach manages distribution prudently, avoiding excessive repurchases or unsustainable payouts. It aligns with sustainable long-term value creation by preserving capital for operations and growth, while returning steady income to shareholders.
Score analysis
Below is a radar chart illustrating Acme United Corporation’s key financial scores for valuation and profitability:
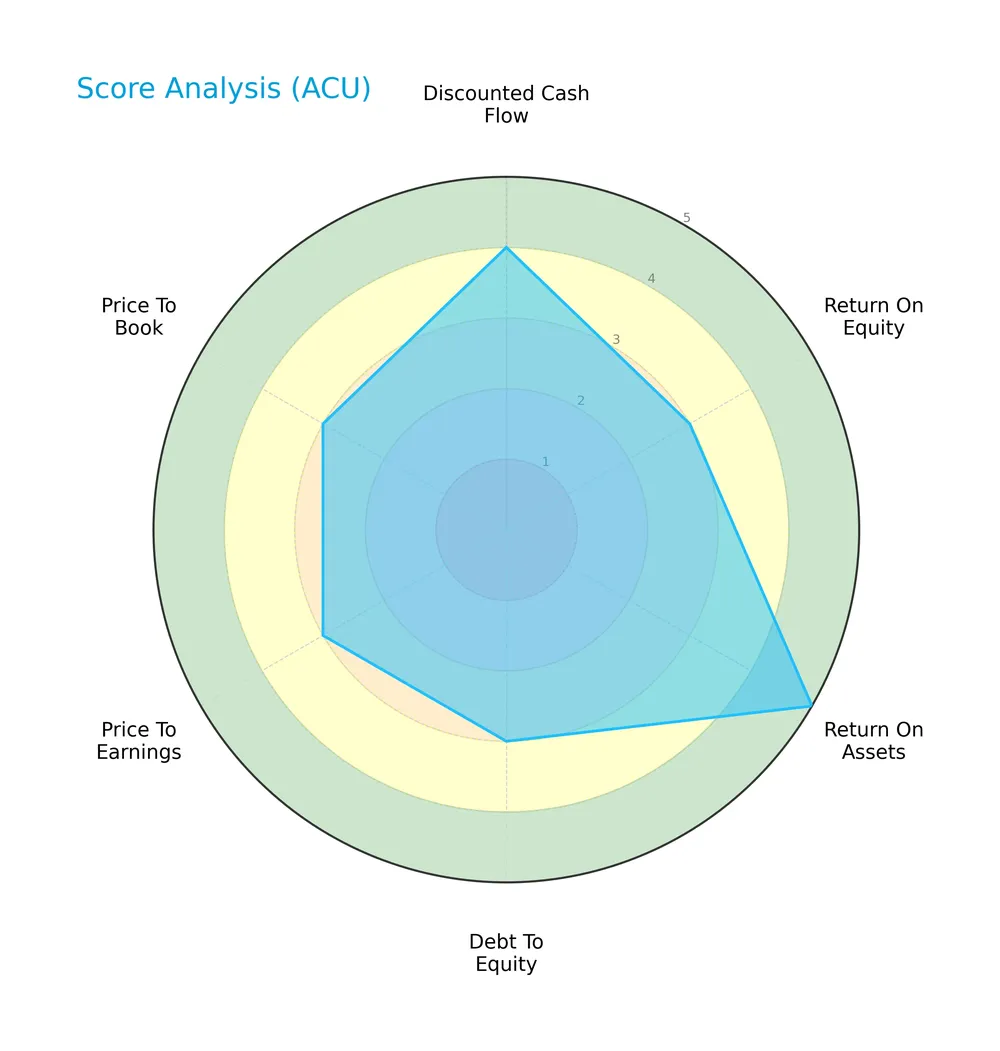
Acme’s discounted cash flow and return on assets scores stand out as very favorable at 4 and 5, respectively. Return on equity, debt to equity, price to earnings, and price to book scores are moderate, reflecting balanced financial metrics.
Analysis of the company’s bankruptcy risk
The Altman Z-Score places Acme comfortably in the safe zone, indicating very low bankruptcy risk based on its financial ratios:

Is the company in good financial health?
The Piotroski Score diagram highlights Acme’s strong financial health with a score of 7, signaling solid profitability and operational efficiency:

A score of 7 suggests Acme maintains good financial strength, positioning it well compared to average industry standards.
Competitive Landscape & Sector Positioning
This section analyzes Acme United Corporation’s strategic position within the Household & Personal Products sector. It covers revenue by segment, key products, and main competitors. I will assess whether Acme United holds a competitive advantage over its peers.
Strategic Positioning
Acme United Corporation maintains a diversified product portfolio across first aid, cutting, and measuring tools. Its revenue predominantly stems from the United States (165M in 2025), with stable contributions from Canada (15M) and Europe (16M), reflecting moderate geographic diversification within North America and Europe.
Revenue by Segment
The pie chart illustrates Acme United Corporation’s revenue breakdown by product segment for the fiscal year 2025, highlighting the relative size of each segment’s contribution.
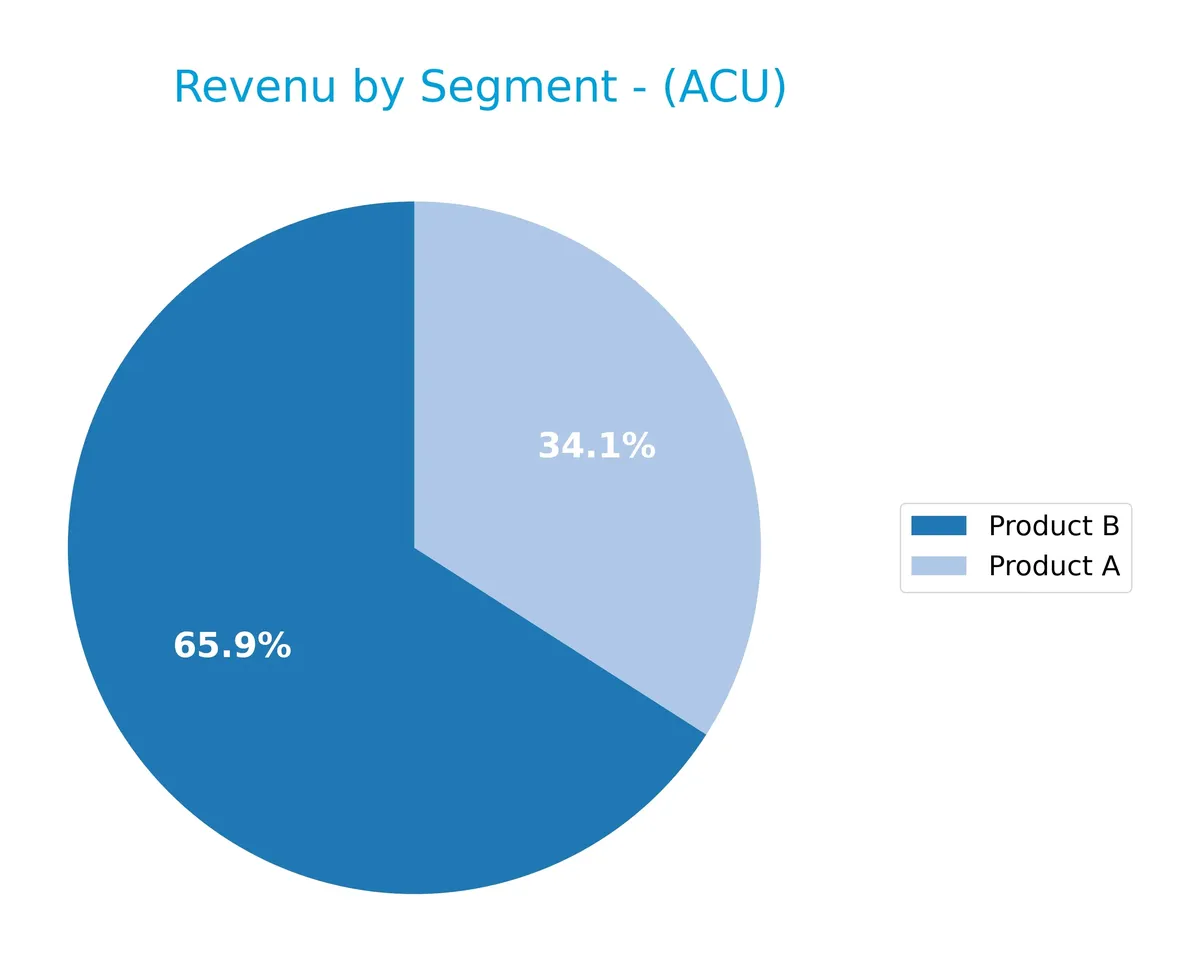
Product B drives the business with $130M in revenue for 2025, showing consistent growth since 2020. Product A’s revenue declined to $67M, continuing a downtrend from its 2021 peak near $91M. This shift signals increasing dependence on Product B, raising concentration risk if diversification does not improve. Overall, the business focus appears to be moving toward the higher-growth segment.
Key Products & Brands
The following table outlines Acme United Corporation’s principal products and brand descriptions:
| Product | Description |
|---|---|
| Westcott | Scissors, shears, knives, rulers, pencil sharpeners, paper trimmers, safety cutters, and craft products. |
| Clauss | Cutting tools. |
| Camillus | Fixed blades, folding knives, sight cutting tools, and tactical tools. |
| Cuda | Fishing tools and knives, cut and puncture resistant gloves, telescopic landing nets, and fishing gaffs. |
| DMT | Sharpening tools. |
| First Aid Only | First aid kits and safety solutions. |
| PhysiciansCare | Portable eyewash solutions and over-the-counter medications including aspirin, acetaminophen, and ibuprofen. |
| Spill Magic | Bodily fluid and spill clean-up solutions. |
| First Aid Central | Various first aid kit refills and safety supplies such as CPR kits, burn kits, and emergency kits. |
| Med-Nap | Alcohol prep pads, alcohol wipes, benzalkonium chloride wipes, antiseptic wipes, castile soaps, lens wipes. |
Acme United’s portfolio spans diverse household and personal products with well-established brands in cutting tools, first aid, and safety markets internationally. This breadth supports stable revenue streams across multiple end markets.
Main Competitors
Seventeen competitors operate in the Consumer Defensive sector; the table lists the top 10 leaders by market capitalization:
| Competitor | Market Cap. |
|---|---|
| The Procter & Gamble Company | 331.3B |
| Unilever PLC | 143.2B |
| Colgate-Palmolive Company | 62.6B |
| The Estée Lauder Companies Inc. | 38.5B |
| Kimberly-Clark Corporation | 33.7B |
| Kenvue Inc. | 33.2B |
| Church & Dwight Co., Inc. | 20.2B |
| The Clorox Company | 12.3B |
| e.l.f. Beauty, Inc. | 4.3B |
| Inter Parfums, Inc. | 2.7B |
Acme United Corporation ranks 17th among 17 competitors with a market cap just 0.05% of the leader’s. It sits well below both the average market cap of the top 10 (68.2B) and the sector median (4.3B). The company’s market cap is 185.55% smaller than the closest competitor above, highlighting a significant scale gap.
Comparisons with competitors
Check out how we compare the company to its competitors:
Does ACU have a competitive advantage?
Acme United Corporation currently lacks a strong competitive advantage, as its return on invested capital underperforms its cost of capital, indicating value erosion. The company’s profitability declined over 2021-2025, reflecting challenges in sustaining economic profits.
Looking ahead, Acme United’s diverse product range across safety, cutting, and first aid markets offers expansion potential in North America and Europe. New product introductions and market penetration could present growth opportunities despite current profitability pressures.
SWOT Analysis
This analysis identifies Acme United Corporation’s key strategic factors to guide investment decisions.
Strengths
- diversified product portfolio
- strong brands with Westcott and Clauss
- favorable gross margin at 39.4%
Weaknesses
- declining ROIC trend signals value erosion
- net income down 25% over 5 years
- moderate ROE at 8.7% below sector average
Opportunities
- expanding international sales in Europe and Canada
- growing demand for safety and first aid products
- e-commerce channel growth potential
Threats
- intense competition in household products
- currency risks from international markets
- margin pressure from raw material costs
Acme’s solid brand portfolio and healthy gross margins provide a sturdy base. Yet, declining profitability and earnings pose challenges. Growth hinges on international expansion and digital sales, but competition and cost pressures require vigilant management.
Stock Price Action Analysis
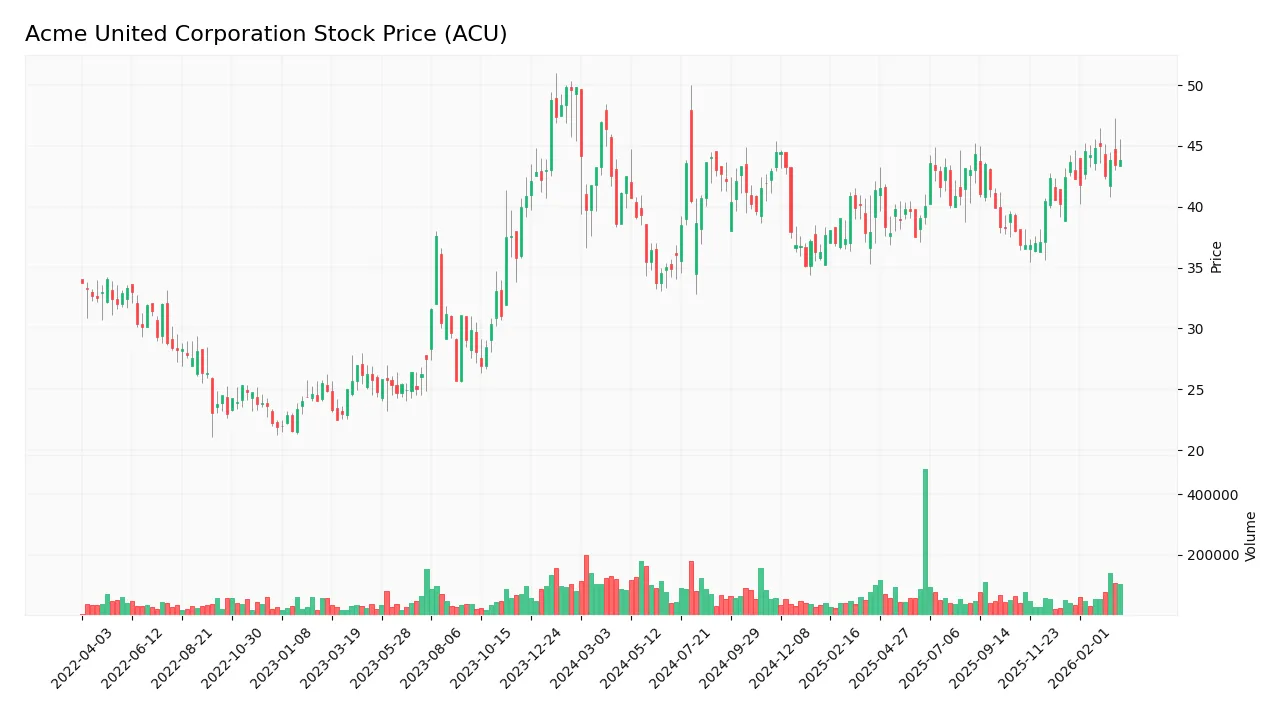
The weekly stock chart below illustrates Acme United Corporation’s price movements over the past 12 weeks, highlighting key trends and price fluctuations:
Trend Analysis
Over the past 12 weeks, ACU’s stock price rose 3.08%, indicating a bullish trend with accelerating momentum. The price fluctuated between a low of 33.7 and a high of 45.01. Volatility is moderate, with a standard deviation of 2.8, reflecting steady upward pressure on the stock.
Volume Analysis
Trading volumes over the last three months show a buyer-dominant market with 55.7% of total volume attributed to buyers. However, overall volume is decreasing, suggesting waning market participation despite persistent bullish sentiment. This decline may caution investors about the sustainability of current price moves.
Target Prices
No verified target price data is available from recognized analysts for Acme United Corporation. Market sentiment remains unclear due to the lack of consensus estimates.

Don’t Let Luck Decide Your Entry Point
Optimize your entry points with our advanced ProRealTime indicators. You’ll get efficient buy signals with precise price targets for maximum performance. Start outperforming now!
Analyst & Consumer Opinions
This section examines recent analyst ratings and consumer feedback related to Acme United Corporation (ACU).
Stock Grades
The latest verified stock grades for Acme United Corporation reveal consistent analyst confidence as follows:
| Grading Company | Action | New Grade | Date |
|---|---|---|---|
| DA Davidson | Maintain | Buy | 2016-07-01 |
The sole available grade is a maintained Buy from DA Davidson dated 2016, aligning with the consensus Buy rating. No recent updates or divergent opinions are present, indicating stable but dated analyst sentiment.
Consumer Opinions
Acme United Corporation draws a mix of praise and criticism from its user base, reflecting its market position and product quality.
| Positive Reviews | Negative Reviews |
|---|---|
| Durable products that last long | Shipping delays affect satisfaction |
| Excellent customer service responsiveness | Limited product variety in some categories |
| Competitive pricing compared to peers | Packaging could be more eco-friendly |
Overall, consumers appreciate Acme United’s durability and service but express frustration with logistics and product range limitations. These factors influence repeat purchase decisions and brand loyalty.
Risk Analysis
Below is a summary table outlining the key risks facing Acme United Corporation:
| Category | Description | Probability | Impact |
|---|---|---|---|
| Financial Health | Moderate ROE and current ratio concerns may affect capital use. | Medium | Medium |
| Market Volatility | Beta of 0.695 indicates below-average stock price sensitivity. | Low | Low |
| Operational | Supply chain disruption could impair product availability. | Medium | High |
| Competitive | Intense competition in household products could pressure margins. | High | Medium |
| Regulatory | Compliance risks in international markets may increase costs. | Low | Medium |
The most pressing risks are competitive pressure and potential supply chain disruptions. Acme’s moderate ROE signals capital efficiency below peers. Its strong Altman Z-score and Piotroski score mitigate bankruptcy concerns but do not eliminate operational risks. Vigilance is essential.
Should You Buy Acme United Corporation?
Acme United appears to be a profitable company with moderate operational efficiency but a slightly unfavorable competitive moat, reflecting declining value creation. Despite manageable leverage, its overall very favorable A- rating suggests a cautiously optimistic financial profile for investors.
Strength & Efficiency Pillars
Acme United Corporation operates with solid operational efficiency, demonstrated by a favorable gross margin of 39.39% and a net margin of 5.18%. Its return on invested capital (ROIC) stands at 7.46%, slightly above its weighted average cost of capital (WACC) at 6.99%, indicating modest value creation. Although return on equity (ROE) is a weak 8.66%, the company maintains strong asset turnover (1.13), supporting effective use of its asset base. The Piotroski Score of 7 further confirms robust financial health.
Weaknesses and Drawbacks
Despite these strengths, Acme United shows some critical vulnerabilities. Revenue growth over one year is weak at 1.06%, and net income has declined by 25.42% over the last five years, reflecting operational challenges. While valuation metrics appear reasonable—P/E at 14.99 and P/B at 1.3—the current ratio is unusually high at 4.21, which may signal inefficient capital utilization or excess liquidity. Moderate debt levels (Debt-to-Equity 0.24) and strong interest coverage (9.05) mitigate leverage concerns but warrant close monitoring.
Our Final Verdict about Acme United Corporation
The company exhibits stable fundamentals with a favorable Altman Z-Score (2122.6, safe zone) and strong Piotroski score, suggesting financial resilience. The bullish overall stock trend and recent buyer dominance (61.5%) imply potential momentum. However, sluggish revenue growth and declining profitability over the longer term suggest caution. Acme United may appear attractive for long-term exposure but could benefit from a cautious entry considering uneven earnings trends.
Disclaimer: This content is for informational purposes only and does not constitute financial, investment, or other professional advice. Investing in financial markets involves a significant risk of loss, and past performance is not indicative of future results.
Additional Resources
- How Acme United Corporation. (ACU) Affects Rotational Strategy Timing – Stock Traders Daily (Mar 28, 2026)
- [ARS] ACME UNITED CORP SEC Filing – Stock Titan (Mar 27, 2026)
- Are Consumer Discretionary Stocks Lagging Acme United (ACU) This Year? – Yahoo Finance (Mar 17, 2026)
- Acme United Corporation 2025 Q4 – Results – Earnings Call Presentation (NYSE:ACU) 2026-02-26 – Seeking Alpha (Feb 26, 2026)
- Executive pay, stock plan and auditor up for vote at Acme United (ACU) – Stock Titan (Mar 27, 2026)
For more information about Acme United Corporation, please visit the official website: acmeunited.com