Home > Analyses > Technology > Accenture plc
Accenture plc revolutionizes how businesses harness technology and innovation to transform their operations and customer experiences worldwide. As a powerhouse in information technology services, Accenture excels in strategy consulting, digital transformation, intelligent automation, and cybersecurity, making it a trusted partner for Fortune 500 companies. With a legacy of quality and forward-thinking solutions, the question remains: does Accenture’s robust market position and evolving service portfolio continue to justify its premium valuation and growth prospects?

Table of contents
Business Model & Company Overview
Accenture plc, founded in 1951 and headquartered in Dublin, Ireland, stands as a global leader in Information Technology Services. With a workforce of 801K employees, it delivers an integrated ecosystem of strategy, consulting, technology, and operations services designed to drive digital transformation and business innovation across industries. The company’s expansive portfolio spans agile application services, intelligent automation, and cybersecurity, establishing a robust core mission to enable clients’ competitive edge in a rapidly evolving digital landscape.
The company’s revenue engine balances high-value consulting and recurring technology services, including cloud infrastructure, AI, and managed security solutions. Accenture’s global footprint covers the Americas, Europe, and Asia, optimizing delivery across key markets. Its ability to integrate digital innovation with operational expertise creates a formidable economic moat, securing its role as a pivotal force shaping the future of enterprise technology and consulting worldwide.
Financial Performance & Fundamental Metrics
In this section, I analyze Accenture plc’s income statement, key financial ratios, and dividend payout policy to assess its overall financial health and stability.
Income Statement
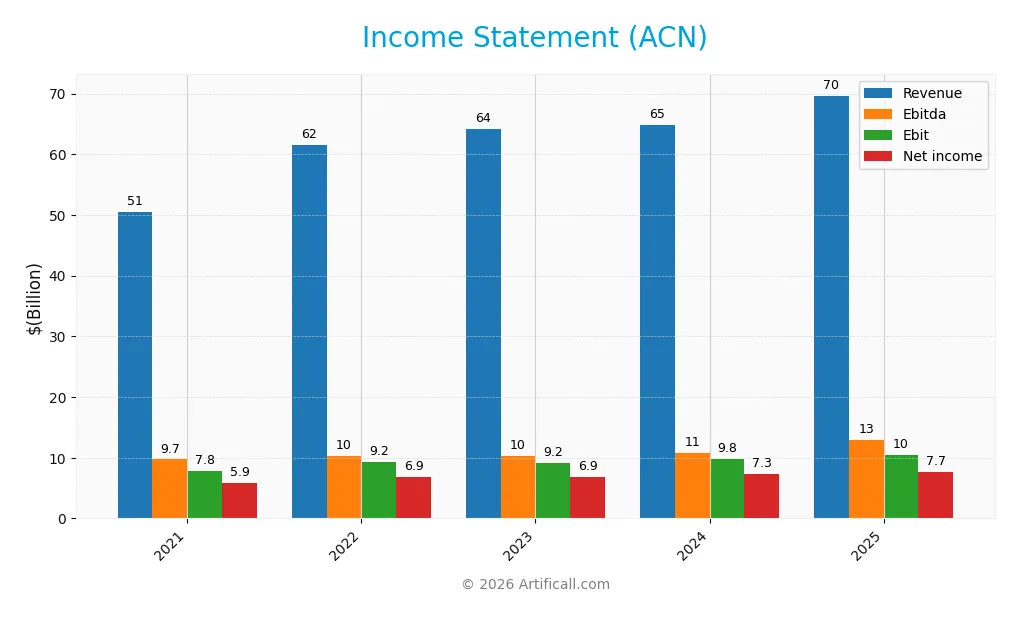
The table below summarizes Accenture plc’s key income statement figures for the fiscal years 2021 through 2025, presented in USD.
| 2021 | 2022 | 2023 | 2024 | 2025 | |
|---|---|---|---|---|---|
| Revenue | 50.5B | 61.6B | 64.1B | 64.9B | 69.7B |
| Cost of Revenue | 34.2B | 41.9B | 43.4B | 43.7B | 47.4B |
| Operating Expenses | 8.7B | 10.3B | 11.9B | 11.6B | 12.0B |
| Gross Profit | 16.4B | 19.7B | 20.7B | 21.2B | 22.2B |
| EBITDA | 9.7B | 10.3B | 10.2B | 10.8B | 12.9B |
| EBIT | 7.8B | 9.2B | 9.2B | 9.8B | 10.5B |
| Interest Expense | 59M | 47M | 48M | 59M | 229M |
| Net Income | 5.9B | 6.9B | 6.9B | 7.3B | 7.7B |
| EPS | 9.31 | 10.87 | 10.9 | 11.57 | 12.29 |
| Filing Date | 2021-10-15 | 2022-10-12 | 2023-10-12 | 2024-10-10 | 2025-10-10 |
Income Statement Evolution
Accenture plc’s revenue grew steadily by 37.88% from 2021 to 2025, with a 7.36% increase in the most recent year, signaling ongoing top-line expansion. Net income rose 29.99% over the full period, though net margin declined by 5.72%, indicating some margin pressure despite favorable gross and EBIT margin stability.
Is the Income Statement Favorable?
In fiscal 2025, Accenture delivered a revenue of $69.7B and net income of $7.7B, reflecting solid operational performance. Key margins remain favorable: gross margin at 31.91%, EBIT margin at 15.07%, and net margin at 11.02%. While net margin dipped slightly year-over-year, overall fundamentals are assessed as favorable, supported by consistent EBITDA growth and controlled interest expenses.
Financial Ratios
The table below presents key financial ratios for Accenture plc over the fiscal years 2021 to 2025, offering insight into profitability, valuation, liquidity, leverage, and operational efficiency:
| Ratios | 2021 | 2022 | 2023 | 2024 | 2025 |
|---|---|---|---|---|---|
| Net Margin | 12% | 11% | 11% | 11% | 11% |
| ROE | 30% | 31% | 27% | 26% | 25% |
| ROIC | 21% | 23% | 20% | 19% | 17% |
| P/E | 36.2 | 26.5 | 29.7 | 29.6 | 21.2 |
| P/B | 10.9 | 8.3 | 7.9 | 7.6 | 5.2 |
| Current Ratio | 1.25 | 1.23 | 1.30 | 1.10 | 1.42 |
| Quick Ratio | 1.25 | 1.23 | 1.30 | 1.10 | 1.42 |
| D/E | 0.18 | 0.15 | 0.12 | 0.15 | 0.26 |
| Debt-to-Assets | 8.1% | 7.0% | 6.1% | 7.4% | 12.5% |
| Interest Coverage | 128.1 | 198.0 | 185.4 | 162.7 | 44.7 |
| Asset Turnover | 1.17 | 1.30 | 1.25 | 1.16 | 1.07 |
| Fixed Asset Turnover | 10.5 | 13.2 | 15.4 | 15.2 | 16.2 |
| Dividend Yield | 1.0% | 1.3% | 1.4% | 1.5% | 2.3% |
Evolution of Financial Ratios
From 2021 to 2025, Accenture’s Return on Equity (ROE) showed a downward trend, declining from 30.25% to 24.61%. The Current Ratio improved from 1.25 in 2021 to 1.42 in 2025, indicating enhanced short-term liquidity. The Debt-to-Equity Ratio increased slightly from 0.18 in 2021 to 0.26 in 2025, signaling a modest rise in leverage. Profitability margins remained relatively stable with net profit margin around 11%.
Are the Financial Ratios Favorable?
In 2025, Accenture’s profitability ratios, including a net margin of 11.02% and ROE of 24.61%, are favorable, reflecting solid earnings performance. Liquidity is neutral to favorable with a Current Ratio of 1.42 and Quick Ratio also at 1.42. Leverage ratios are favorable with Debt-to-Equity at 0.26 and Debt-to-Assets at 12.51%. Market valuation ratios like P/E at 21.16 are neutral, while Price-to-Book at 5.21 is unfavorable. Overall, 71.43% of key ratios are favorable, suggesting a generally positive financial profile.
Shareholder Return Policy
Accenture plc maintains a consistent dividend payout ratio around 38-48%, with dividends per share rising from $3.52 in 2021 to $5.92 in 2025, yielding approximately 2.28% annually. Share buybacks also form part of its capital return strategy, supported by strong free cash flow coverage near 95%.
This balanced distribution approach, combining dividends and buybacks, appears sustainable given the company’s solid profitability and cash flow metrics. The policy aligns with prudent risk management, supporting long-term shareholder value without overextending financial resources.
Score analysis
The following radar chart presents an overview of Accenture plc’s key financial scores based on valuation and profitability metrics:
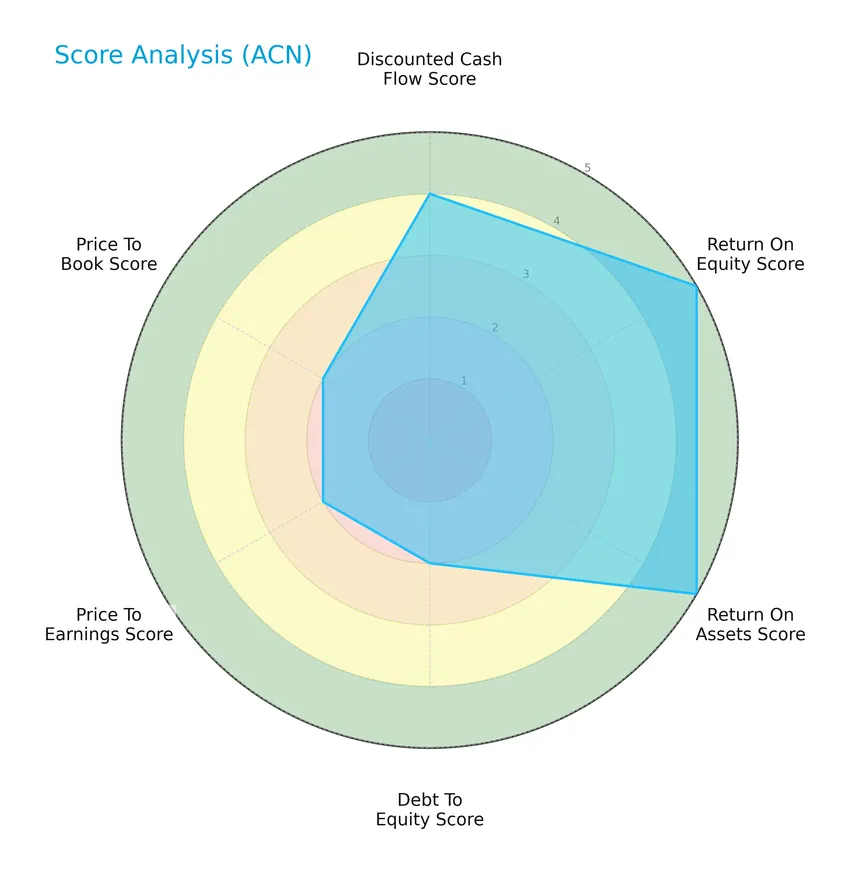
Accenture shows very favorable profitability with high scores in return on equity and assets (5 each). However, valuation and leverage metrics such as debt-to-equity, price-to-earnings, and price-to-book scores are moderate, reflecting some caution in these areas.
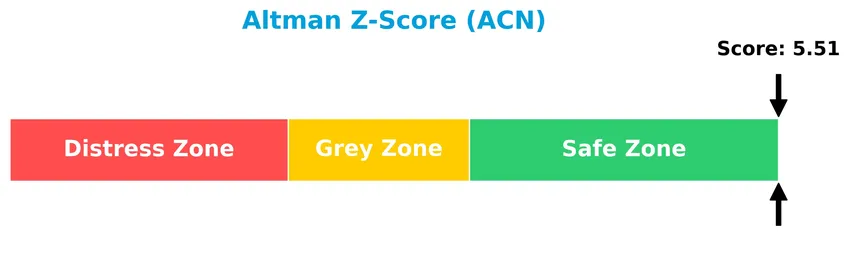
Analysis of the company’s bankruptcy risk
Accenture’s Altman Z-Score indicates the company is in the safe zone, suggesting a low risk of bankruptcy and solid financial stability:
Is the company in good financial health?
The Piotroski Score diagram illustrates Accenture’s financial health based on profitability, liquidity, and efficiency indicators:

With a Piotroski Score of 6, Accenture is classified as average in financial strength, indicating moderate but not exceptional financial robustness according to this metric.
Competitive Landscape & Sector Positioning
This section provides an overview of the sector in which Accenture plc operates, focusing on its strategic positioning and revenue segmentation. I will analyze the company’s key products and main competitors to assess its market standing. Additionally, I will attempt to determine whether Accenture holds a competitive advantage over its peers.
Strategic Positioning
Accenture plc maintains a diversified product portfolio spanning consulting, outsourcing, technology, and industry-specific services, generating over $69B in combined consulting and outsourcing revenues in 2025. Geographically, it operates globally with strong revenue contributions from North America ($30B), Europe ($21B), and Growth Markets ($12.5B) as of 2023.
Revenue by Segment
This pie chart illustrates Accenture plc’s revenue breakdown by segment for the fiscal year 2025.
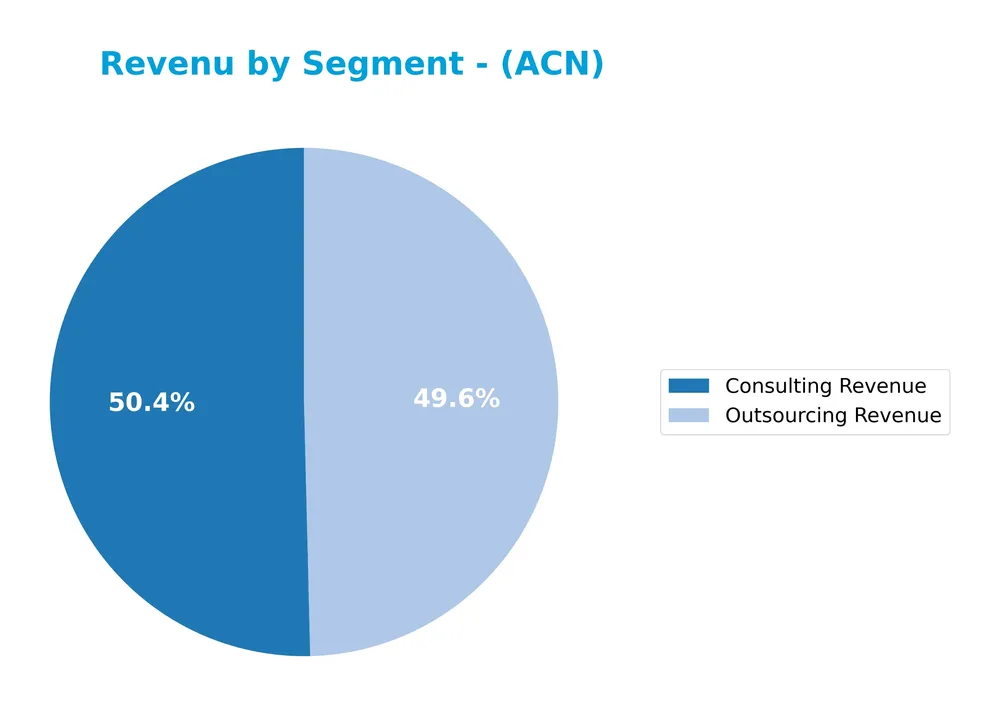
In 2025, Accenture’s revenue was primarily driven by Consulting and Outsourcing, generating $35.1B and $34.6B respectively. These two segments dominate the business, showing consistent growth over recent years. The balance between Consulting and Outsourcing revenues has remained stable, indicating a well-diversified service offering. The most recent year shows continued strength and concentration in these core segments, with no notable shifts away from this dual-segment focus.
Key Products & Brands
The table below presents Accenture plc’s main products and services along with their descriptions:
| Product | Description |
|---|---|
| Consulting Services | Strategy consulting, technology and operations consulting, including agile transformation, DevOps, application modernization, and AI. |
| Outsourcing Services | Managed services for IT infrastructure, cloud, network, digital workplace, cybersecurity, and industry-specific outsourcing solutions. |
| Products | Software and technology products supporting various industries, including digital commerce, supply chain, finance consulting, and more. |
| Health & Public Service | Consulting and technology services tailored for healthcare and public sector clients. |
| Financial Services | Specialized consulting and technology solutions for banking, insurance, and capital markets sectors. |
| Communications, Media & Technology | Services and products for clients in communications, media, and technology industries. |
| Resources | Services for clients in energy, utilities, chemicals, and natural resources sectors. |
Accenture’s portfolio spans consulting and outsourcing services with significant revenue generated from technology and industry-specific solutions, reflecting its broad presence in IT services and professional consulting globally.
Main Competitors
The Technology sector includes 16 competitors, with the table below showing the top 10 leaders by market capitalization:
| Competitor | Market Cap. |
|---|---|
| International Business Machines Corporation | 272B |
| Accenture plc | 162B |
| Cognizant Technology Solutions Corporation | 40B |
| Fiserv, Inc. | 36B |
| Fidelity National Information Services, Inc. | 34B |
| Wipro Limited | 30B |
| Leidos Holdings, Inc. | 23B |
| Gartner, Inc. | 18B |
| CDW Corporation | 17B |
| Jack Henry & Associates, Inc. | 13B |
Accenture plc ranks 2nd among 16 competitors, holding approximately 64% of the market cap of the top player, IBM. It stands above both the average market cap of the top 10 competitors (64.6B) and the median market cap in the sector (17.8B). The company maintains a significant 56% market cap gap from its closest larger rival.
Comparisons with competitors
Check out how we compare the company to its competitors:
Does ACN have a competitive advantage?
Accenture plc demonstrates a competitive advantage, as it consistently creates value with an ROIC exceeding its WACC by 7.56%, indicating efficient capital use and favorable profitability despite a declining ROIC trend. The company’s income statement shows favorable margins and growth across key metrics, supporting its ability to maintain a competitive position in the information technology services sector.
Looking ahead, Accenture’s broad service portfolio—including digital transformation, AI, cloud, cybersecurity, and sustainability consulting—positions it to capitalize on emerging markets and evolving technology demands. Continued expansion in Europe, North America, and growth markets further supports potential revenue growth and diversification opportunities.
SWOT Analysis
This SWOT analysis highlights key internal and external factors influencing Accenture plc’s strategic positioning and investment appeal.
Strengths
- Strong global presence with $174B market cap
- Diverse service portfolio including AI, cloud, and cybersecurity
- Robust financials with favorable margins and high ROE
Weaknesses
- Declining ROIC trend signals profitability pressure
- High price-to-book ratio suggests overvaluation risk
- Net margin slightly decreasing over recent years
Opportunities
- Expansion in Growth Markets with rising IT demand
- Increasing digital transformation needs across industries
- Innovation in autonomous robotics and intelligent automation
Threats
- Intense competition in IT consulting and services
- Rapid technological change requiring continuous investment
- Geopolitical risks impacting global operations
Overall, Accenture demonstrates strong market leadership and financial health, yet faces margin pressure and valuation concerns. The company’s strategy should focus on leveraging growth markets and innovation while managing competitive and geopolitical risks prudently.
Stock Price Action Analysis
The weekly stock chart below illustrates Accenture plc’s price movements over the last 100 weeks, highlighting key highs, lows, and recent trend shifts:
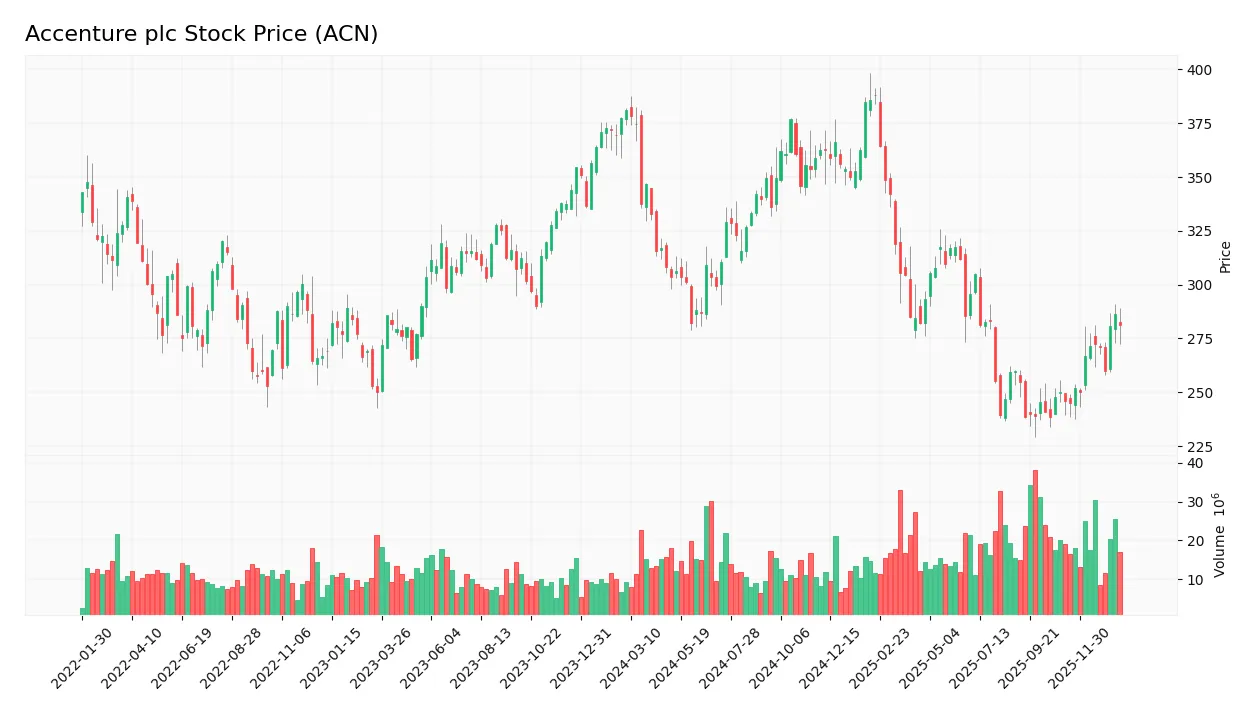
Trend Analysis
Over the past 12 months, Accenture’s stock price declined by 26.23%, indicating a bearish trend with acceleration. The price ranged between a high of 388.0 and a low of 238.39, accompanied by high volatility with a standard deviation of 42.34. However, from November 9, 2025, to January 25, 2026, the stock gained 14.37%, showing a short-term bullish acceleration.
Volume Analysis
In the last three months, trading volume has been increasing, with buyer volume at 136.5M versus seller volume at 85.2M, reflecting a buyer-dominant market. This suggests growing investor interest and positive sentiment during this recent period, contrasting with a nearly balanced overall volume distribution year-to-date.
Target Prices
The consensus among analysts for Accenture plc (ACN) indicates a positive outlook with a solid range of target prices.
| Target High | Target Low | Consensus |
|---|---|---|
| 330 | 265 | 302.93 |
Analysts expect Accenture’s stock price to trade between 265 and 330, with a consensus target near 303, reflecting confidence in its growth potential.

Don’t Let Luck Decide Your Entry Point
Optimize your entry points with our advanced ProRealTime indicators. You’ll get efficient buy signals with precise price targets for maximum performance. Start outperforming now!
Analyst & Consumer Opinions
This section presents an analysis of Accenture plc’s recent analyst ratings and consumer feedback trends.
Stock Grades
Here is a summary of recent verified stock grades for Accenture plc from leading financial institutions:
| Grading Company | Action | New Grade | Date |
|---|---|---|---|
| Wells Fargo | Maintain | Equal Weight | 2026-01-14 |
| RBC Capital | Maintain | Outperform | 2025-12-19 |
| Susquehanna | Maintain | Neutral | 2025-12-19 |
| UBS | Maintain | Buy | 2025-12-19 |
| Morgan Stanley | Upgrade | Overweight | 2025-12-16 |
| Mizuho | Maintain | Outperform | 2025-09-29 |
| TD Cowen | Maintain | Buy | 2025-09-26 |
| Guggenheim | Maintain | Buy | 2025-09-26 |
| Baird | Maintain | Outperform | 2025-09-26 |
| RBC Capital | Maintain | Outperform | 2025-09-26 |
The overall trend reflects a predominantly positive outlook with multiple firms maintaining Buy or Outperform ratings, and one recent upgrade to Overweight. This suggests confidence in Accenture’s performance with moderate consensus towards buying or holding the stock.
Consumer Opinions
Consumers of Accenture plc generally appreciate the company’s innovative approach and professional services, though some express concerns about pricing and project timelines.
| Positive Reviews | Negative Reviews |
|---|---|
| “Accenture delivers cutting-edge solutions with excellent expertise.” | “High costs make it challenging for smaller businesses to engage.” |
| “The consultants are knowledgeable and responsive to client needs.” | “Project delivery sometimes faces delays beyond initial estimates.” |
| “Strong focus on digital transformation and sustainability initiatives.” | “Occasional communication gaps during complex projects.” |
Overall, Accenture is praised for its expertise and innovation, while pricing and occasional project delays remain the main areas for improvement.
Risk Analysis
Below is a summary table outlining key risks related to Accenture plc, including their probability and potential impact:
| Category | Description | Probability | Impact |
|---|---|---|---|
| Market Volatility | Stock price fluctuations influenced by tech sector trends and economic cycles. | Medium | Medium |
| Valuation Concerns | Elevated price-to-book ratio (5.21) may indicate overvaluation risk. | Medium | Medium |
| Competitive Pressure | Intense competition in IT services and consulting could impact market share and margins. | Medium | High |
| Technological Change | Rapid innovation demands continuous investment in AI, cloud, and cybersecurity capabilities. | High | High |
| Economic Slowdown | Global economic uncertainties could reduce client spending on consulting and IT services. | Medium | High |
| Debt Management | Moderate debt-to-equity ratio (0.26) suggests manageable leverage but requires monitoring. | Low | Low |
The most significant risks for Accenture are technological change and economic slowdown, given their high impact and medium to high probability. Continuous innovation and adapting to market demands remain critical for sustaining growth amid competitive and macroeconomic challenges.
Should You Buy Accenture plc?
Accenture plc appears to be a company with robust profitability and operational efficiency, supported by a slightly favorable competitive moat despite declining ROIC. Its leverage profile seems manageable, while the overall A- rating suggests a very favorable financial health profile.
Strength & Efficiency Pillars
Accenture plc exhibits robust profitability and solid financial health, underpinning its operational efficiency. The company posts a favorable net margin of 11.02% alongside a return on equity of 24.61% and a return on invested capital (ROIC) of 16.99%. Importantly, ROIC surpasses the weighted average cost of capital (WACC) at 9.43%, confirming that Accenture is a clear value creator. Financial stability is reinforced by a strong Altman Z-score of 5.51, placing the company firmly in the safe zone, and a Piotroski score of 6, indicating average financial strength.
Weaknesses and Drawbacks
Despite its strengths, Accenture faces valuation and leverage considerations that warrant caution. The price-to-book ratio stands at an unfavorable 5.21, suggesting the stock may be trading at a premium relative to its book value, which could limit upside potential. While the price-to-earnings ratio at 21.16 is moderate, it still implies relatively high market expectations. The current ratio of 1.42 signals moderate liquidity, but the debt-to-equity ratio of 0.26 is favorable, mitigating leverage risks. Market-wise, a 26.23% overall price decline and a bearish long-term trend highlight ongoing market pressure despite recent buyer dominance.
Our Verdict about Accenture plc
Accenture’s long-term fundamentals appear favorable, supported by strong profitability and value creation metrics. The recent period shows buyer dominance and positive price acceleration, which may indicate emerging momentum. Therefore, despite the stock’s earlier bearish trend and valuation concerns, the profile might appear attractive for investors considering long-term exposure. Caution is advised given the moderate valuation metrics and ongoing market volatility, suggesting a measured approach could be prudent.
Disclaimer: This content is for informational purposes only and does not constitute financial, investment, or other professional advice. Investing in financial markets involves a significant risk of loss, and past performance is not indicative of future results.
Additional Resources
- UNIVEST FINANCIAL Corp Buys 4,894 Shares of Accenture PLC $ACN – MarketBeat (Jan 23, 2026)
- Accenture PLC (ACN) Trades at a Discount Despite Strong Cash Flow Profile – Yahoo Finance (Jan 19, 2026)
- Accenture plc (ACN) announces results for fiscal Q1 2026, here’s what you need to know – MSN (Jan 22, 2026)
- Accenture (ACN) Stock Trades Up, Here Is Why – Finviz (Jan 21, 2026)
- Accenture: You’ll Regret Not Buying Here (NYSE:ACN) – Seeking Alpha (Jan 21, 2026)
For more information about Accenture plc, please visit the official website: accenture.com