Home > Analyses > Healthcare > AbbVie Inc.
AbbVie transforms lives by delivering breakthrough therapies that redefine treatment standards across autoimmune, oncology, and neurological diseases. Its flagship drugs like HUMIRA and SKYRIZI dominate global markets, showcasing relentless innovation and robust patent protection. Known for strategic acquisitions and cutting-edge research, AbbVie secures its position as a pharmaceutical powerhouse. The key question now: does its financial strength and pipeline innovation justify its premium valuation in today’s evolving healthcare landscape?

Table of contents
Business Model & Company Overview
AbbVie Inc., founded in 2012 and headquartered in North Chicago, Illinois, stands as a dominant force in the drug manufacturing sector. It has built a comprehensive pharmaceutical ecosystem spanning autoimmune, oncology, and neurology treatments. Its portfolio includes flagship therapies like HUMIRA and SKYRIZI, which address complex chronic conditions, reflecting its focus on innovation and patient-centric solutions.
AbbVie generates value through a balanced mix of patented drugs and ongoing research collaborations, fueling steady revenue streams across the Americas, Europe, and Asia. Its strategy combines high-margin specialty pharmaceuticals with expanding global reach. This blend creates a robust economic moat, positioning AbbVie to shape the future of healthcare worldwide.
Financial Performance & Fundamental Metrics
I analyze AbbVie Inc.’s income statement, key financial ratios, and dividend payout policy to assess its profitability, efficiency, and shareholder returns.
Income Statement
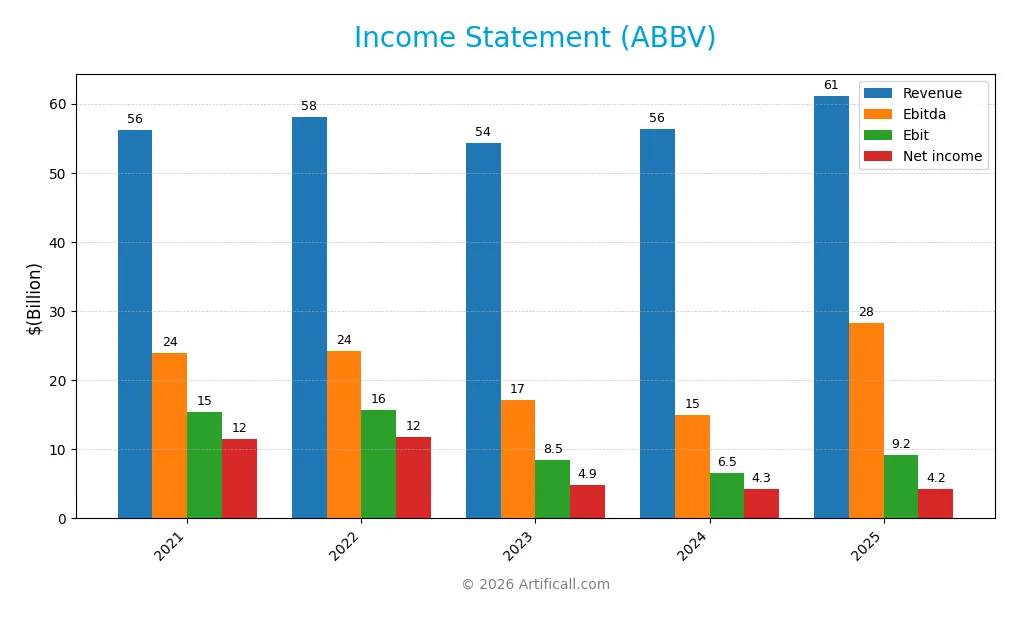
The table below summarizes AbbVie Inc.’s key income statement items for the fiscal years 2021 through 2025, reflecting revenue, expenses, profitability, and earnings per share.
| 2021 | 2022 | 2023 | 2024 | 2025 | |
|---|---|---|---|---|---|
| Revenue | 56.2B | 58.1B | 54.3B | 56.3B | 61.2B |
| Cost of Revenue | 17.4B | 17.4B | 20.4B | 16.9B | 10.0B |
| Operating Expenses | 20.8B | 22.5B | 21.1B | 30.3B | 30.0B |
| Gross Profit | 38.8B | 40.6B | 33.9B | 39.4B | 51.2B |
| EBITDA | 23.9B | 24.2B | 17.2B | 14.9B | 28.3B |
| EBIT | 15.4B | 15.7B | 8.5B | 6.5B | 9.2B |
| Interest Expense | 2.4B | 2.2B | 2.2B | 2.8B | 2.6B |
| Net Income | 11.5B | 11.8B | 4.9B | 4.3B | 4.2B |
| EPS | 6.48 | 6.65 | 2.73 | 2.40 | 2.38 |
| Filing Date | 2022-02-18 | 2023-02-17 | 2024-02-20 | 2025-02-14 | 2026-02-20 |
Income Statement Evolution
AbbVie’s revenue increased steadily, rising 8.57% in the latest year and 8.83% over five years. Gross profit expanded sharply by 29.84% last year, pushing gross margins higher to a favorable 83.71%. However, net income declined significantly, dropping 63.39% over the period, reflecting pressure on net margins which contracted by 66.36%.
Is the Income Statement Favorable?
The 2025 income statement shows strong top-line growth with an 8.57% revenue increase and solid margin improvement, notably an EBIT margin of 15.08%. Interest expenses remain manageable at 4.3% of revenue. Despite a 9.01% decline in net margin and a minor EPS drop, the overall fundamentals are positive, with operating income and EBITDA growth supporting a favorable evaluation.
Financial Ratios
The following table presents AbbVie Inc.’s key financial ratios for fiscal years 2021 through 2025, illustrating profitability, valuation, liquidity, leverage, and efficiency metrics:
| Ratios | 2021 | 2022 | 2023 | 2024 | 2025 |
|---|---|---|---|---|---|
| Net Margin | 20.5% | 20.4% | 8.9% | 7.6% | 6.9% |
| ROE | 0.75 | 0.69 | 0.47 | 1.29 | -1.63 |
| ROIC | 0.13 | 0.14 | 0.10 | 0.09 | 0.03 |
| P/E | 20.8 | 24.2 | 56.3 | 73.5 | 96.8 |
| P/B | 15.6 | 16.6 | 26.4 | 94.5 | -157.4 |
| Current Ratio | 0.79 | 0.96 | 0.87 | 0.66 | 0 |
| Quick Ratio | 0.70 | 0.84 | 0.76 | 0.55 | 0 |
| D/E | 5.03 | 3.72 | 5.80 | 20.4 | 0 |
| Debt-to-Assets | 53.0% | 46.2% | 44.6% | 50.2% | 0 |
| Interest Coverage | 7.40 | 8.12 | 5.74 | 3.25 | 8.08 |
| Asset Turnover | 0.38 | 0.42 | 0.40 | 0.42 | 11.21 |
| Fixed Asset Turnover | 11.0 | 11.8 | 10.9 | 11.0 | 0 |
| Dividend Yield | 3.86% | 3.51% | 3.85% | 3.51% | 2.87% |
Evolution of Financial Ratios
AbbVie’s Return on Equity (ROE) declined sharply, turning deeply negative by 2025. The Current Ratio fell to zero, signaling deteriorated short-term liquidity. Debt-to-Equity Ratio, unusually, dropped to zero in 2025, marking a significant shift from prior years. Profitability margins showed mixed trends, with net margin declining yet remaining near neutral levels.
Are the Financial Ratios Favorable?
In 2025, AbbVie’s profitability is mixed: ROE is unfavorable, but Return on Invested Capital (ROIC) and WACC are favorable, indicating efficient capital use despite equity losses. Liquidity ratios are unfavorable, reflecting potential working capital stress. Leverage metrics appear favorable with zero debt ratios, though this contrasts prior leverage. Market valuation ratios are mixed; high P/E is unfavorable, but dividend yield and asset turnover are favorable. Overall, ratios lean slightly favorable with notable liquidity and profitability risks.
Shareholder Return Policy
AbbVie maintains a dividend payout ratio near 2.7, with dividends per share steadily rising from $5.23 in 2021 to $6.56 in 2025. The annual dividend yield hovers around 2.9%, supported by free cash flow coverage exceeding dividend and capex payments, signaling healthy cash generation.
The company also engages in share buybacks, complementing its dividend strategy. This balanced distribution approach aligns with sustainable shareholder value creation, as AbbVie leverages strong operating cash flow to fund returns without compromising financial stability.
Score analysis
Here is a radar chart summarizing the company’s key financial metric scores:
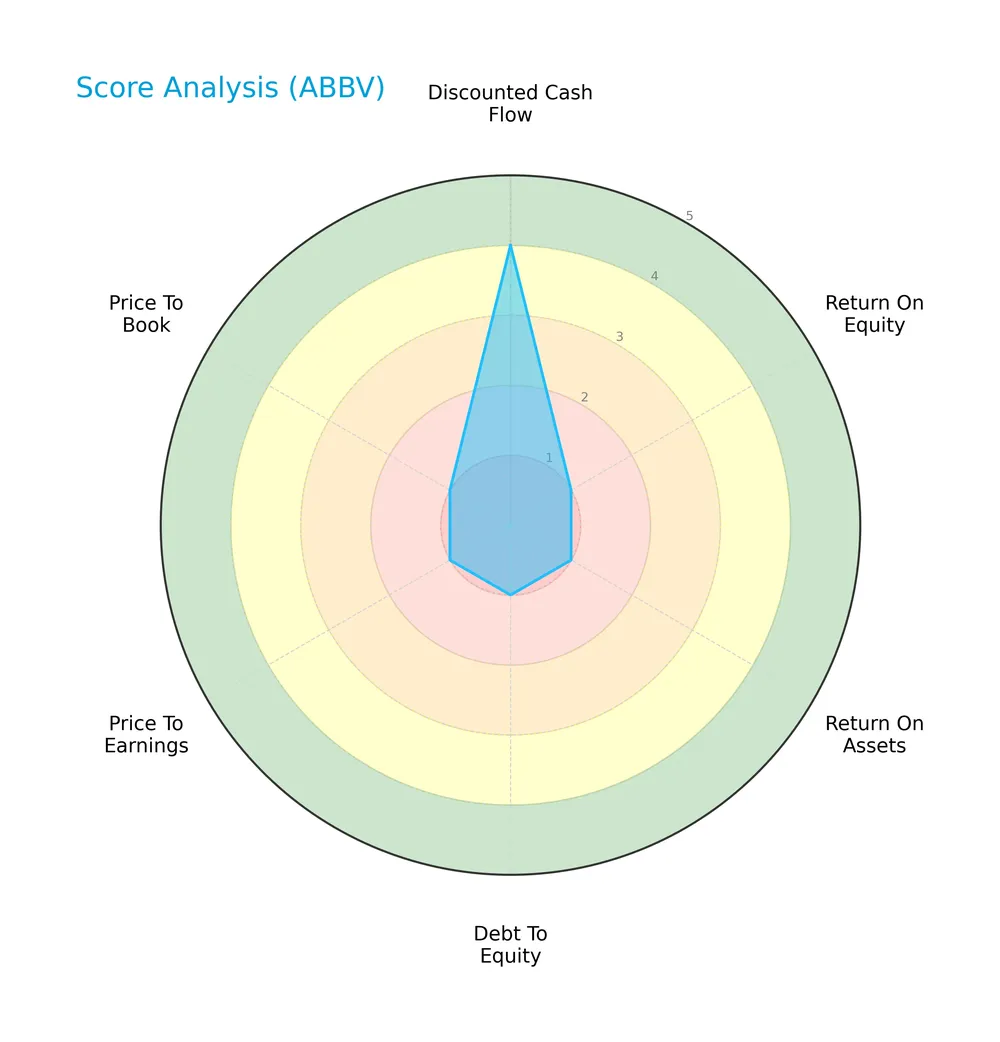
AbbVie scores well on discounted cash flow (4) and return on assets (5), indicating strong asset efficiency and value. However, low scores in return on equity (1), debt to equity (1), price to earnings (1), and price to book (1) highlight significant valuation and leverage concerns.
Analysis of the company’s bankruptcy risk
The Altman Z-Score signals a very low bankruptcy risk, placing AbbVie firmly in the safe zone:

Is the company in good financial health?
The Piotroski Score diagram illustrates the company’s financial strength based on nine key criteria:
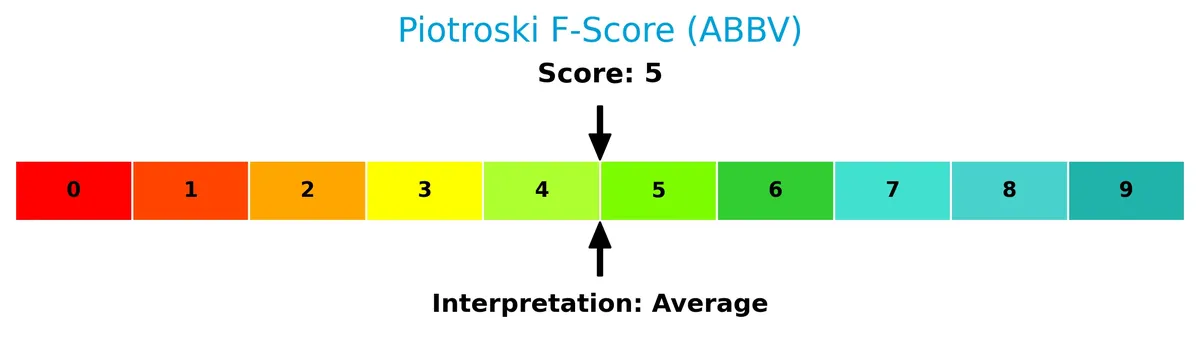
With a score of 7, AbbVie demonstrates strong financial health, suggesting solid profitability, liquidity, and operational efficiency relative to typical benchmarks.
Competitive Landscape & Sector Positioning
This sector analysis reviews AbbVie Inc.’s strategic positioning, revenue segments, key products, and main competitors. I will assess whether AbbVie holds a competitive advantage over its industry peers.
Strategic Positioning
AbbVie maintains a diversified pharmaceutical portfolio spanning immunology, aesthetics, neuroscience, and eye care products. Its revenue heavily concentrates in the U.S. market, accounting for roughly 95% of 2025 sales, underscoring a geographically concentrated footprint despite broad product lines.
Revenue by Segment
This pie chart illustrates AbbVie Inc.’s revenue distribution by product segment for the fiscal year 2025, highlighting key contributors to the company’s total sales.
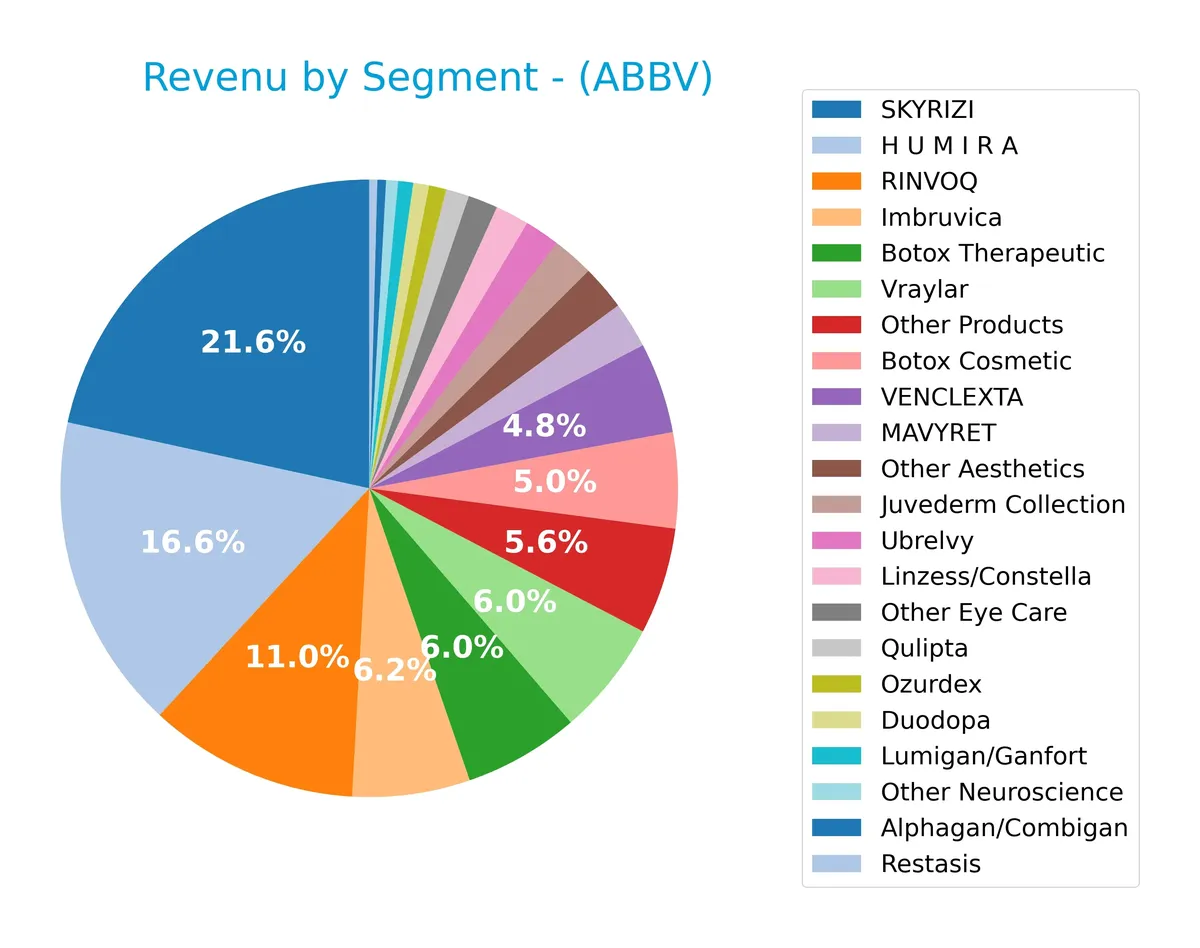
In 2025, SKYRIZI leads with $17.56B, followed by RINVOQ at $8.3B and HUMIRA with $4.54B. Neuroscience and aesthetics products like Botox Therapeutic ($3.77B) and Vraylar ($3.62B) also contribute significantly. Recent trends show SKYRIZI and RINVOQ accelerating, while HUMIRA’s revenue continues its long-term decline, signaling shifting reliance toward newer immunology drugs.
Key Products & Brands
The table below summarizes AbbVie Inc.’s key products and their descriptions based on the latest available data:
| Product | Description |
|---|---|
| HUMIRA | Injectable therapy for autoimmune and intestinal Behçet’s diseases. |
| SKYRIZI | Treatment for moderate to severe plaque psoriasis in adults. |
| RINVOQ | JAK inhibitor for moderate to severe active rheumatoid arthritis in adults. |
| IMBRUVICA | Treatment for chronic lymphocytic leukemia (CLL), small lymphocytic lymphoma (SLL). |
| VENCLEXTA | BCL-2 inhibitor for adults with CLL or SLL. |
| MAVYRET | Treatment for chronic HCV genotype 1-6 infection. |
| CREON | Pancreatic enzyme therapy for exocrine pancreatic insufficiency. |
| Synthroid | Treatment for hypothyroidism. |
| Linzess/Constella | Treatment for irritable bowel syndrome with constipation and chronic idiopathic constipation. |
| Lupron | Palliative treatment for advanced prostate cancer, endometriosis, central precocious puberty, and uterine fibroids anemia. |
| Botox Therapeutic | Therapeutic applications of Botox. |
| Botox Cosmetic | Cosmetic use of Botox. |
| Juvederm Collection | Aesthetic dermal fillers. |
| Alphagan/Combigan | Alpha-adrenergic receptor agonists reducing elevated intraocular pressure (IOP) in glaucoma or ocular hypertension. |
| Lumigan/Ganfort | Bimatoprost ophthalmic solution for reducing elevated IOP in glaucoma or ocular hypertension. |
| Restasis | Calcineurin inhibitor immunosuppressant to increase tear production. |
| Ubrelvy | Treatment for migraine with or without aura in adults. |
| Duopa/Duodopa | Levodopa-carbidopa intestinal gel for Parkinson’s disease. |
| Qulipta | Treatment related to neuroscience (specific indication not detailed). |
| Vraylar | Neuroscience-related product (specific indication not detailed). |
| Other Aesthetics | Other aesthetic products beyond Juvederm and Botox Cosmetics. |
| Other Eye Care | Additional ophthalmic products other than those specifically named. |
| Other Neuroscience | Other neuroscience-related treatments not detailed individually. |
| Other Products | Various additional pharmaceutical products not specified individually. |
AbbVie’s portfolio spans immunology, oncology, neuroscience, aesthetics, and eye care. Its flagship drug HUMIRA remains a cornerstone, complemented by strong growth in SKYRIZI and RINVOQ. The company balances specialty pharmaceuticals with established therapies across diverse therapeutic areas.
Main Competitors
There are 10 main competitors in the Healthcare sector; the table lists the top 10 leaders by market capitalization:
| Competitor | Market Cap. |
|---|---|
| Eli Lilly and Company | 970B |
| Johnson & Johnson | 500B |
| AbbVie Inc. | 405B |
| AstraZeneca PLC | 285B |
| Merck & Co., Inc. | 268B |
| Amgen Inc. | 176B |
| Gilead Sciences, Inc. | 151B |
| Pfizer Inc. | 143B |
| Bristol-Myers Squibb Company | 109B |
| Biogen Inc. | 26B |
AbbVie ranks 3rd among its competitors with a market cap at 41% of the leader, Eli Lilly. It stands clearly above the average market cap of the top 10 (303B) and the sector median (222B). The company is 25.7% smaller than Johnson & Johnson, its nearest rival above, showing a meaningful market gap.
Comparisons with competitors
Check out how we compare the company to its competitors:
Does AbbVie have a competitive advantage?
AbbVie demonstrates a sustainable competitive advantage, creating significant value with a ROIC well above its WACC and a strong upward ROIC trend. This positions the company as a profitable, well-managed leader in the drug manufacturing sector.
Looking ahead, AbbVie’s diverse portfolio, including HUMIRA, SKYRIZI, and emerging therapies, supports growth in autoimmune and oncology markets. Its research collaborations and expanding U.S. and international revenues signal opportunities for continued innovation and market penetration.
SWOT Analysis
This SWOT analysis highlights AbbVie Inc.’s key internal and external factors influencing its market position and strategic options.
Strengths
- strong global brand
- robust product portfolio
- very favorable moat with growing ROIC
Weaknesses
- declining net income over period
- unfavorable ROE
- high P/E ratio signaling possible overvaluation
Opportunities
- expanding US market revenue
- innovative drug pipeline
- potential for geographic diversification
Threats
- patent expirations
- regulatory risks in pharma
- intense industry competition
AbbVie demonstrates a resilient competitive advantage and solid revenue growth, but profitability pressures and valuation concerns require cautious capital allocation. Strategic focus should leverage innovation while managing regulatory and market risks.
Stock Price Action Analysis
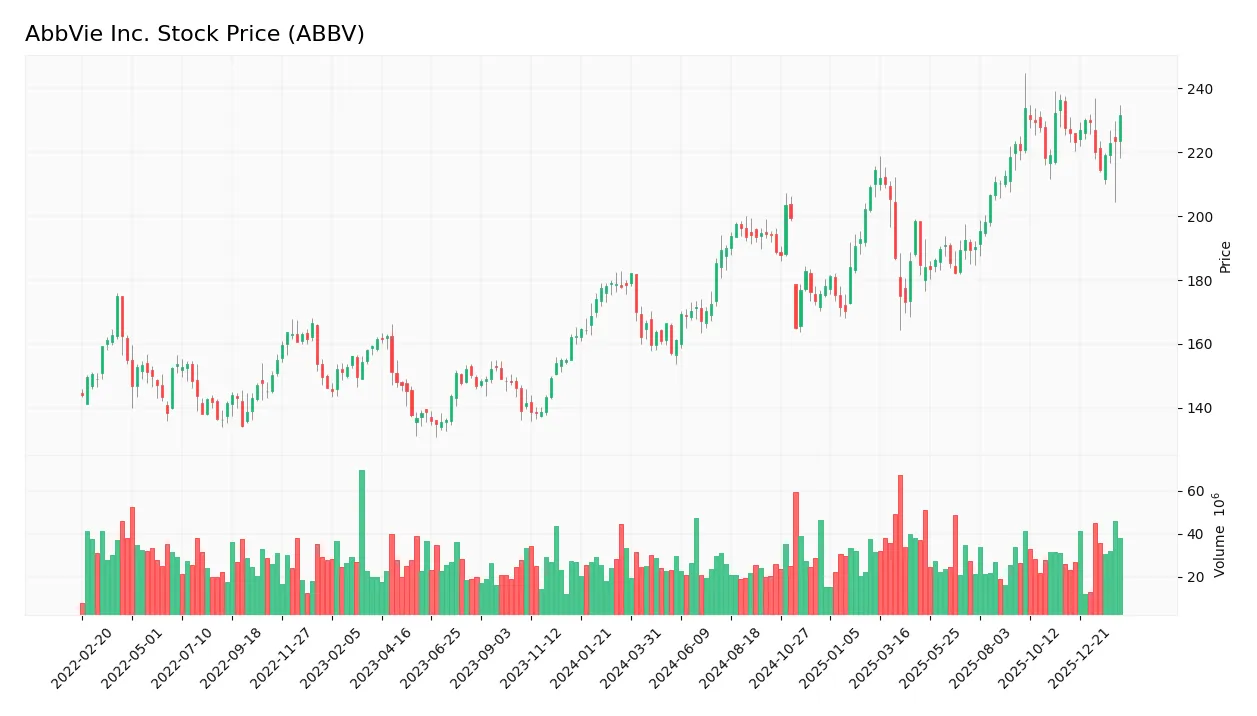
The weekly stock chart below illustrates AbbVie Inc.’s price movements and key levels over the past 12 months:
Trend Analysis
Over the past 12 months, AbbVie’s stock rose 23.45%, signaling a bullish trend. The price peaked at 236.28 and bottomed at 157.06. Despite the strong gain, trend acceleration has slowed, with volatility measured by a 21.43 standard deviation. The recent two-month period shows a slight negative change of -0.56%, indicating a neutral short-term slope.
Volume Analysis
Trading volume over the last three months has increased, with buyers accounting for 54.3% of activity, indicating slight buyer dominance. This rising participation suggests cautious optimism and continued market interest, although the dominance margin narrows compared to the overall period’s 55.67%.
Target Prices
Analysts set a robust target consensus for AbbVie Inc., reflecting confidence in its growth trajectory.
| Target Low | Target High | Consensus |
|---|---|---|
| 223 | 299 | 255.83 |
The target range from 223 to 299 signals a positive outlook, with consensus near 256 indicating moderate upside potential.

Don’t Let Luck Decide Your Entry Point
Optimize your entry points with our advanced ProRealTime indicators. You’ll get efficient buy signals with precise price targets for maximum performance. Start outperforming now!
Analyst & Consumer Opinions
This section examines recent analyst grades and consumer feedback related to AbbVie Inc., providing balanced insights.
Stock Grades
Here is a concise overview of recent verified analyst grades for AbbVie Inc.:
| Grading Company | Action | New Grade | Date |
|---|---|---|---|
| Piper Sandler | Maintain | Overweight | 2026-02-18 |
| UBS | Maintain | Neutral | 2026-02-05 |
| Evercore ISI Group | Maintain | Outperform | 2026-02-05 |
| Morgan Stanley | Maintain | Overweight | 2026-02-05 |
| Citigroup | Maintain | Neutral | 2026-01-27 |
| Wolfe Research | Downgrade | Peer Perform | 2026-01-08 |
| Morgan Stanley | Maintain | Overweight | 2025-12-12 |
| HSBC | Upgrade | Buy | 2025-12-10 |
| UBS | Maintain | Neutral | 2025-11-07 |
| Piper Sandler | Maintain | Overweight | 2025-11-05 |
The consensus shows a general trend of stability with multiple firms maintaining overweight or buy ratings. Wolfe Research’s downgrade is an outlier amid predominantly positive or neutral outlooks.
Consumer Opinions
Consumers express a mix of admiration and frustration toward AbbVie Inc., reflecting its complex market position.
| Positive Reviews | Negative Reviews |
|---|---|
| “AbbVie’s products deliver consistent, effective results.” | “Pricing for key drugs feels unreasonably high.” |
| “Customer service is knowledgeable and responsive.” | “Some medications have long wait times for approval.” |
| “The company invests heavily in innovative therapies.” | “Side effects of certain drugs are concerning.” |
Overall, consumers praise AbbVie’s innovation and product efficacy but frequently criticize drug pricing and accessibility. These recurring themes highlight the tension between breakthrough treatments and affordability.
Risk Analysis
Below is a table summarizing the key risks AbbVie Inc. faces, categorized by their likelihood and potential impact:
| Category | Description | Probability | Impact |
|---|---|---|---|
| Valuation Risk | Elevated P/E ratio (~97) suggests the stock may be overvalued. | High | High |
| Liquidity Risk | Current and quick ratios at zero indicate poor short-term liquidity. | Moderate | High |
| Profitability Risk | Negative ROE (-163%) signals weak shareholder returns despite high ROIC. | Moderate | Moderate |
| Debt Risk | Low debt-to-equity and debt-to-assets ratios reduce financial leverage concerns. | Low | Low |
| Market Volatility | Low beta (0.33) implies limited price swings relative to market. | Low | Low |
I consider the high valuation risk and liquidity weaknesses the most pressing. AbbVie’s P/E far exceeds healthcare sector averages, raising concerns about growth sustainability. Meanwhile, zero liquidity ratios could stress operations in downturns. However, the company’s strong Altman Z-score confirms solid financial stability, mitigating bankruptcy fears for now.
Should You Buy AbbVie Inc.?
AbbVie appears to be delivering improving operational efficiency with a durable competitive moat supported by strong value creation. Despite significant leverage, the company maintains a manageable debt profile. The overall rating of C+ suggests a cautiously favorable investment profile.
Strength & Efficiency Pillars
AbbVie Inc. demonstrates robust operational efficiency with a gross margin of 83.71% and an EBIT margin of 15.08%, underscoring strong cost control. The company’s ROIC stands at an exceptional 260.32%, far exceeding its WACC of 5.23%, confirming AbbVie as a clear value creator. Despite a negative ROE of -162.6%, the firm sustains solid asset turnover at 11.21, signaling effective use of invested capital. These metrics reflect a firm leveraging its competitive advantages to generate shareholder value sustainably.
Weaknesses and Drawbacks
AbbVie is not without risks. Its P/E ratio of 96.82 signals an expensive valuation, exposing the stock to downside if growth falters. The current ratio and quick ratio both at zero indicate liquidity concerns, raising red flags about short-term financial flexibility. While debt-to-equity is favorable at zero, the interest coverage ratio of 3.51 suggests only moderate comfort servicing debt. Investors should note these vulnerabilities amid premium pricing and monitor liquidity closely.
Our Final Verdict about AbbVie Inc.
AbbVie’s strong operational profitability and excellent ROIC compared to WACC suggest a fundamentally sound company with a sustainable competitive moat. The stock’s long-term bullish trend supports this view. However, elevated valuation multiples and liquidity constraints suggest caution. Despite strong fundamentals, the profile might appear better suited for investors willing to weather near-term risks for potential long-term rewards.
Disclaimer: This content is for informational purposes only and does not constitute financial, investment, or other professional advice. Investing in financial markets involves a significant risk of loss, and past performance is not indicative of future results.
Additional Resources
- Fiera Capital Corp Has $38.12 Million Stake in AbbVie Inc. $ABBV – MarketBeat (Feb 21, 2026)
- Evercore Notes AbbVie Inc.’s (ABBV) Tremfya Gains Market Share, But Future Earnings Growth May Be Limited – Yahoo Finance (Feb 19, 2026)
- Beyond the Balance Sheet: What SWOT Reveals About AbbVie Inc (AB – GuruFocus (Feb 21, 2026)
- Barclays Initiates Coverage of AbbVie (ABBV) with Overweight Recommendation – Nasdaq (Feb 20, 2026)
- AbbVie Inc. SEC 10-K Report – TradingView (Feb 20, 2026)
For more information about AbbVie Inc., please visit the official website: abbvie.com