Home > Analyses > Healthcare > Abbott Laboratories
Abbott Laboratories transforms healthcare through groundbreaking medical devices and diagnostics that millions rely on daily. The company stands as a pillar in medical innovation, offering cutting-edge cardiovascular devices, nutritional products, and molecular diagnostics. Its reputation for quality and diverse portfolio cements its leadership in the healthcare sector. As the medical landscape evolves, I ask: does Abbott’s robust foundation still justify its premium valuation and future growth prospects?
Table of contents
Business Model & Company Overview
Abbott Laboratories, founded in 1888 and headquartered in North Chicago, Illinois, stands as a global leader in the Medical Devices industry. It operates a diversified ecosystem spanning Established Pharmaceutical Products, Diagnostics, Nutritional Products, and Medical Devices. This integrated portfolio addresses a broad spectrum of healthcare needs, reinforcing Abbott’s dominant market position across multiple therapeutic and diagnostic categories.
The company’s revenue engine balances innovative hardware—such as cardiovascular and neuromodulation devices—with recurring software and diagnostic services, including molecular testing and remote patient monitoring. Abbott’s strategic footprint spans the Americas, Europe, and Asia, driving growth through strong global demand. Its enduring economic moat lies in a robust product pipeline and deep clinical integration that shape the future of healthcare delivery worldwide.
Financial Performance & Fundamental Metrics
I analyze Abbott Laboratories’ income statement, key financial ratios, and dividend payout policy to assess its profitability, efficiency, and shareholder returns.
Income Statement
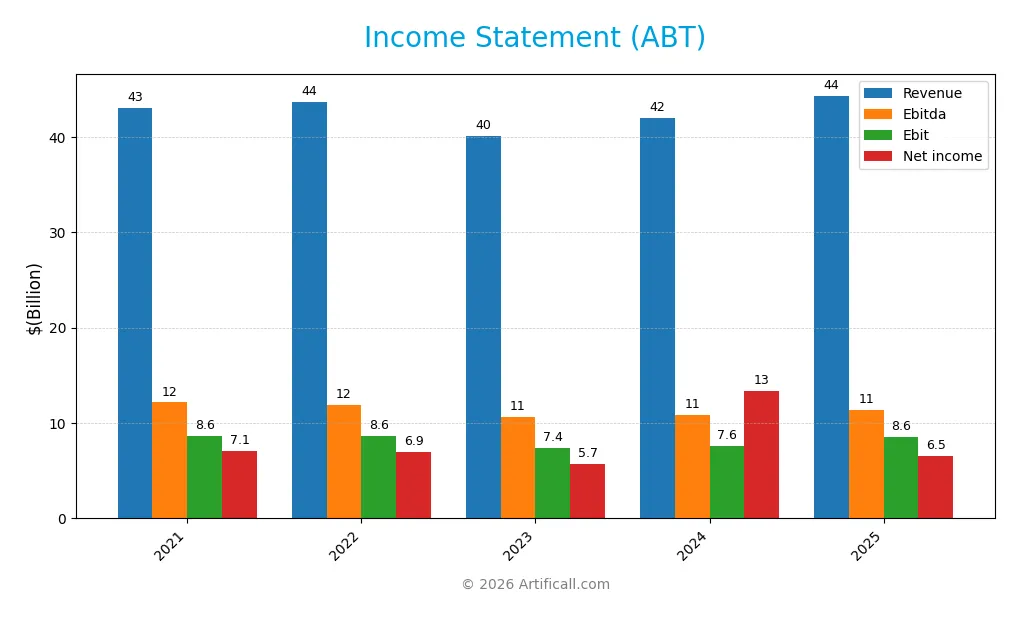
Below is the annual income statement for Abbott Laboratories (ABT) from 2021 to 2025, reflecting key profitability and expense metrics in USD.
| 2021 | 2022 | 2023 | 2024 | 2025 | |
|---|---|---|---|---|---|
| Revenue | 43.1B | 43.7B | 40.1B | 41.9B | 44.3B |
| Cost of Revenue | 19.9B | 21.3B | 20.1B | 20.6B | 19.7B |
| Operating Expenses | 14.0B | 13.9B | 13.6B | 14.5B | 16.6B |
| Gross Profit | 23.2B | 22.3B | 20.0B | 21.3B | 24.6B |
| EBITDA | 12.2B | 11.9B | 10.6B | 10.8B | 11.3B |
| EBIT | 8.6B | 8.6B | 7.4B | 7.6B | 8.6B |
| Interest Expense | 410M | 315M | 698M | 603M | 341M |
| Net Income | 7.1B | 6.9B | 5.7B | 13.4B | 6.5B |
| EPS | 3.97 | 3.94 | 3.30 | 7.67 | 3.74 |
| Filing Date | 2022-02-18 | 2023-02-17 | 2024-02-16 | 2025-02-21 | 2026-02-20 |
Income Statement Evolution
Abbott Laboratories’ revenue increased modestly by 5.7% in 2025, continuing a sluggish overall growth trend of 2.9% since 2021. Gross profit expanded by 15.4%, reflecting improved cost control and operational efficiency. Despite favorable EBIT margin expansion to 19.4%, net income and EPS declined sharply, pulling net margins down by over 50% in the last year.
Is the Income Statement Favorable?
The 2025 income statement shows mixed fundamentals. Strong gross and EBIT margins indicate efficient core operations and cost management. However, a steep 54% net margin contraction and EPS drop signal pressures on profitability, likely from rising expenses or tax impacts. The overall income statement evaluation rates as unfavorable, highlighting caution amid uneven profit trends despite revenue stability.
Financial Ratios
The table below summarizes key financial ratios for Abbott Laboratories (ABT) over recent fiscal years, providing insights into profitability, valuation, liquidity, leverage, and efficiency:
| Ratios | 2021 | 2022 | 2023 | 2024 | 2025 |
|---|---|---|---|---|---|
| Net Margin | 16% | 16% | 14% | 32% | 15% |
| ROE | 20% | 19% | 15% | 28% | 0% |
| ROIC | 13% | 11% | 9% | 10% | -46% |
| P/E | 35.3 | 27.8 | 33.4 | 14.6 | 33.6 |
| P/B | 7.0 | 5.2 | 4.9 | 4.1 | 0.0 |
| Current Ratio | 1.85 | 1.63 | 1.64 | 1.67 | 0.0 |
| Quick Ratio | 1.46 | 1.23 | 1.16 | 1.23 | 0.0 |
| D/E | 0.54 | 0.49 | 0.41 | 0.32 | 0.0 |
| Debt-to-Assets | 26% | 24% | 22% | 19% | 0.0 |
| Interest Coverage | 22.4 | 26.5 | 9.2 | 11.3 | 23.6 |
| Asset Turnover | 0.57 | 0.59 | 0.55 | 0.52 | 0.0 |
| Fixed Asset Turnover | 4.26 | 4.25 | 3.56 | 3.58 | 0.0 |
| Dividend Yield | 1.28% | 1.72% | 1.86% | 1.96% | 1.88% |
Evolution of Financial Ratios
Abbott Laboratories’ Return on Equity (ROE) has declined, reaching zero in 2025. The Current Ratio dropped sharply to zero in 2025 from a stable range around 1.6-1.8 in prior years. Debt-to-Equity Ratio decreased to zero in 2025, showing a notable reduction in leverage. Profitability margins showed mixed trends, with net margins improving slightly but ROIC turning negative.
Are the Financial Ratios Favorable?
In 2025, Abbott’s profitability displays strength with a favorable net margin of 14.7%, but ROE and ROIC are unfavorable, signaling poor capital efficiency. Liquidity ratios are concerning, both Current and Quick ratios are zero, indicating potential short-term risk. Leverage metrics, including Debt-to-Equity and Debt-to-Assets, appear favorable, supported by a strong interest coverage ratio of 25.18. Market valuation shows a high P/E ratio of 33.55, viewed as unfavorable. Overall, the ratios lean slightly unfavorable.
Shareholder Return Policy
Abbott Laboratories maintains a dividend payout ratio near 63%, with dividends per share rising steadily to $2.36 in 2025. The annual dividend yield hovers around 1.88%, supported by free cash flow coverage, indicating a balanced distribution approach.
The company also engages in share buybacks, complementing dividends to return capital. This policy appears sustainable, aligning with long-term shareholder value by balancing payout with cash flow generation and prudent capital management.
Score analysis
The radar chart below highlights Abbott Laboratories’ valuation and financial performance scores:
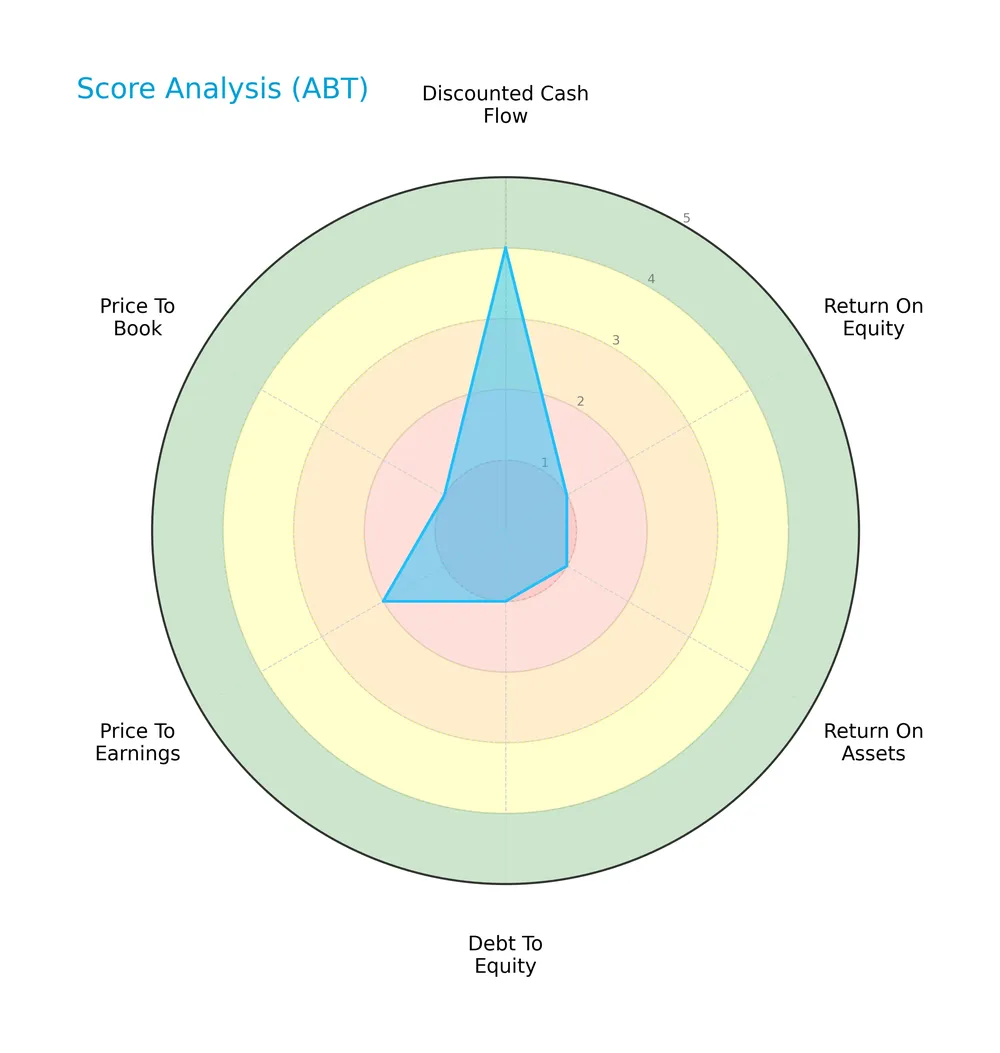
Abbott Laboratories shows a favorable discounted cash flow score of 4. However, return on equity, return on assets, debt to equity, and price to book scores are all very unfavorable at 1. The price to earnings score is also unfavorable at 2.
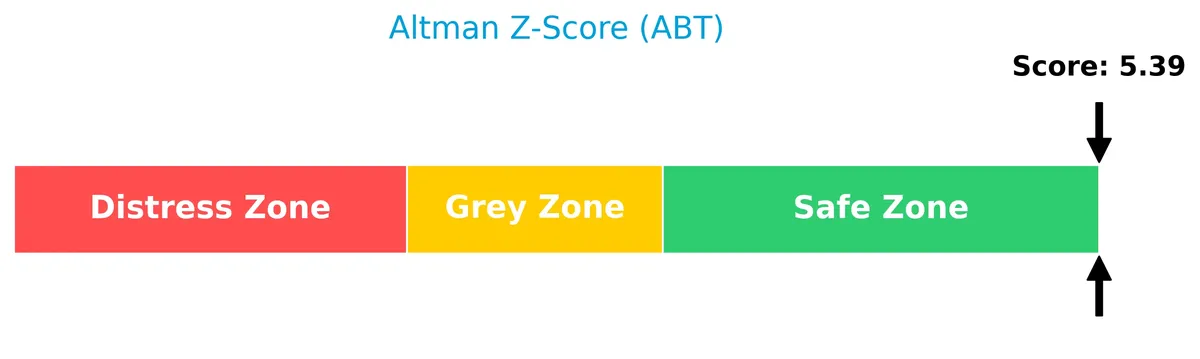
Analysis of the company’s bankruptcy risk
Abbott Laboratories is comfortably positioned in the safe zone according to its Altman Z-Score, indicating a low risk of bankruptcy:
Is the company in good financial health?
The Piotroski Score diagram summarizes Abbott Laboratories’ financial health based on key profitability and efficiency metrics:

With a Piotroski Score of 6, Abbott Laboratories falls into the average category, suggesting moderate financial strength but room for improvement.
Competitive Landscape & Sector Positioning
This analysis examines Abbott Laboratories’ strategic positioning, revenue segments, and key products within the healthcare sector. I will evaluate whether Abbott holds a competitive advantage over its main competitors.
Strategic Positioning
Abbott Laboratories maintains a diversified product portfolio across four segments: Medical Devices (21.4B in 2025), Diagnostic Products (8.9B), Nutritional Products (8.5B), and Established Pharmaceuticals (5.5B). Its geographic exposure balances US (17.1B) and Non-US markets (15.9B), reflecting broad global reach.
Revenue by Segment
This pie chart illustrates Abbott Laboratories’ revenue distribution by product segment for the fiscal year 2025, highlighting the company’s diversified sources of income.
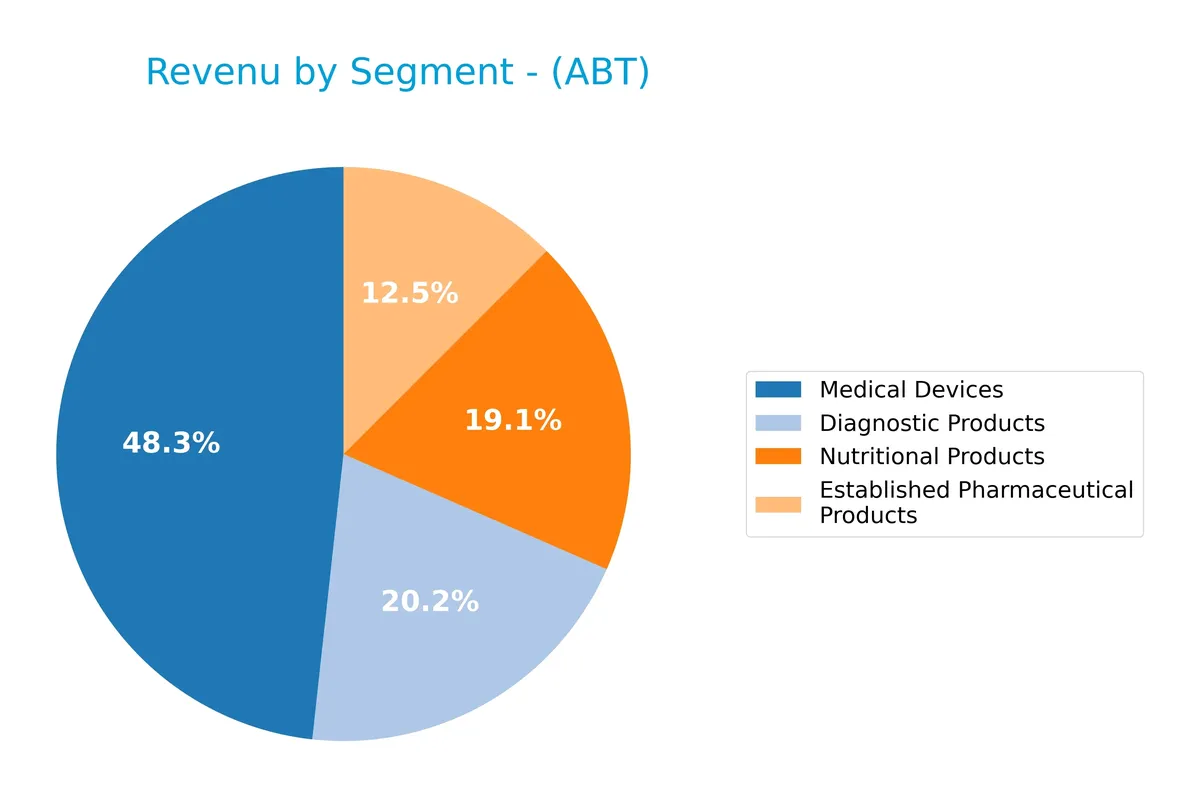
In 2025, Medical Devices dominates with $21.4B, reflecting strong growth from $19B in 2024, signaling expanding demand and innovation. Diagnostic Products declined to $8.9B from $9.3B, indicating some pressure in this historically volatile segment. Nutritional Products remain steady near $8.5B, showcasing consistent consumer health demand. Established Pharmaceuticals grew modestly to $5.5B, maintaining a stable but smaller revenue base. Overall, the mix emphasizes Medical Devices as the clear growth engine amid cautious headwinds in diagnostics.
Key Products & Brands
Abbott Laboratories operates through four main product segments generating significant revenues:
| Product | Description |
|---|---|
| Diagnostic Products | Laboratory systems for immunoassay, clinical chemistry, hematology, molecular diagnostics, point-of-care testing. |
| Established Pharmaceutical Products | Generic pharmaceuticals treating a range of conditions including gastrointestinal, hormonal, cardiovascular, and infectious diseases. |
| Medical Devices | Cardiovascular devices, diabetes care products, neuromodulation devices managing chronic pain and movement disorders. |
| Nutritional Products | Pediatric and adult nutritional supplements supporting health and wellness. |
Abbott’s diverse portfolio spans advanced diagnostics, pharmaceuticals, medical devices, and nutrition, reflecting broad healthcare exposure and innovation.
Main Competitors
There are 10 main competitors in the Medical – Devices industry; the table lists the top 10 leaders by market capitalization:
| Competitor | Market Cap. |
|---|---|
| Abbott Laboratories | 216B |
| Boston Scientific Corporation | 140B |
| Stryker Corporation | 133B |
| Medtronic plc | 123B |
| Edwards Lifesciences Corporation | 50B |
| DexCom, Inc. | 26B |
| STERIS plc | 25B |
| Insulet Corporation | 20B |
| Zimmer Biomet Holdings, Inc. | 18B |
| Align Technology, Inc. | 11B |
Abbott Laboratories ranks 1st among its 10 competitors by market cap. Its scale is 90.35% relative to the sector leader benchmark. Abbott sits well above both the average market cap of the top 10 (76B) and the median market cap in the sector (38B). The company maintains a 39.1% market cap lead over its closest competitor, Boston Scientific.
Comparisons with competitors
Check out how we compare the company to its competitors:
Does Abbott Laboratories have a competitive advantage?
Abbott Laboratories does not currently present a competitive advantage, as its return on invested capital (ROIC) significantly underperforms its cost of capital, indicating value destruction. The company’s declining ROIC trend over 2021-2025 signals weakening profitability and inefficient capital use.
Looking ahead, Abbott operates across diverse healthcare segments, including diagnostics, medical devices, pharmaceuticals, and nutrition. Expansion into new diagnostic technologies and global markets may offer growth opportunities despite current profitability challenges.
SWOT Analysis
This SWOT analysis highlights Abbott Laboratories’ core strategic factors to guide investment decisions.
Strengths
- diversified product portfolio
- strong global presence
- favorable gross and EBIT margins
Weaknesses
- declining ROIC and profitability
- unfavorable net margin growth
- weak liquidity ratios
Opportunities
- expansion in emerging markets
- growth in diagnostics and medical devices
- innovation in chronic disease management
Threats
- intense competition in healthcare
- regulatory and reimbursement risks
- pricing pressure and cost inflation
Abbott’s strengths in product diversity and margins provide resilience. However, declining profitability and liquidity issues require strategic focus on operational efficiency and innovation. Expansion into emerging markets and diagnostics offers growth, but competitive and regulatory challenges could constrain upside.
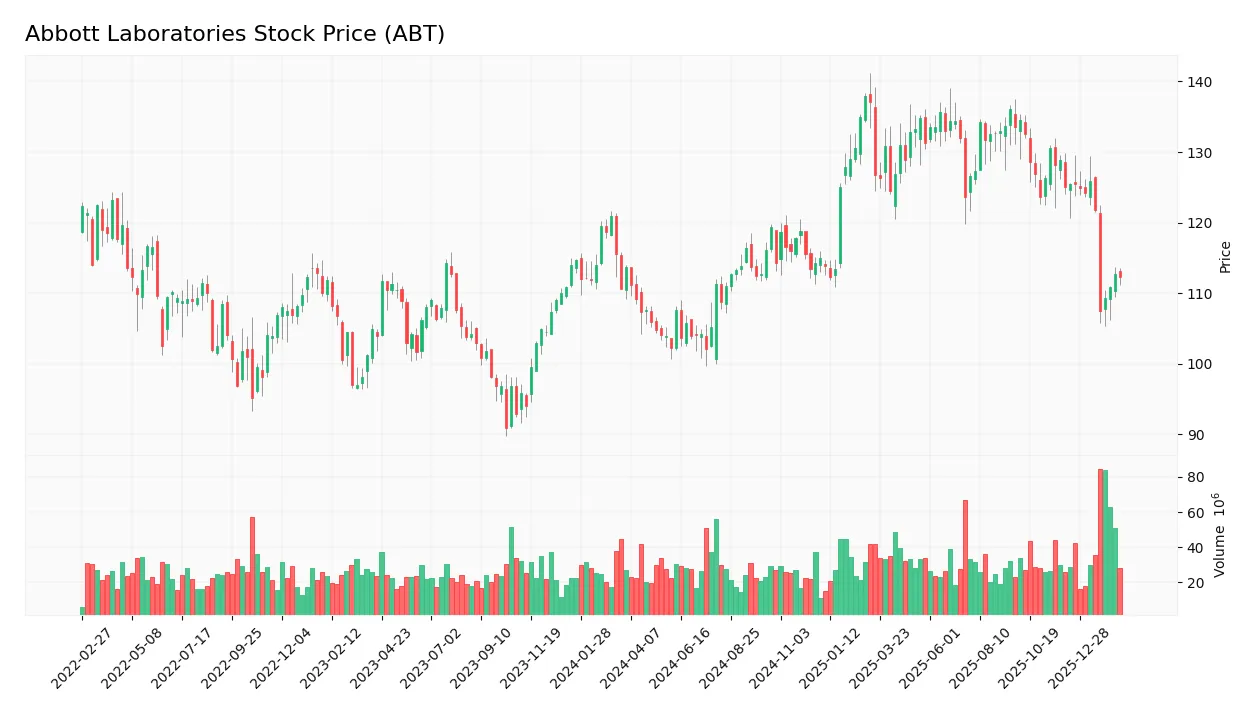
Stock Price Action Analysis
The weekly stock chart for Abbott Laboratories (ABT) reveals price fluctuations and key support and resistance levels over the past 12 months:
Trend Analysis
Over the past 12 months, ABT’s stock price declined by 1.28%, indicating a neutral trend as it falls within the ±2% range. The trend shows deceleration, with a high volatility of 10.6 standard deviation, and a price range between 138.01 and 102.03.
Volume Analysis
In the last three months, trading volume increased with buyer volume at 256M and seller volume close behind at 250M. Buyer dominance stands at 50.59%, reflecting neutral investor sentiment and balanced market participation.
Target Prices
Analysts set a clear target consensus for Abbott Laboratories, reflecting moderate upside potential.
| Target Low | Target High | Consensus |
|---|---|---|
| 120 | 152 | 134.64 |
The target range from 120 to 152 indicates cautious optimism. The consensus at 134.64 suggests steady growth aligned with sector expectations.

Don’t Let Luck Decide Your Entry Point
Optimize your entry points with our advanced ProRealTime indicators. You’ll get efficient buy signals with precise price targets for maximum performance. Start outperforming now!
Analyst & Consumer Opinions
This section examines Abbott Laboratories’ recent analyst ratings alongside consumer feedback to assess market sentiment.
Stock Grades
The following table presents recent verified analyst grades for Abbott Laboratories from recognized financial institutions:
| Grading Company | Action | New Grade | Date |
|---|---|---|---|
| Barclays | Maintain | Overweight | 2026-02-02 |
| RBC Capital | Maintain | Outperform | 2026-01-23 |
| Evercore ISI Group | Maintain | Outperform | 2026-01-23 |
| Oppenheimer | Maintain | Outperform | 2026-01-23 |
| Bernstein | Maintain | Outperform | 2026-01-23 |
| BTIG | Maintain | Buy | 2026-01-23 |
| Citigroup | Maintain | Buy | 2026-01-23 |
| Piper Sandler | Maintain | Overweight | 2026-01-23 |
| Bernstein | Maintain | Outperform | 2026-01-09 |
| Barclays | Maintain | Overweight | 2026-01-05 |
The grades consistently reflect a positive outlook, with all firms maintaining buy or outperform ratings. This consensus highlights analyst confidence in Abbott’s performance momentum and strategic positioning.
Consumer Opinions
Abbott Laboratories inspires a mix of confidence and caution among its customers, reflecting its broad product portfolio and market presence.
| Positive Reviews | Negative Reviews |
|---|---|
| Reliable and innovative medical devices. | High prices for some healthcare products. |
| Excellent customer service and support. | Occasional delays in product availability. |
| Strong reputation for quality and safety. | Complex warranty and return policies. |
Overall, consumers praise Abbott for product reliability and strong customer support. However, pricing and logistical issues remain recurring concerns, signaling areas for operational improvement.
Risk Analysis
Below is a summary of key risks facing Abbott Laboratories, categorized by their likelihood and potential impact:
| Category | Description | Probability | Impact |
|---|---|---|---|
| Profitability | Negative ROIC (-46.07%) signals inefficient capital use, risking shareholder value erosion. | Medium | High |
| Liquidity | Unfavorable current and quick ratios indicate potential short-term financial stress. | Medium | Medium |
| Valuation | High P/E of 33.55 suggests the stock may be overvalued relative to earnings growth. | Medium | Medium |
| Operational Efficiency | Low or zero asset turnover ratios suggest underutilized assets, impacting revenue generation. | Medium | Medium |
| Financial Leverage | Favorable debt-to-equity and interest coverage ratios mitigate bankruptcy risk despite weaknesses. | Low | Low |
| Market Volatility | Beta of 0.75 indicates lower volatility than the market, reducing systemic risk exposure. | Low | Low |
The most critical risk is Abbott’s deeply negative ROIC, which historically signals that the company destroys value relative to its cost of capital (WACC 6.81%). This inefficiency poses a substantial long-term threat despite a safe Altman Z-Score of 5.39. Meanwhile, poor liquidity metrics require monitoring as they could constrain operational flexibility. Given the premium valuation, investors should remain cautious about market expectations.
Should You Buy Abbott Laboratories?
Abbott Laboratories appears to be a company with deteriorating profitability and a very unfavorable competitive moat, as it seems to be shedding value. Despite a manageable debt profile suggested by a safe Altman Z-Score, the overall rating could be seen as a cautious C, reflecting significant operational challenges and mixed financial strength.
Strength & Efficiency Pillars
Abbott Laboratories posts a solid net margin of 14.72%, reflecting operational strength. Its EBIT margin of 19.37% further supports efficient core business performance. The company maintains a low interest expense ratio at 0.77%, reducing financial burden. However, with a ROIC of -46.07% falling well below the WACC of 6.81%, Abbott is currently destroying value rather than creating it. This indicates challenges in converting capital into profitable growth despite admirable operational margins.
Weaknesses and Drawbacks
Abbott’s financial profile shows notable weaknesses. The price-to-earnings ratio stands high at 33.55, signaling an elevated market valuation that may limit upside. Liquidity ratios are concerning, with both current and quick ratios flagged as unfavorable, posing a risk to short-term financial flexibility. Return on equity and assets scores are very unfavorable, underscoring poor returns for shareholders. While the Altman Z-Score at 5.39 places the company in the safe zone, these valuation and leverage concerns merit caution.
Our Final Verdict about Abbott Laboratories
Abbott Laboratories displays operational robustness but struggles with capital efficiency and valuation risks. The safe Altman Z-Score suggests solvency is not an immediate concern. Despite a bearish price trend and slight market deceleration, recent buyer dominance at 50.59% is neutral. The profile might appear attractive for investors seeking operational strength but suggests prudence due to weak value creation and stretched valuation. A wait-and-see approach could benefit investors awaiting clearer signs of improved capital returns.
Disclaimer: This content is for informational purposes only and does not constitute financial, investment, or other professional advice. Investing in financial markets involves a significant risk of loss, and past performance is not indicative of future results.
Additional Resources
- Abbott Laboratories $ABT Shares Sold by Tredje AP fonden – MarketBeat (Feb 21, 2026)
- Pay Less, Gain More: STE, RMD Top Abbott Laboratories Stock – Trefis (Feb 21, 2026)
- Abbott Laboratories (ABT) Announces Positive Results for Amulet 360 Left Atrial Appendage (LAA) Occlude – Yahoo Finance (Feb 20, 2026)
- Decoding Abbott Laboratories (ABT): A Strategic SWOT Insight – GuruFocus (Feb 21, 2026)
- Investors – Abbott (Dec 12, 2025)
For more information about Abbott Laboratories, please visit the official website: abbott.com