Home > Analyses > Industrials > A. O. Smith Corporation
A. O. Smith Corporation powers everyday comfort by delivering essential water heating and treatment solutions worldwide. Its advanced technologies serve homes, businesses, and institutions across North America, China, Europe, and India. Renowned for innovation, quality, and a diversified product lineup, AOS stands tall in the industrial machinery sector. As market dynamics evolve, I explore whether its robust fundamentals still justify its valuation and growth prospects in 2026.

Table of contents
Business Model & Company Overview
A. O. Smith Corporation, founded in 1874 and headquartered in Milwaukee, Wisconsin, commands a leading position in the industrial machinery sector. Its core business integrates residential and commercial water heating, boilers, and water treatment solutions into a cohesive ecosystem. This breadth serves diverse customers, from homes to large commercial buildings, under trusted brands like A. O. Smith, State, and Lochinvar.
The company’s revenue engine balances durable hardware with recurring demand for maintenance and water treatment products. It operates through North America and Rest of World segments, leveraging strong footholds in the Americas, Europe, China, and India. This global reach, combined with a multi-channel distribution strategy, fortifies its competitive advantage. A. O. Smith’s deep product integration and international presence create a sustainable economic moat shaping the water heating industry’s future.
Financial Performance & Fundamental Metrics
I analyze A. O. Smith Corporation’s income statement, key financial ratios, and dividend payout policy to assess its fiscal health and shareholder value.
Income Statement
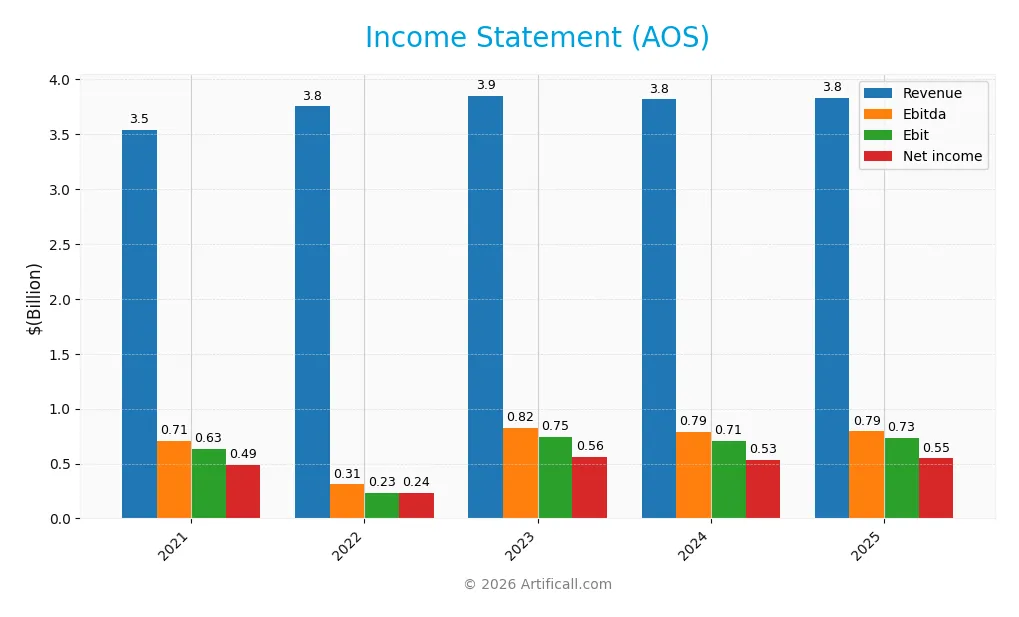
Below is A. O. Smith Corporation’s income statement summary for the past five fiscal years, providing key financial metrics for analysis.
| 2021 | 2022 | 2023 | 2024 | 2025 | |
|---|---|---|---|---|---|
| Revenue | 3.54B | 3.75B | 3.85B | 3.82B | 3.83B |
| Cost of Revenue | 2.23B | 2.42B | 2.37B | 2.36B | 2.34B |
| Operating Expenses | 701M | 671M | 727M | 739M | 759M |
| Gross Profit | 1.31B | 1.33B | 1.48B | 1.46B | 1.49B |
| EBITDA | 708M | 310M | 824M | 787M | 792M |
| EBIT | 630M | 233M | 746M | 708M | 729M |
| Interest Expense | 4.3M | 9.4M | 12M | 6.7M | 13.5M |
| Net Income | 487M | 236M | 557M | 534M | 546M |
| EPS | 3.05 | 1.52 | 3.71 | 3.65 | 3.86 |
| Filing Date | 2022-02-11 | 2023-02-14 | 2024-02-13 | 2025-02-11 | 2026-02-10 |
Income Statement Evolution
From 2021 to 2025, A. O. Smith Corporation’s revenue grew moderately by 8.2%, with a slight slowdown to 0.3% in the last year. Gross profit showed steady improvement, while operating expenses grew at a similar pace to revenue in 2025. Margins remained stable, with gross margin near 39% and EBIT margin around 19%, indicating consistent profitability.
Is the Income Statement Favorable?
The 2025 income statement reveals solid fundamentals. Net income increased by 2% year-over-year, pushing net margin to 14.3%. Interest expense remains low at 0.35% of revenue, reflecting disciplined capital structure management. EPS growth of 6.3% outpaced net income growth, signaling effective share management. Overall, profitability and margin trends support a favorable evaluation.
Financial Ratios
The table below presents key financial ratios for A. O. Smith Corporation from 2021 through 2025, reflecting profitability, valuation, liquidity, leverage, efficiency, and dividend metrics:
| Ratios | 2021 | 2022 | 2023 | 2024 | 2025 |
|---|---|---|---|---|---|
| Net Margin | 14% | 6% | 14% | 14% | 14% |
| ROE | 27% | 13% | 30% | 28% | 29% |
| ROIC | 20% | 27% | 25% | 23% | 24% |
| P/E | 28.2x | 37.6x | 22.2x | 18.8x | 17.1x |
| P/B | 7.49x | 5.07x | 6.70x | 5.32x | 5.04x |
| Current Ratio | 1.57 | 1.75 | 1.59 | 1.55 | 1.50 |
| Quick Ratio | 1.17 | 1.20 | 1.06 | 0.96 | 0.94 |
| D/E | 0.12 | 0.21 | 0.08 | 0.12 | 0.12 |
| Debt-to-Assets | 6% | 11% | 5% | 7% | 7% |
| Interest Coverage | 142x | 70x | 63x | 107x | 54x |
| Asset Turnover | 1.02 | 1.13 | 1.20 | 1.18 | 1.22 |
| Fixed Asset Turnover | 5.54 | 6.05 | 6.07 | 5.77 | 5.62 |
| Dividend Yield | 1.2% | 2.0% | 1.5% | 1.9% | 2.1% |
Evolution of Financial Ratios
Return on Equity (ROE) slightly declined from 30.2% in 2023 to 29.4% in 2025, showing stable high profitability. The Current Ratio decreased from 1.59 to 1.50, indicating mild reduction in liquidity but still within reasonable range. Debt-to-Equity Ratio rose modestly from 0.08 to 0.12, reflecting cautious leverage increase without risking solvency.
Are the Financial Ratios Favorable?
In 2025, profitability ratios like net margin (14.3%) and ROE (29.4%) remain favorable, signaling efficient capital use. Liquidity ratios, including current (1.5) and quick (0.94), are neutral, suggesting balanced short-term asset coverage. Leverage ratios such as debt-to-equity (0.12) and interest coverage (54.0) are favorable, confirming low financial risk. Price-to-book ratio (5.04) is unfavorable, indicating potential overvaluation. Overall, the ratios present a favorable financial profile with manageable risks.
Shareholder Return Policy
A. O. Smith pays consistent dividends with a payout ratio around 35%, supported by a dividend yield near 2.1%. The dividend per share has steadily increased from $1.06 in 2021 to $1.40 in 2025, reflecting stable cash flow coverage and moderate capital expenditure.
The company also engages in share buybacks, complementing its dividend strategy. This balanced approach suggests a shareholder return policy focused on sustainable long-term value creation, balancing income distribution with reinvestment and financial prudence.
Score analysis
The following radar chart illustrates key financial scores for A. O. Smith Corporation:
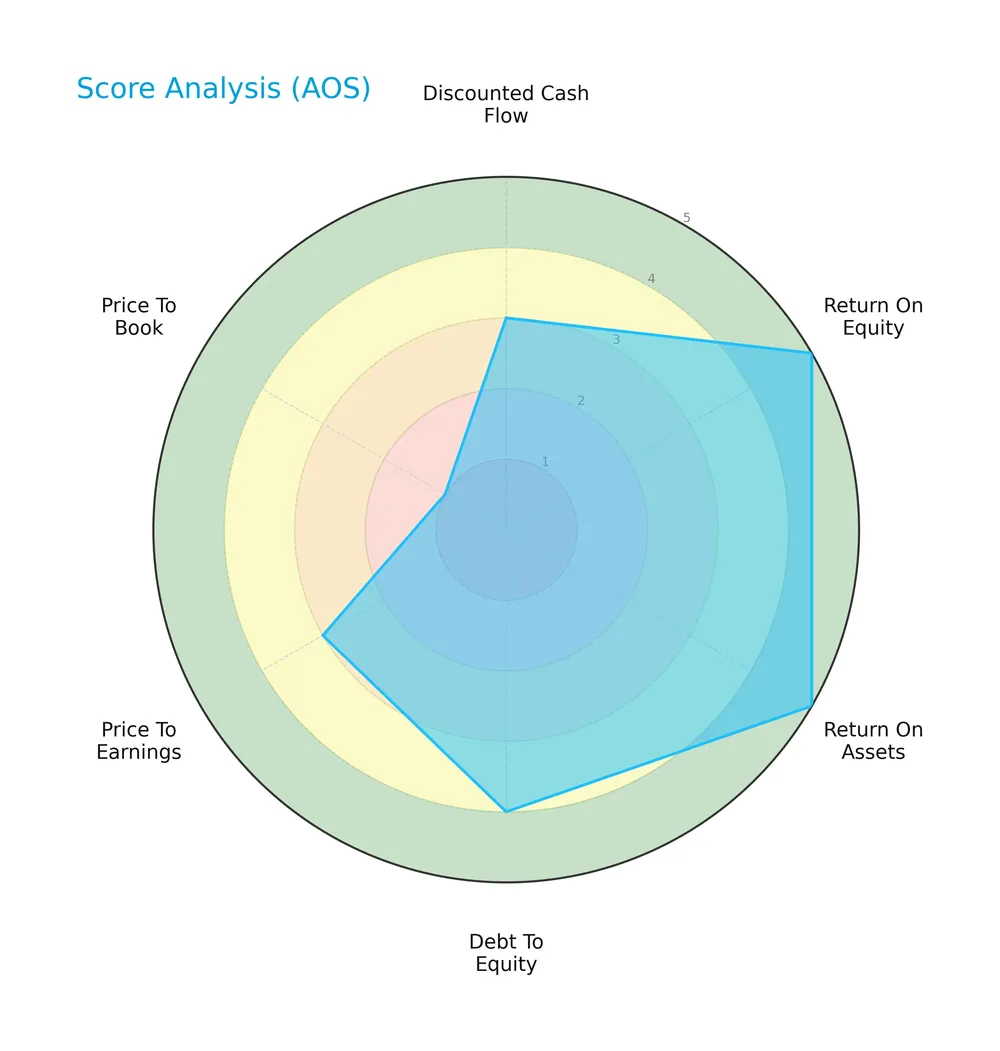
The company scores very favorably in return on equity and assets, reflecting strong profitability. Debt-to-equity is favorable, indicating prudent leverage. Discounted cash flow and price-to-earnings scores are moderate, while price-to-book lags significantly.
Analysis of the company’s bankruptcy risk
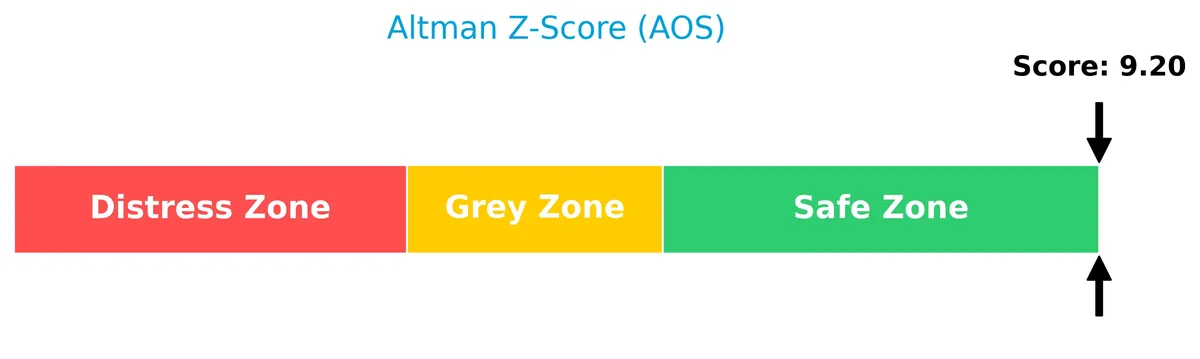
The Altman Z-Score places the company firmly in the safe zone, indicating low bankruptcy risk and solid financial stability:
Is the company in good financial health?
The Piotroski Score diagram highlights the company’s strong position based on nine key financial criteria:
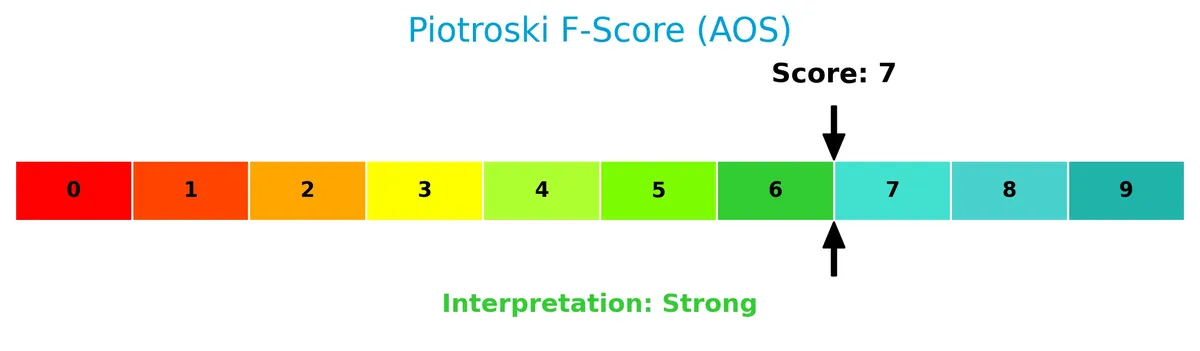
With a score of 7, the company demonstrates strong financial health, signaling efficient operations and solid fundamentals compared to peers.
Competitive Landscape & Sector Positioning
This sector analysis reviews A. O. Smith Corporation’s strategic positioning within industrial machinery. I will assess revenue breakdown, key products, and main competitors. The goal is to determine if A. O. Smith holds a competitive advantage over its peers.
Strategic Positioning
A. O. Smith concentrates on water heating and treatment products across North America and Rest of World segments. In 2025, North America generated $2.62B, while Rest of World contributed $1.21B. The firm balances mature domestic markets with growing international exposure.
Revenue by Segment
This pie chart illustrates the revenue distribution across A. O. Smith Corporation’s reportable segments for the fiscal year 2025.
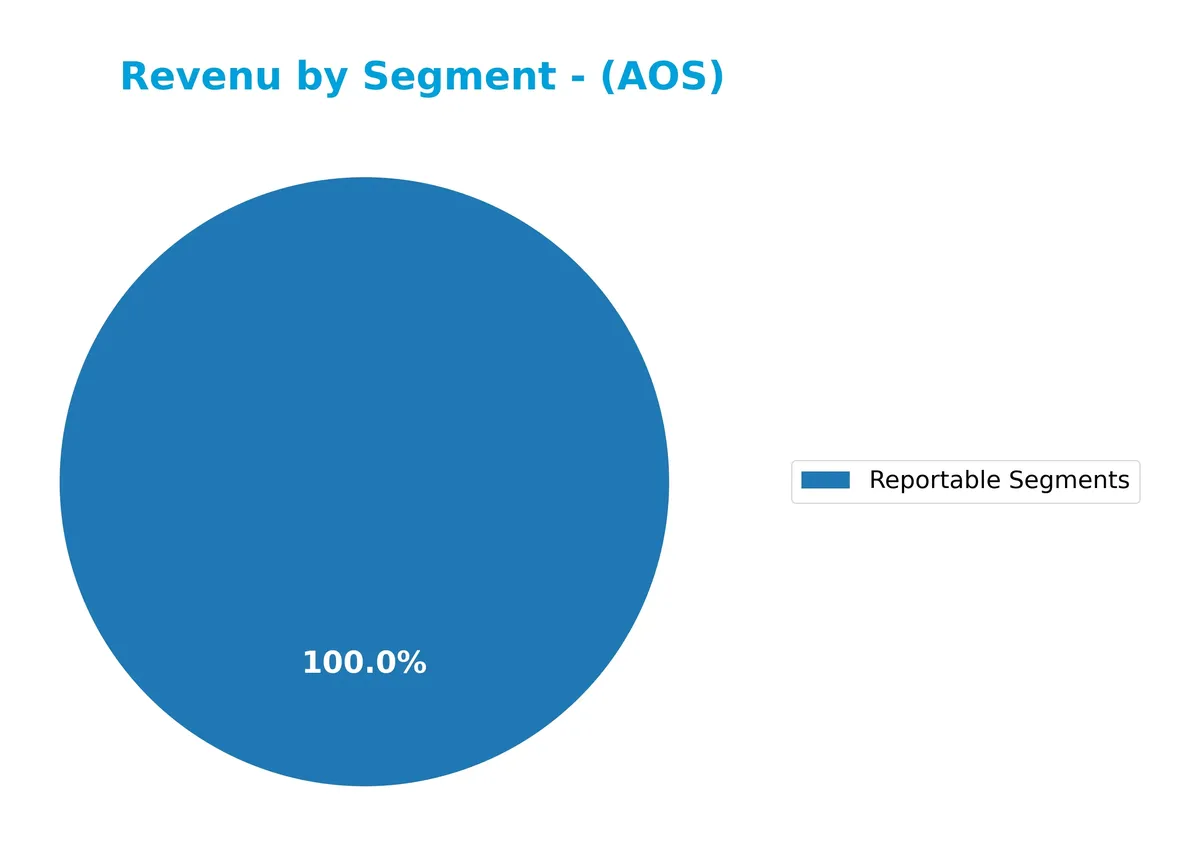
A. O. Smith’s revenue is consolidated under a single reportable segment totaling 3.83B in 2025. This concentration suggests a focused business model without notable diversification across multiple segments. The steady revenue base indicates stability, though investors should monitor for potential concentration risks if growth depends heavily on this single segment.
Key Products & Brands
A. O. Smith Corporation offers a diversified range of water heating and treatment products globally:
| Product | Description |
|---|---|
| Residential Water Heaters | Gas, heat pump, and electric models for homes, apartments, and condominiums. |
| Commercial Water Heaters | Units for restaurants, hotels, motels, offices, laundries, car washes, and small businesses. |
| Commercial Boilers | Boilers designed for hospitals, schools, hotels, and other large commercial buildings. |
| Residential Boilers | Boilers for residential use in homes, apartments, and condominiums. |
| Water Treatment Products | Point-of-entry water softeners, well water solutions, whole-home filtration, on-the-go bottles, and RO systems. |
| Food and Beverage Filtration | Filtration products tailored for food and beverage applications. |
| Expansion Tanks & Solar Systems | Commercial solar water heating systems, swimming pool and spa heaters, and related parts. |
| Heat Pumps & Tankless Water Heaters | Electric wall-hung, gas tankless, combi-boiler, heat pump, and solar water heaters. |
| Brands | Products marketed primarily under A. O. Smith, State, Lochinvar, water softener brands, and Aquasana. |
A. O. Smith’s portfolio spans essential heating and water treatment solutions. It serves residential, commercial, and industrial customers through multiple channels worldwide, leveraging strong brand recognition in the market.
Main Competitors
There are 24 competitors in the Industrials sector; below is a table of the top 10 leaders by market capitalization:
| Competitor | Market Cap. |
|---|---|
| Eaton Corporation plc | 127B |
| Parker-Hannifin Corporation | 114B |
| Howmet Aerospace Inc. | 85.2B |
| Emerson Electric Co. | 76.3B |
| Illinois Tool Works Inc. | 73B |
| Cummins Inc. | 71.9B |
| AMETEK, Inc. | 48.3B |
| Roper Technologies, Inc. | 46.8B |
| Rockwell Automation, Inc. | 44.8B |
| Symbotic Inc. | 35.9B |
A. O. Smith Corporation ranks 18th among 24 competitors, with a market cap roughly 9% of the sector leader Eaton Corporation plc. It sits below both the average market cap of the top 10 competitors (72B) and the sector median (32.4B). The company maintains an 18% market cap gap from its closest competitor above, highlighting its smaller scale within the top tier.
Comparisons with competitors
Check out how we compare the company to its competitors:
Does AOS have a competitive advantage?
A. O. Smith Corporation demonstrates a sustainable competitive advantage, supported by a very favorable moat status and a 14% ROIC above its WACC. Its growing ROIC trend confirms efficient capital use and value creation.
The company’s global presence in water heating and treatment products across North America, China, Europe, and India offers diverse growth opportunities. Continued innovation in heat pumps, solar water heaters, and filtration products supports a positive future outlook.
SWOT Analysis
This analysis highlights A. O. Smith Corporation’s internal strengths and weaknesses alongside external opportunities and threats.
Strengths
- strong ROIC well above WACC
- diversified product portfolio
- solid market position in North America
Weaknesses
- modest revenue growth recently
- high price-to-book ratio
- reliance on traditional markets
Opportunities
- expansion in emerging markets
- growth in water treatment segment
- adoption of energy-efficient technologies
Threats
- competitive pressure from low-cost producers
- raw material cost volatility
- regulatory changes on emissions
A. O. Smith’s durable competitive advantage and profitability support growth, but it must address valuation concerns and diversify revenue streams. Strategic focus on innovation and geographic expansion is key to mitigating external risks.
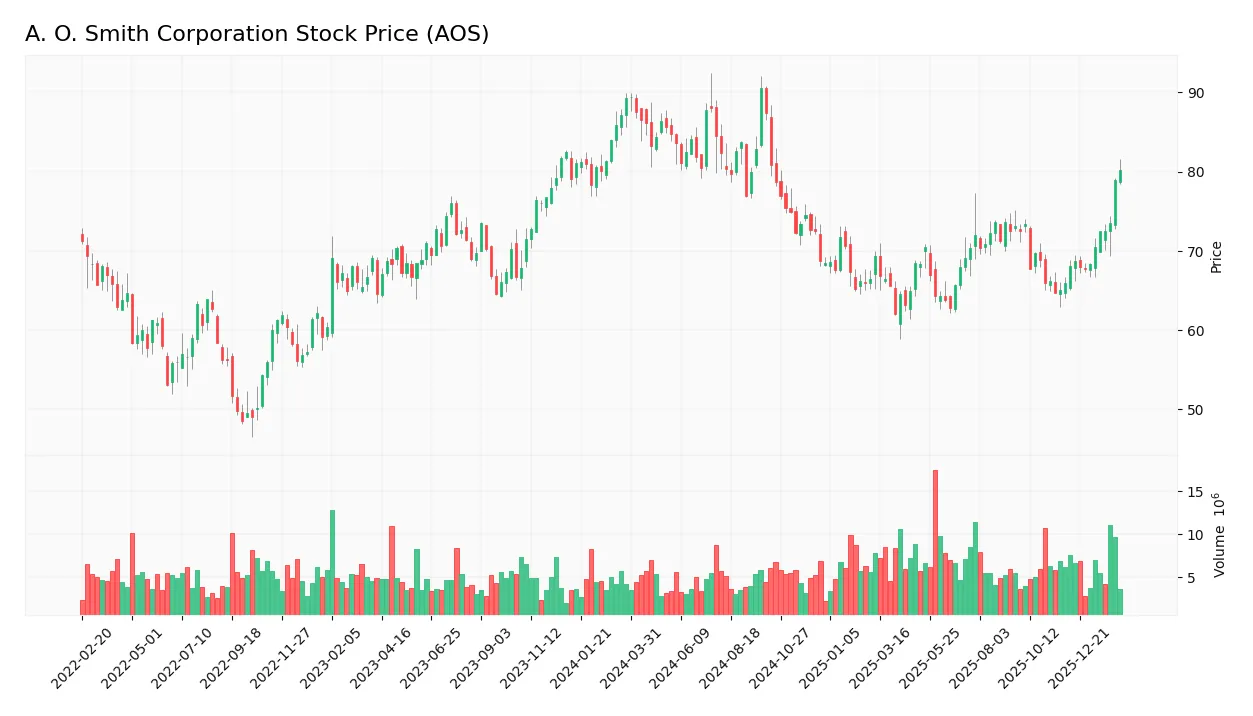
Stock Price Action Analysis
The weekly stock chart below illustrates A. O. Smith Corporation’s price movements and volatility over the past 12 months:
Trend Analysis
Over the past 12 months, AOS’s stock price declined by 10.15%, signaling a bearish trend with accelerating downward momentum. The price fluctuated between a high of 90.59 and a low of 61.99, with notable volatility shown by a 7.71 standard deviation.
Volume Analysis
Trading volume has increased, with total activity near 679M shares. Buyer volume slightly exceeds seller volume at 50.15%, indicating mild buyer control overall. Over the recent three months, buyers dominate strongly at 81.65%, reflecting robust investor interest and positive market participation.
Target Prices
Analysts set a clear target consensus for A. O. Smith Corporation, reflecting moderate upside potential.
| Target Low | Target High | Consensus |
|---|---|---|
| 75 | 85 | 78 |
The target range suggests steady growth expectations, with a consensus price implying a balanced risk-reward profile.

Don’t Let Luck Decide Your Entry Point
Optimize your entry points with our advanced ProRealTime indicators. You’ll get efficient buy signals with precise price targets for maximum performance. Start outperforming now!
Analyst & Consumer Opinions
This section examines the latest analyst ratings and consumer feedback for A. O. Smith Corporation (AOS).
Stock Grades
Here are the recent stock grades from reputable financial institutions for A. O. Smith Corporation:
| Grading Company | Action | New Grade | Date |
|---|---|---|---|
| DA Davidson | Maintain | Neutral | 2026-02-02 |
| Stifel | Maintain | Buy | 2026-01-30 |
| Citigroup | Maintain | Neutral | 2026-01-30 |
| DA Davidson | Maintain | Neutral | 2025-11-13 |
| Stifel | Maintain | Buy | 2025-10-29 |
| Citigroup | Maintain | Neutral | 2025-10-29 |
| Oppenheimer | Maintain | Outperform | 2025-07-28 |
| UBS | Maintain | Neutral | 2025-07-28 |
| Stifel | Maintain | Buy | 2025-07-25 |
| Baird | Maintain | Neutral | 2025-07-25 |
The overall grading trend shows a predominance of Neutral ratings with a consistent Buy stance from Stifel. This mixed but steady pattern reflects a cautious optimism among analysts.
Consumer Opinions
Consumers express mixed sentiment about A. O. Smith Corporation, reflecting its strong product reliability yet some service challenges.
| Positive Reviews | Negative Reviews |
|---|---|
| “Durable and energy-efficient water heaters.” | “Customer service response times are slow.” |
| “Installation was straightforward and well-documented.” | “Replacement parts can be expensive and hard to find.” |
| “Good value for the price with consistent performance.” | “Warranty claim process is complicated and slow.” |
Overall, customers praise A. O. Smith for reliable, energy-saving products. However, service delays and warranty issues appear as recurring pain points.
Risk Analysis
Below is a table summarizing key risks that may influence A. O. Smith Corporation’s performance and valuation:
| Category | Description | Probability | Impact |
|---|---|---|---|
| Market Volatility | Beta of 1.34 indicates above-average sensitivity to market swings. | Medium | Medium |
| Valuation Risk | High price-to-book ratio (5.04) suggests potential overvaluation. | Medium | High |
| Liquidity Risk | Quick ratio below 1 (0.94) signals tight short-term liquidity. | Low | Medium |
| Competitive Risk | Exposure to cyclical industrial machinery sector with global competition. | Medium | High |
| Geographic Risk | Operations in diverse but volatile markets including China and India. | Medium | Medium |
| Interest Rate Risk | Despite strong interest coverage (54x), rising rates could pressure margins. | Low | Medium |
A. O. Smith’s most significant risks lie in its elevated valuation and cyclical industry exposure. The 5.04 price-to-book ratio signals less margin for error amid economic downturns. Additionally, its 1.34 beta underlines susceptibility to market turbulence. The company’s strong Altman Z-Score (9.2) and Piotroski Score (7) mitigate bankruptcy fears, but investors should monitor liquidity and global market shifts closely.
Should You Buy A. O. Smith Corporation?
A. O. Smith Corporation appears to be a robust value creator with a durable competitive moat, evidenced by growing ROIC well above WACC. Its leverage profile remains manageable, supporting an overall very favorable A- rating, though valuation metrics suggest moderate caution.
Strength & Efficiency Pillars
A. O. Smith Corporation exhibits robust profitability with a net margin of 14.26% and a return on equity (ROE) of 29.4%. The return on invested capital (ROIC) stands at a strong 23.94%, significantly above the weighted average cost of capital (WACC) at 9.98%. This confirms the company as a clear value creator. Operational efficiency is further highlighted by favorable gross and EBIT margins of 38.83% and 19.04%, respectively, underscoring solid core business performance.
Weaknesses and Drawbacks
A. O. Smith’s valuation presents risks, notably a high price-to-book ratio of 5.04, signaling potential overvaluation relative to its book value. The price-to-earnings ratio of 17.13 is moderate but warrants attention given the premium pricing environment. Liquidity metrics such as a current ratio of 1.5 and a quick ratio of 0.94 suggest neutral short-term financial flexibility. Despite favorable leverage with a debt-to-equity ratio of 0.12, investors should monitor valuation pressures and market volatility.
Our Final Verdict about A. O. Smith Corporation
A. O. Smith’s financial health is strong, supported by a safe Altman Z-score of 9.20 and a Piotroski score of 7, indicating resilience and solid fundamentals. Although the overall stock trend has been bearish with a 10.15% decline, recent buyer dominance of 81.65% signals renewed interest. The profile may appear attractive for long-term exposure but suggests a cautious approach as the market recovers.
Disclaimer: This content is for informational purposes only and does not constitute financial, investment, or other professional advice. Investing in financial markets involves a significant risk of loss, and past performance is not indicative of future results.
Additional Resources
- Oppenheimer & Co. Inc. Buys 64,648 Shares of A. O. Smith Corporation $AOS – MarketBeat (Feb 11, 2026)
- Thrivent Financial for Lutherans Sells 21,581 Shares of A. O. Smith Corporation $AOS – MarketBeat (Feb 11, 2026)
- A. O. Smith Corporation (NYSE:AOS) Just Released Its Yearly Earnings: Here’s What Analysts Think – Yahoo Finance (Feb 01, 2026)
- A. O. Smith Reports Record 2025 Diluted Earnings Per Share (EPS) of $3.85 and Introduces 2026 Guidance – PR Newswire (Jan 29, 2026)
- Should You Buy A. O. Smith Corporation (NYSE:AOS) For Its Upcoming Dividend? – Sahm (Jan 26, 2026)
For more information about A. O. Smith Corporation, please visit the official website: aosmith.com