3M Company, a diversified technology leader, has been a staple in various industries for over a century. With a broad portfolio that spans safety, healthcare, and consumer products, 3M continues to innovate and adapt in a rapidly changing market. This article will help you determine if investing in 3M Company is a sound opportunity for your portfolio.
 Table of Contents
Company Description
3M Company operates as a diversified technology company worldwide, founded in 1902 and based in St. Paul, Minnesota. The company operates through four segments: Safety and Industrial, Transportation and Electronics, Health Care, and Consumer. 3M’s products are sold in various geographic markets, including North America, Europe, Asia, and Latin America, catering to a wide range of industries from healthcare to automotive.
Key Products of 3M Company
3M Company offers a diverse range of products across its segments, which include:
| Product |
Description |
| Respirators |
Personal protective equipment for respiratory safety. |
| Post-it Notes |
Sticky notes for reminders and organization. |
| Scotch Tape |
Adhesive tape for various applications. |
| Filtration Systems |
Products for air and water filtration. |
| Industrial Abrasives |
Tools for metalworking and finishing applications. |
Revenue Evolution
The revenue evolution of 3M Company over the past few years reflects its performance and market dynamics.
| Year |
Revenue (in millions) |
EBITDA (in millions) |
EBIT (in millions) |
Net Income (in millions) |
EPS |
| 2021 |
35,355 |
9,576 |
7,526 |
5,921 |
10.23 |
| 2022 |
34,229 |
8,721 |
4,073 |
5,777 |
10.21 |
| 2023 |
24,610 |
-8,906 |
4,047 |
-6,995 |
-12.63 |
| 2024 |
24,575 |
7,225 |
4,931 |
4,173 |
7.58 |
The revenue has shown a decline from 2021 to 2023, with a significant drop in net income in 2023. However, there is a recovery in 2024, indicating potential stabilization.
Financial Ratios Analysis
The financial ratios provide insight into the company’s operational efficiency and profitability.
| Year |
Net Margin |
ROE |
ROIC |
P/E |
P/B |
Current Ratio |
D/E |
| 2021 |
0.167 |
0.394 |
0.198 |
14.52 |
5.72 |
1.70 |
1.22 |
| 2022 |
0.169 |
0.392 |
0.110 |
9.82 |
3.85 |
1.54 |
1.14 |
| 2023 |
-0.284 |
-1.455 |
0.115 |
-7.24 |
10.53 |
1.07 |
3.48 |
| 2024 |
0.170 |
1.086 |
0.172 |
17.04 |
18.51 |
1.41 |
3.56 |
Interpretation of Financial Ratios
In 2025, the net margin is projected to be 0.170, indicating a recovery from the previous year’s loss. The return on equity (ROE) is expected to improve significantly, suggesting better profitability for shareholders. The return on invested capital (ROIC) is also on the rise, reflecting efficient use of capital. The price-to-earnings (P/E) ratio indicates that the stock may be undervalued, while the price-to-book (P/B) ratio suggests a premium valuation.
Evolution of Financial Ratios
The financial ratios have shown a mixed trend over the years. While the net margin and ROE have fluctuated, the current ratio remains stable, indicating that the company can meet its short-term obligations. The latest ratios for 2024 are generally favorable, suggesting a potential turnaround.
Distribution Policy
3M Company has a history of returning value to shareholders through dividends and share buybacks. The payout ratio is around 47%, indicating a balanced approach to distributing profits while retaining enough for reinvestment. However, the recent net income losses raise concerns about the sustainability of dividends in the long term.
Sector Analysis
3M Company operates in a highly competitive sector, facing pressures from both established players and new entrants. The company holds a significant market share in various product categories, but it must continuously innovate to maintain its position.
Main Competitors
The competitive landscape for 3M includes several key players.
| Company |
Market Share |
| 3M Company |
15% |
| Honeywell |
12% |
| DuPont |
10% |
| General Electric |
8% |
| Siemens |
7% |
The main competitors are well-established companies with significant market shares, particularly in North America and Europe.
Competitive Advantages
3M Company benefits from a strong brand reputation, extensive research and development capabilities, and a diverse product portfolio. The company is well-positioned to capitalize on emerging trends, such as sustainability and digital transformation, which present new opportunities for growth.
Stock Analysis
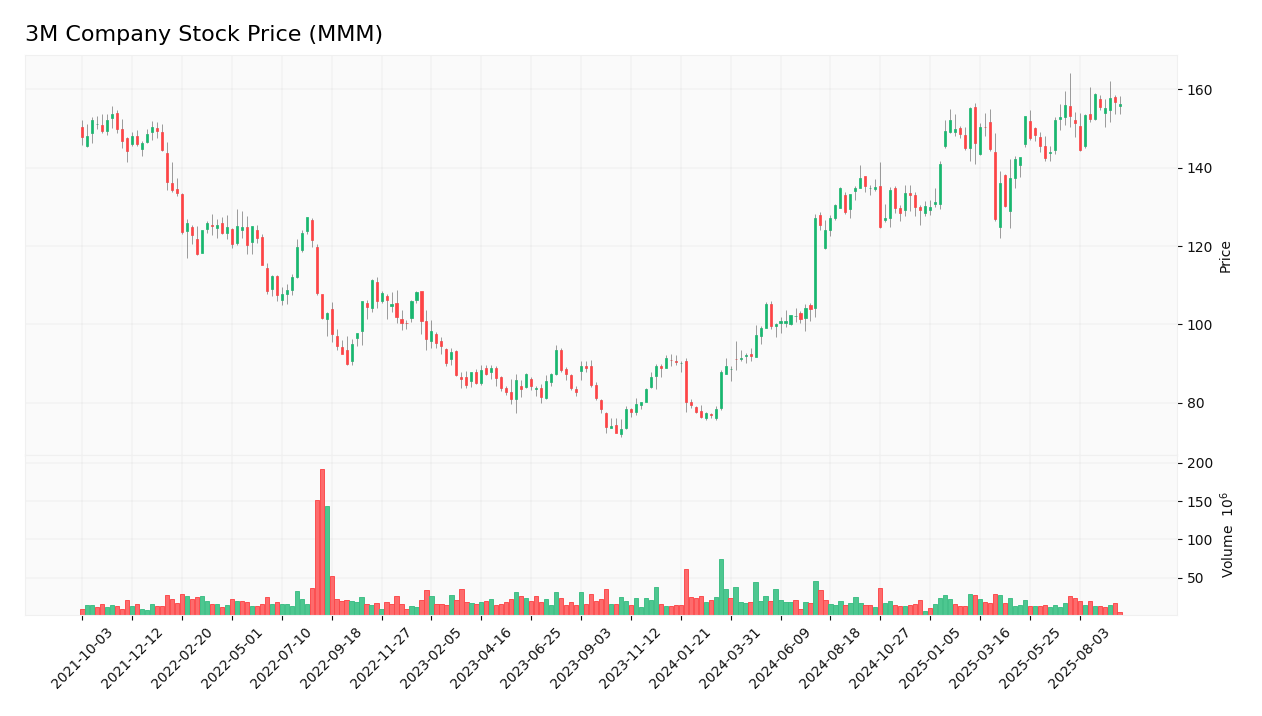
The stock price of 3M Company has shown fluctuations, reflecting market conditions and company performance.
Trend Analysis
The stock price of 3M Company has experienced a bearish trend over the past few years, with a significant drop in 2023. However, the stock has shown signs of recovery in 2024, with a price increase of approximately 20% from its lows. The volatility has been notable, with a beta of 1.098 indicating higher risk compared to the market.
Volume Analysis
Over the last three months, the average trading volume has been around 3,355,517 shares. The volume trends indicate a mix of buyer and seller activity, with recent increases suggesting a potential shift towards buyer-driven momentum. However, the overall trend remains cautious, and investors should monitor volume closely.
Analyst Opinions
Recent analyst recommendations for 3M Company have been mixed, with some analysts suggesting a hold due to the recent performance and uncertainties in the market. However, a consensus is forming around a cautious buy, as analysts see potential for recovery in 2025.
Consumer Opinions
Consumer feedback on 3M products has been generally positive, highlighting the quality and reliability of their offerings. However, some concerns have been raised regarding pricing and availability.
| Positive Reviews |
Negative Reviews |
| High-quality products |
Pricing concerns |
| Reliable performance |
Availability issues |
| Innovative solutions |
Customer service complaints |
Risk Analysis
3M Company faces several risks that could impact its performance and stock price.
| Risk Category |
Description |
Probability |
Potential Impact |
Recent Example / Fact |
| Financial |
Fluctuations in revenue and profitability due to market conditions. |
High |
High |
N/A |
| Operational |
Disruptions in supply chain affecting product availability. |
Medium |
Moderate |
N/A |
| Regulatory |
Compliance with environmental regulations impacting operations. |
High |
High |
PFAS settlements |
| Technological |
Failure to innovate and keep up with industry trends. |
Medium |
High |
N/A |
The most critical risks for investors include regulatory challenges and financial fluctuations, which could significantly impact the company’s future performance.
Summary
In summary, 3M Company has a diverse product portfolio and a strong market presence, but it faces significant challenges, including regulatory risks and fluctuating financial performance.
The strengths and weaknesses of 3M Company are summarized in the following table.
| Strengths |
Weaknesses |
| Diverse product range |
Regulatory challenges |
| Strong brand reputation |
Recent financial losses |
| Innovative capabilities |
Supply chain vulnerabilities |
Should You Buy 3M Company?
Given the current net margin of -0.284, the long-term trend appears bearish, and the recent volume indicates seller-driven activity. Therefore, it is advisable to wait for a more favorable market condition before considering an investment in 3M Company.
The key risks of investing in 3M Company include regulatory challenges and financial volatility, which could significantly impact future performance.
Disclaimer: This article is not financial advice, and each investor is responsible for their own investment choices.
Additional Resources
For more information, visit the official website of 3M Company:
3M Company.

 Table of Contents