Home > Analyses > Industrials > 3M Company
3M Company transforms everyday life through its innovative solutions spanning safety, healthcare, electronics, and consumer products. Its industrial abrasives, protective equipment, and healthcare innovations set industry benchmarks. I’ve observed 3M’s ability to blend technology with practical applications, maintaining a robust market presence for over a century. As investors eye 2026, the critical question remains: does 3M’s diverse portfolio and operational strength still justify its premium valuation and growth prospects?
Table of contents
Business Model & Company Overview
3M Company, founded in 1902 and headquartered in Saint Paul, Minnesota, stands as a diversified technology powerhouse. It operates across four integrated segments—Safety and Industrial, Transportation and Electronics, Health Care, and Consumer—offering a cohesive ecosystem of solutions that span from industrial abrasives to healthcare products. This broad portfolio underpins its dominant position within the conglomerates sector, serving a global customer base with innovation at its core.
The company’s revenue engine balances durable hardware like abrasives and adhesives with high-margin software and recurring services in healthcare coding and filtration. Its strategic footprint spans the Americas, Europe, and Asia, leveraging a complex distribution network including e-commerce and traditional channels. 3M’s enduring economic moat lies in its unmatched product breadth and innovation, shaping industry standards for decades.
Financial Performance & Fundamental Metrics
I analyze 3M Company’s income statement, key financial ratios, and dividend payout policy to assess its operational efficiency and shareholder returns.
Income Statement
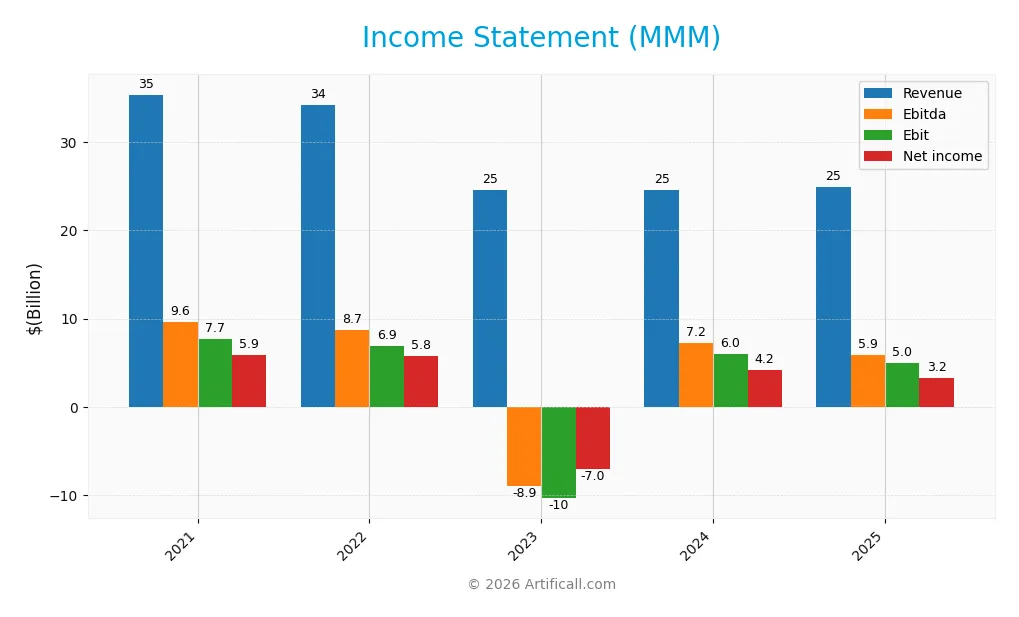
Below is the 3M Company’s income statement summary for the fiscal years 2021 through 2025, showing key profitability and expense metrics.
| 2021 | 2022 | 2023 | 2024 | 2025 | |
|---|---|---|---|---|---|
| Revenue | 35.4B | 34.2B | 24.6B | 24.6B | 24.9B |
| Cost of Revenue | 18.7B | 19.3B | 15.0B | 14.5B | 15.1B |
| Operating Expenses | 9.1B | 10.9B | 5.5B | 5.1B | 5.3B |
| Gross Profit | 16.6B | 15.0B | 9.6B | 10.1B | 9.9B |
| EBITDA | 9.6B | 8.7B | -8.9B | 7.2B | 5.9B |
| EBIT | 7.7B | 6.9B | -10.3B | 6.0B | 5.0B |
| Interest Expense | 457M | 498M | 932M | 1.2B | 720M |
| Net Income | 5.9B | 5.8B | -7.0B | 4.2B | 3.3B |
| EPS | 10.23 | 10.21 | -12.63 | 7.58 | 6.04 |
| Filing Date | 2022-02-09 | 2023-02-08 | 2024-02-07 | 2025-02-05 | 2026-02-03 |
Income Statement Evolution
3M’s revenue declined sharply by nearly 30% from 2021 to 2025, reflecting significant challenges. Net income fell even more, down 45%, indicating margin compression. Gross margin remained relatively stable near 39.5%, but EBIT and net margins declined over the period, showing weakening profitability despite cost controls.
Is the Income Statement Favorable?
In 2025, 3M posted $24.9B in revenue, up 1.5% from 2024, but key profit metrics fell. EBIT dropped 17%, and net margin declined 23%, signaling pressure on earnings quality. Interest expense remains low at 2.9% of revenue, supporting financial stability. Overall, fundamentals are unfavorable due to shrinking profits and margin deterioration.
Financial Ratios
The following table presents key financial ratios for 3M Company from 2021 to 2025, allowing for a clear year-over-year performance comparison:
| Ratios | 2021 | 2022 | 2023 | 2024 | 2025 |
|---|---|---|---|---|---|
| Net Margin | 17% | 17% | -28% | 17% | 13% |
| ROE | 39% | 39% | -146% | 109% | 69% |
| ROIC | 16% | 9% | 8% | 13% | 12% |
| P/E | 14.5 | 9.8 | -7.2 | 17.0 | 26.3 |
| P/B | 5.7 | 3.9 | 10.5 | 18.5 | 18.2 |
| Current Ratio | 1.70 | 1.54 | 1.07 | 1.41 | 1.71 |
| Quick Ratio | 1.15 | 0.98 | 0.81 | 1.08 | 1.33 |
| D/E | 1.22 | 1.14 | 3.48 | 3.56 | 2.75 |
| Debt-to-Assets | 39% | 36% | 33% | 34% | 34% |
| Interest Coverage | 16.5 | 8.2 | 4.3 | 4.2 | 6.3 |
| Asset Turnover | 0.75 | 0.74 | 0.49 | 0.62 | 0.66 |
| Fixed Asset Turnover | 3.44 | 3.42 | 2.95 | 3.09 | 3.28 |
| Dividend Yield | 4.0% | 5.9% | 6.5% | 2.8% | 1.4% |
Evolution of Financial Ratios
Return on Equity (ROE) showed extreme volatility, crashing to -145% in 2023 before rebounding sharply to 69% in 2025. The Current Ratio steadily improved from 1.07 in 2023 to 1.71 in 2025, indicating better liquidity. Debt-to-Equity Ratio remained high, peaking above 3.5 in 2024 but easing to 2.75 by 2025, reflecting some debt reduction. Profitability recovered after a significant dip in 2023.
Are the Financial Ratios Favorable?
Profitability metrics, including net margin (13%) and ROE (69%), are favorable, reflecting strong returns. Liquidity ratios, such as current ratio (1.71) and quick ratio (1.33), also rate favorably, suggesting adequate short-term financial health. However, leverage remains a concern with a high debt-to-equity ratio of 2.75. Market valuation ratios like P/E (26.3) and P/B (18.2) are unfavorable, indicating potential overvaluation. Overall, the ratios appear slightly favorable with balanced risk factors.
Shareholder Return Policy
3M Company maintains a stable dividend policy with a payout ratio near 36% in 2025 and a dividend yield of 1.37%. Dividends per share declined from $3.60 in 2024 to $2.20 in 2025, covered by free cash flow, supporting moderate distributions without excessive strain.
The company also engages in share buybacks, complementing dividends. This balanced approach appears sustainable for long-term shareholder value, though the recent yield decline warrants monitoring amid margin pressures and leverage levels.
Score analysis
The following radar chart visualizes key financial scores that highlight the company’s valuation and profitability metrics:
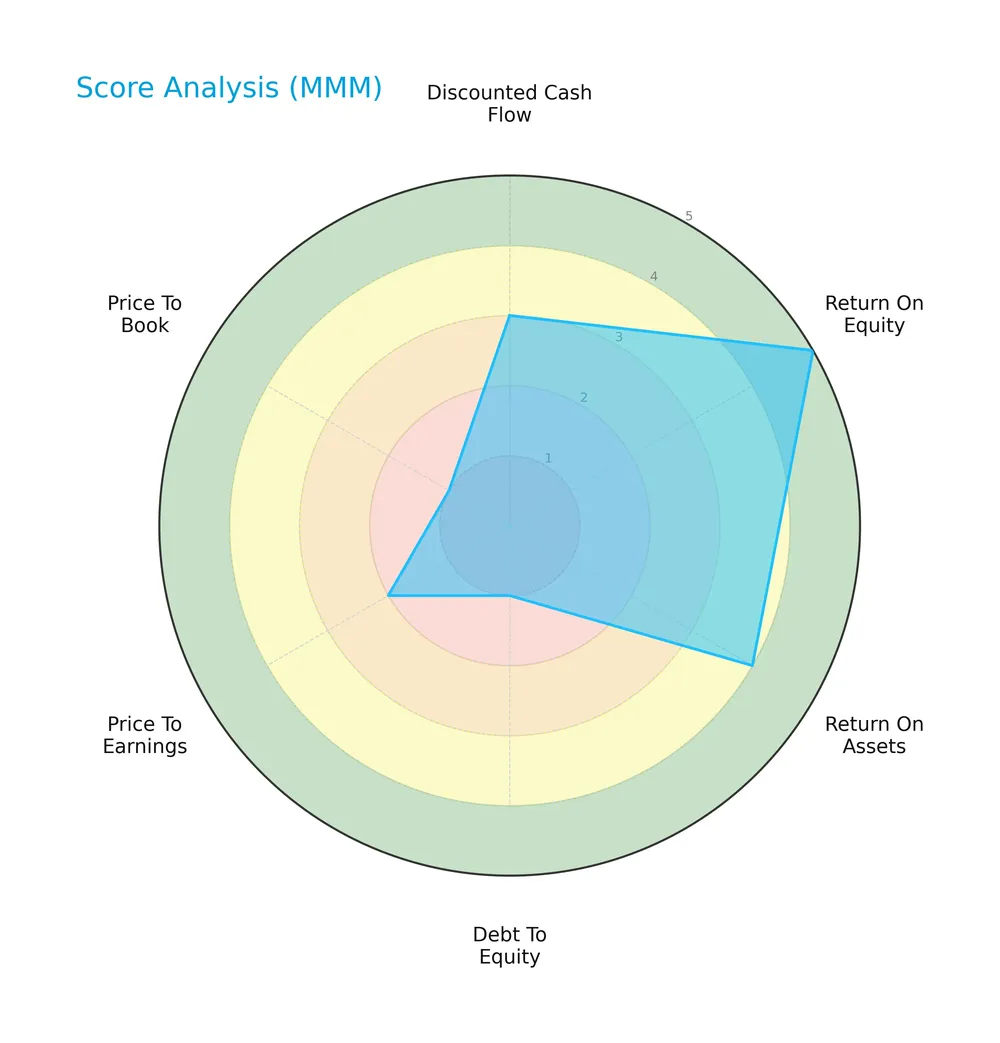
3M Company shows strong returns with a 5 in ROE and a favorable 4 in ROA. However, it carries a heavy debt burden reflected by a very unfavorable 1 in debt-to-equity. Valuation metrics like PE and PB scores remain moderate to unfavorable.
Analysis of the company’s bankruptcy risk
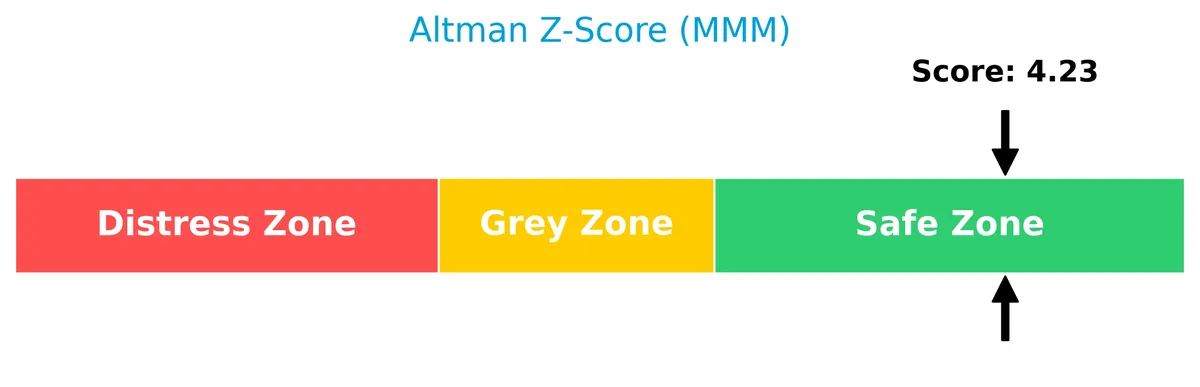
The Altman Z-Score places the company firmly in the safe zone, indicating low bankruptcy risk based on its financial ratios:
Is the company in good financial health?
The Piotroski Score diagram below illustrates the company’s solid financial strength and operational efficiency:
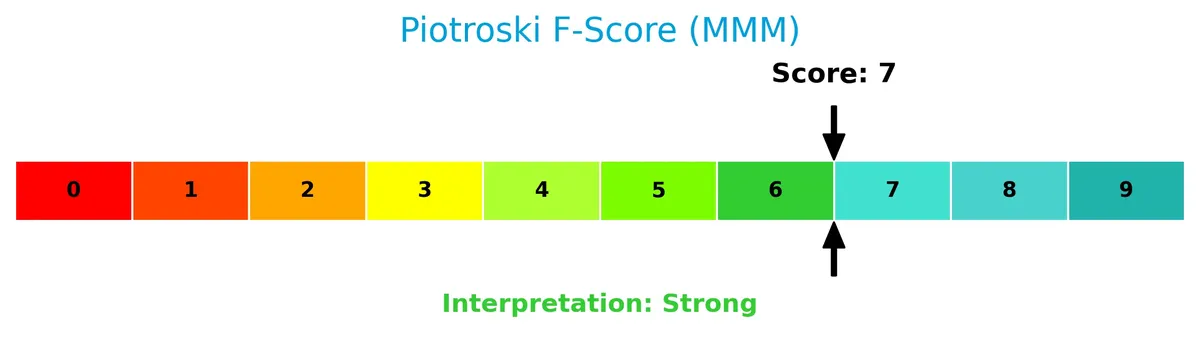
With a score of 7, 3M Company ranks as strong, suggesting robust profitability, liquidity, and effective capital management relative to peers.
Competitive Landscape & Sector Positioning
This analysis explores 3M Company’s strategic positioning, revenue segments, key products, and main competitors within its industrial sector. I will assess whether 3M holds a competitive advantage over its peers.
Strategic Positioning
3M Company maintains a diversified product portfolio across Safety and Industrial, Transportation and Electronics, Health Care, and Consumer segments. Geographically, it generates significant revenue from the Americas (13.6B), Asia Pacific (7.1B), and EMEA (4.3B), reflecting broad global exposure.
Revenue by Segment
The pie chart displays 3M Company’s revenue breakdown by segment for fiscal year 2025, highlighting the relative contribution of each division to total sales.
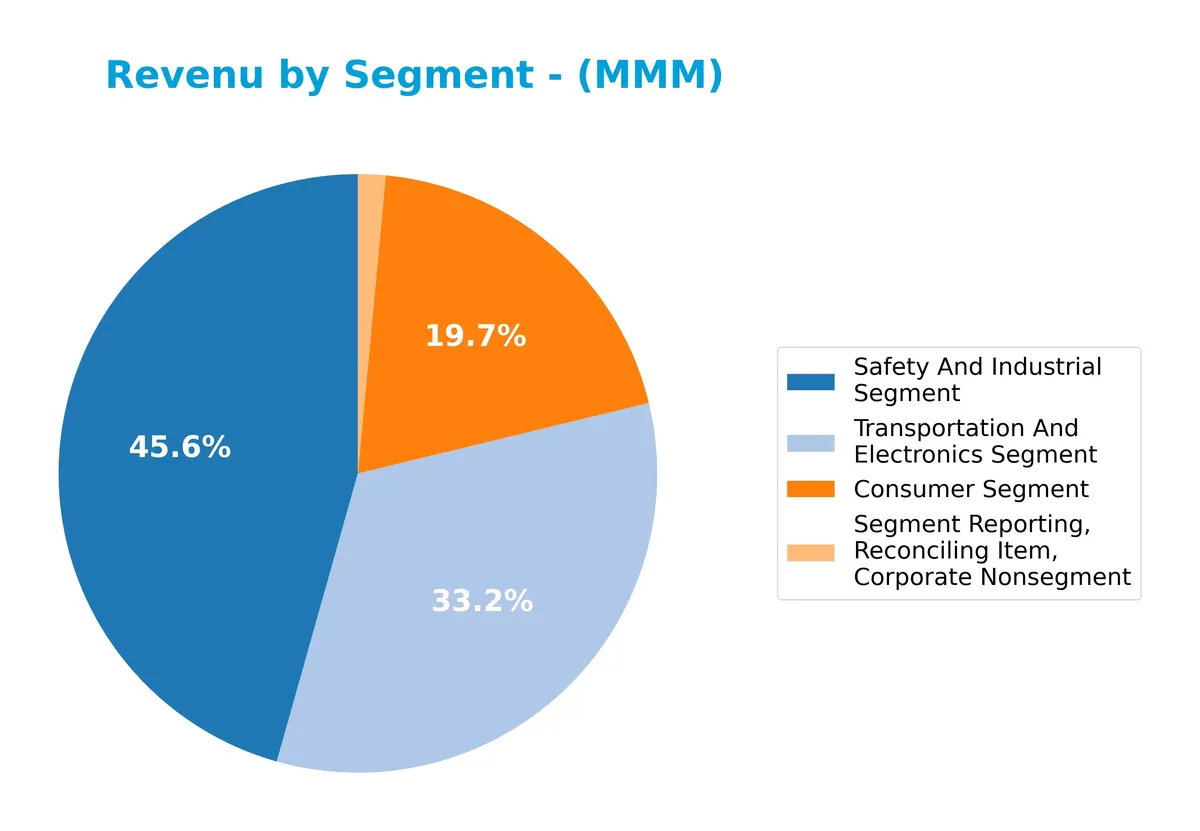
In 2025, the Safety and Industrial segment dominates with $11.4B, reflecting its role as the core revenue driver, consistent with historical trends. Transportation and Electronics follows at $8.3B, showing a slight decline from prior years. The Consumer segment contributes $4.9B, stable but smaller. The corporate nonsegment item at $372M is negligible. The data suggests a concentration risk in Safety and Industrial, though the segment’s steady revenue supports 3M’s industrial moat.
Key Products & Brands
The table below outlines 3M Company’s primary products and brands across its major business segments:
| Product | Description |
|---|---|
| Safety and Industrial | Industrial abrasives, finishing for metalworking, autobody repair solutions, closure systems, electrical products, respiratory and fall protection, adhesives, tapes, mineral granules for shingles. |
| Transportation and Electronics | Ceramic solutions, attachment tapes, films, sound and temperature management for vehicles, large format graphic films, light management films, electronics assembly solutions, packaging, reflective signage. |
| Health Care | Food safety indicators, healthcare coding software, skin and wound care products, infection prevention, dentistry and orthodontia solutions, filtration and purification systems. |
| Consumer | Consumer bandages, braces, supports, respirators, cleaning products, retail abrasives, paint accessories, car care products, picture hanging, air quality solutions, stationery products. |
3M’s diverse product portfolio spans industrial, transportation, healthcare, and consumer markets. This broad exposure supports resilience amid sector-specific cycles.
Main Competitors
There are 2 competitors in the Industrials Conglomerates sector. The table below lists the top 10 leaders by market capitalization:
| Competitor | Market Cap. |
|---|---|
| Honeywell International Inc. | 124B |
| 3M Company | 86B |
3M Company ranks 2nd among its competitors. Its market cap is 70% of the leader, Honeywell International Inc. The company sits below both the average market cap of the top 10 and the sector median. It trails Honeywell by a significant 43% margin.
Comparisons with competitors
Check out how we compare the company to its competitors:
Does 3M have a competitive advantage?
3M Company presents a slight competitive advantage by creating value with a ROIC 2.9% above its WACC, signaling efficient capital use despite a declining profitability trend. Historically, 3M’s diversified industrial segments and global footprint support consistent returns, though recent income statement trends show pressure on growth and margins.
Looking ahead, 3M’s broad product portfolio across Safety, Transportation, Healthcare, and Consumer sectors offers multiple avenues for innovation and market expansion. Continued investments in new technologies and geographic markets may help offset recent unfavorable revenue and earnings trends, sustaining its position in industrial conglomerates.
SWOT Analysis
This SWOT analysis highlights 3M Company’s key internal and external factors shaping its strategic position.
Strengths
- diversified global portfolio
- strong ROE at 69%
- solid liquidity ratios
Weaknesses
- declining revenue and net income growth
- high debt-to-equity ratio at 2.75
- elevated valuation multiples (PE 26.3, PB 18.2)
Opportunities
- expansion in Asia Pacific markets
- innovation in healthcare and safety segments
- leveraging technology for operational efficiency
Threats
- intense competition across industrial sectors
- margin pressure from rising costs
- macroeconomic uncertainties affecting global demand
3M’s strong operational base and value creation capacity face headwinds from declining growth and leverage risks. The company must prioritize innovation and cost control to sustain its competitive moat and navigate economic volatility.
Stock Price Action Analysis
The weekly stock chart highlights price movements and volatility for 3M Company over the past 12 months:
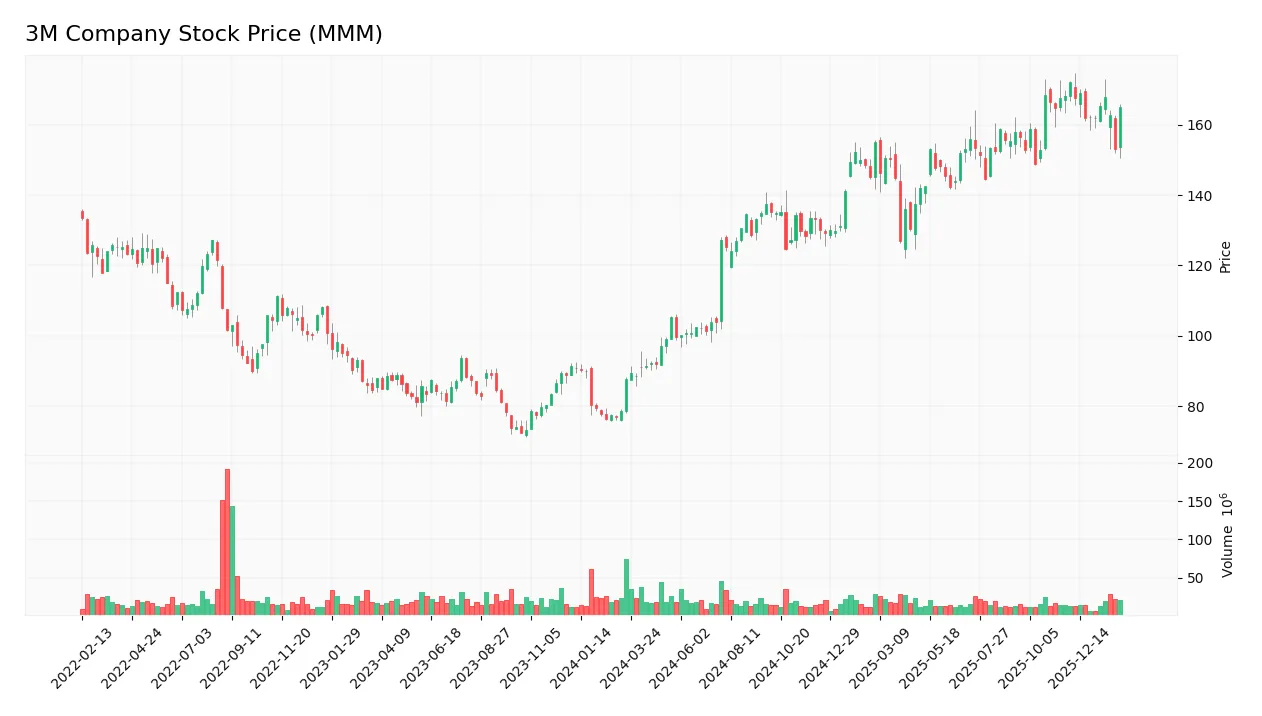
Trend Analysis
Over the past 12 months, 3M’s stock rose 88.04%, indicating a strong bullish trend with decelerating momentum. The price ranged between 87.79 and 172.05, showing significant volatility with a 22.86 standard deviation. In the recent 11-week span, the trend is neutral with a slight 1.79% decline and mild negative slope.
Volume Analysis
Trading volume for 3M has been decreasing overall, with buyers accounting for 55.75% of total volume historically. Over the recent period, buyer dominance persists at 54.39%, reflecting slightly buyer-driven activity. This suggests moderate investor interest, but waning market participation in the short term.
Target Prices
Analysts present a solid target consensus for 3M Company, reflecting moderate optimism.
| Target Low | Target High | Consensus |
|---|---|---|
| 136 | 190 | 169.5 |
The target range suggests analysts expect upside potential near 12% from current levels, indicating confidence tempered by sector headwinds.

Don’t Let Luck Decide Your Entry Point
Optimize your entry points with our advanced ProRealTime indicators. You’ll get efficient buy signals with precise price targets for maximum performance. Start outperforming now!
Analyst & Consumer Opinions
This section examines recent analyst grades and consumer feedback surrounding 3M Company’s market performance and product reception.
Stock Grades
Here is the latest summary of 3M Company’s stock grades from leading financial institutions:
| Grading Company | Action | New Grade | Date |
|---|---|---|---|
| RBC Capital | Maintain | Underperform | 2026-01-21 |
| Citigroup | Maintain | Neutral | 2026-01-21 |
| Deutsche Bank | Maintain | Hold | 2026-01-21 |
| Morgan Stanley | Maintain | Equal Weight | 2026-01-21 |
| Wells Fargo | Maintain | Overweight | 2026-01-21 |
| JP Morgan | Downgrade | Neutral | 2026-01-16 |
| Deutsche Bank | Downgrade | Hold | 2025-12-08 |
| Barclays | Maintain | Overweight | 2025-12-04 |
| Wells Fargo | Maintain | Overweight | 2025-10-22 |
| RBC Capital | Maintain | Underperform | 2025-10-22 |
The overall trend shows a cautious stance with multiple holds and neutral ratings, reflecting moderate confidence. Notably, Wells Fargo and Barclays maintain overweight ratings, signaling selective optimism amid general market conservatism.
Consumer Opinions
Consumer sentiment around 3M Company reflects a mix of appreciation for innovation and concerns over product pricing.
| Positive Reviews | Negative Reviews |
|---|---|
| “3M’s products are reliable and consistently high quality.” | “Some products feel overpriced compared to competitors.” |
| “Innovative solutions that improve everyday tasks.” | “Customer service response times can be slow.” |
| “Durable materials that last longer than alternatives.” | “Occasional delays in product availability.” |
Overall, consumers praise 3M for durable, innovative products that justify brand loyalty. However, pricing and customer service issues emerge as recurring concerns that could impact satisfaction.
Risk Analysis
Below is a summary of key risks facing 3M Company, categorized by type, with their likelihood and potential impact:
| Category | Description | Probability | Impact |
|---|---|---|---|
| Financial Leverage | High debt-to-equity ratio of 2.75 raises refinancing risks. | Medium | High |
| Valuation | Elevated P/E (26.3) and P/B (18.2) ratios suggest overvaluation. | High | Medium |
| Market Volatility | Beta of 1.17 indicates sensitivity to market swings. | Medium | Medium |
| Operational | Diverse segments face supply chain disruptions and raw material inflation. | Medium | Medium |
| Regulatory | Exposure to healthcare and industrial regulations worldwide. | Low | Medium |
| Dividend Risk | Dividend yield is modest at 1.37%, limiting income appeal. | Low | Low |
The most pressing risks are 3M’s high leverage and stretched valuation multiples. Its debt load, notably above industrial peers, could pressure cash flows during tightening credit conditions. Meanwhile, premium valuation metrics reduce margin for error if earnings falter. However, a strong Altman Z-Score (4.23, safe zone) and a robust Piotroski Score (7, strong) support financial stability, mitigating default risk despite debt concerns.
Should You Buy 3M Company?
3M Company appears to be creating value with a slightly favorable moat despite declining profitability. Its leverage profile could be seen as substantial, posing risks. The overall rating is B, suggesting a moderate but cautiously positive financial health profile.
Strength & Efficiency Pillars
3M Company exhibits robust profitability with a net margin of 13.03% and an impressive return on equity of 69.12%. Its return on invested capital (ROIC) stands at 11.53%, comfortably exceeding its weighted average cost of capital (WACC) at 8.63%, confirming the company as a clear value creator. Financial health remains solid, supported by a safe zone Altman Z-score of 4.23 and a strong Piotroski score of 7. These metrics collectively underline 3M’s operational efficiency and risk resilience.
Weaknesses and Drawbacks
Despite solid fundamentals, 3M faces valuation headwinds. The price-to-earnings ratio of 26.32 and price-to-book ratio of 18.19 indicate a high premium relative to peers, raising concerns about overvaluation. Leverage is a notable risk, with a debt-to-equity ratio of 2.75 flagged as very unfavorable, suggesting heavy reliance on debt financing. Although the current ratio of 1.71 is favorable, the elevated debt load could pressure liquidity and capital allocation flexibility.
Our Verdict about 3M Company
3M’s long-term fundamental profile is favorable, rooted in strong profitability and value creation. The stock’s overall bullish trend adds appeal, supported by buyer dominance of 54.39% in recent months. This combination suggests that 3M may appear attractive for long-term exposure, though investors should remain cautious of its high leverage and premium valuation.
Disclaimer: This content is for informational purposes only and does not constitute financial, investment, or other professional advice. Investing in financial markets involves a significant risk of loss, and past performance is not indicative of future results.
Additional Resources
- 3M Company (MMM) Appoints New Independent Director to Board – GuruFocus (Feb 05, 2026)
- 3M Company (MMM) Was “Wildly Misjudged,” Says Jim Cramer – Yahoo Finance (Jan 31, 2026)
- 3M Company (NYSE:MMM) to Issue Quarterly Dividend of $0.78 – MarketBeat (Feb 04, 2026)
- 3M (MMM) Stock Analysis 2026: Performance, Earnings & Price Targets – News and Statistics – IndexBox (Feb 02, 2026)
- 3M Board Declares Quarterly Dividend – Finviz (Feb 03, 2026)
For more information about 3M Company, please visit the official website: 3m.com